instrumental techniques applied to mineralogy and geochemistry
instrumental techniques applied to mineralogy and geochemistry
instrumental techniques applied to mineralogy and geochemistry

Create successful ePaper yourself
Turn your PDF publications into a flip-book with our unique Google optimized e-Paper software.
Radiogenic iso<strong>to</strong>pes <strong>and</strong> their applications within a range of scientific fields 117<br />
Successful sphalerite datings have been reported on e.g. Mississippi Valley type<br />
(MVT) deposits (see e.g Nakai et al., 1990). This approach requires that a series of<br />
sphalerites are analyzed, defining a certain range in Rb/Sr ratios, which makes it possible<br />
<strong>to</strong> fit a line (this line is called an isochron having the feature that its slope is proportional<br />
<strong>to</strong> the age of the system) in a diagram where 87 Rb/ 86 Sr is plotted versus 87 Sr/ 86 Sr. As<br />
sphalerite contains only very minor amounts of Sr <strong>and</strong> Rb, the crucial step is <strong>to</strong> avoid the<br />
contamination of hypothetically present fluid inclusions. If such inclusions occur, these<br />
could carry small amounts of Rb <strong>and</strong> Sr that may disrupt the iso<strong>to</strong>pe systematics related<br />
<strong>to</strong> the proper ore-forming episode. The way <strong>to</strong> deal with this is <strong>to</strong> carefully grind the<br />
sphalerites using a boron carbide mortar with a very hard surface, thereby removing fluid<br />
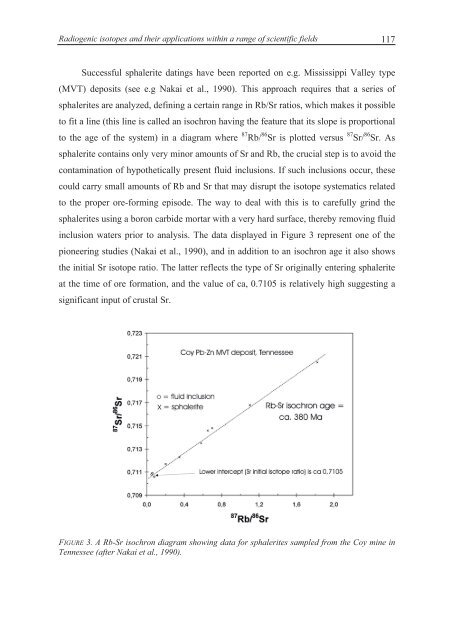
inclusion waters prior <strong>to</strong> analysis. The data displayed in Figure 3 represent one of the<br />
pioneering studies (Nakai et al., 1990), <strong>and</strong> in addition <strong>to</strong> an isochron age it also shows<br />
the initial Sr iso<strong>to</strong>pe ratio. The latter reflects the type of Sr originally entering sphalerite<br />
at the time of ore formation, <strong>and</strong> the value of ca, 0.7105 is relatively high suggesting a<br />
significant input of crustal Sr.<br />
FIGURE 3. A Rb-Sr isochron diagram showing data for sphalerites sampled from the Coy mine in<br />
Tennessee (after Nakai et al., 1990).