AP Lab 24 - Transpiration
AP Lab 24 - Transpiration
AP Lab 24 - Transpiration

Create successful ePaper yourself
Turn your PDF publications into a flip-book with our unique Google optimized e-Paper software.
Name: ______________________________ <strong>AP</strong> Biology – <strong>Lab</strong> <strong>24</strong><br />
LAB <strong>24</strong> – <strong>Transpiration</strong><br />
Objectives:<br />
To understand how water moves from roots to leaves in terms of the physical/chemical<br />
properties of water and the forces provided by differences in water potential.<br />
To test the effects of environmental variables on rates of transpiration using a controlled<br />
experiment.<br />
Introduction:<br />
The amount of water needed daily by plants for the growth and maintenance of tissues is small<br />
in comparison to the amount that is lost through the process of transpiration (the evaporation<br />
of water from the plant surface) and guttation (the lost of liquids from the ends of vascular<br />
tissues at the margins of leaves). If this water is not replaced, the plant will wilt and may die.<br />
The transport of water up from the roots in the xylem is governed by differences in water<br />
potential (the potential energy of water molecules). These differences account for water<br />
movement from cell to cell and over long distances in the plant. Gravity, pressure, and solute<br />
concentration all contribute to water potential, and water always moves from an area of high<br />
water potential to an area of low water potential (see <strong>Lab</strong> 4 – Diffusion and Osmosis for a<br />
review of w ). The movement itself is facilitated by osmosis, root pressure, and adhesion and<br />
cohesion of water molecules (see Lecture <strong>24</strong> – Regulation and Transport in Plants for a review<br />
of water flow through a plant’s vascular tissues.<br />
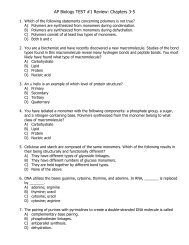
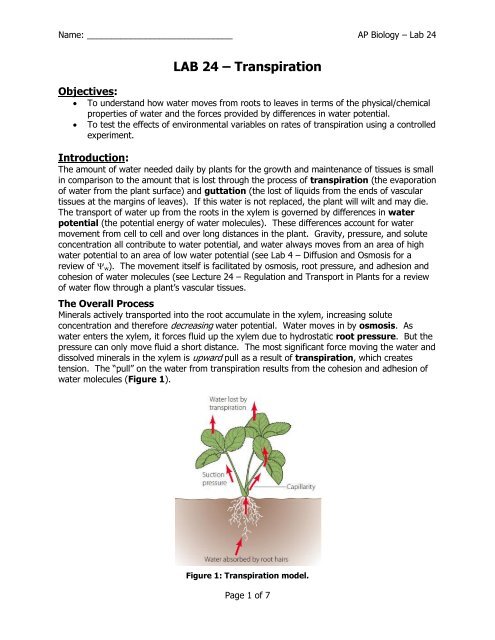
The Overall Process<br />
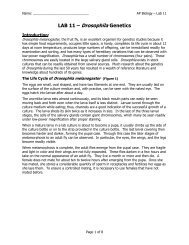
Minerals actively transported into the root accumulate in the xylem, increasing solute<br />
concentration and therefore decreasing water potential. Water moves in by osmosis. As<br />
water enters the xylem, it forces fluid up the xylem due to hydrostatic root pressure. But the<br />
pressure can only move fluid a short distance. The most significant force moving the water and<br />
dissolved minerals in the xylem is upward pull as a result of transpiration, which creates<br />
tension. The “pull” on the water from transpiration results from the cohesion and adhesion of<br />
water molecules (Figure 1).<br />
Figure 1: <strong>Transpiration</strong> model.<br />
Page 1 of 7
The Details<br />
<strong>Transpiration</strong> begins with the evaporation of water through the stomata (stomates), small<br />
openings in the leaf surface which open into air spaces that surround the mesophyll cells of the<br />
leaf. The moist air in these spaces has a higher water potential than the outside air, and water<br />
tends to evaporate from the leaf surface (moving from an area of high water potential to an<br />
area of lower water potential). The moisture in the air spaces is replaced by water from the<br />
adjacent mesophyll cells, lowering their water potential (since the cytoplasm becomes more<br />
concentrated). Water will then move into the mesophyll cells by osmosis from surrounding<br />
cells with high water potentials, including the xylem. As each water molecule moves into a<br />
mesophyll cell, it exerts a pull on the column of water molecules existing in the xylem all the<br />
way from the leaves to the roots. This transpirational pull occurs because of (1) the cohesion<br />
of water molecules to one another due to hydrogen bond formation, and (2) by adhesion of<br />
water molecules to the walls of the xylem cells which aids in offsetting the downward pull of<br />
gravity.<br />
The upward transpirational pull on the fluid in the xylem causes a tension (negative pressure)<br />
to form in the xylem, pulling the walls of the xylem inward. The tension also contributes to the<br />
lowering of water potential in the xylem. This decrease in water potential, transmitted all the<br />
way from the leaf to the roots, causes water to move inward from the soil, across the cortex of<br />
the root, and into the xylem.<br />
Plants lose as much as 90% of the water that enters the roots by the process of transpiration.<br />
Evaporation through the open stomates is clearly a major route of water loss in plants.<br />
However, the stomates must open to allow the entry of CO 2 used in photosynthesis. Therefore,<br />
a balance must be maintained between the gain of CO 2 and the loss of water by regulating the<br />
opening and closing of the stomata on the leaf surface. Many environmental conditions<br />
influence the opening and closing of stomates and also affect the rate of transpiration.<br />
Temperature, light intensity, air currents, and humidity are some of these factors. Different<br />
plants also vary in the rate of transpiration and in the regulation of stomatal opening. In this<br />
lab, you will measure transpiration under various laboratory conditions using a potometer.<br />
Page 2 of 7
Procedure:<br />
1. Obtain 3 pieces of flexible plastic tubing. There should be a 1”, 6”, and 9” piece.<br />
2. Connect the 6” and 9” pieces of tubing to each opposing arm of a T-connector.<br />
3. Attach the remaining 1” piece of tubing to the bottom of the T-connector.<br />
4. Insert the tapered end of a graduated pipet into the 6” piece of tubing. Ensure that the<br />
pipet is firmly inserted. You want to create an airtight system. BE CAREFUL NOT TO SN<strong>AP</strong><br />
THE GLASS PIPET IN YOUR HANDS!<br />
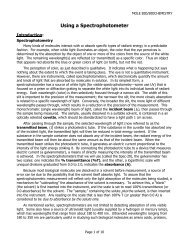
5. Bend the potometer setup into a J-shape and attach it to a ring stand using two (or more if<br />
needed) ring stand clamps. Clamp the potometer in place so that the end of the tubing is<br />
about half the height of the graduated pipet (see Figure 2).<br />
Figure 2: Potometer setup.<br />
Page 3 of 7
6. Fill a 10 mL syringe completely with water. Remove any air bubbles.<br />
7. Attach the tip of the syringe to the end of the 1” piece of tubing on the T-connector.<br />
8. Charge the potometer by adding water with the syringe until the level of water forms a<br />
bead on top of the 9” piece of tubing.<br />
9. Using a scalpel, cleanly cut the stem of a bean seedling near the soil. The diameter of the<br />
plant stem should fit snugly into the end of the tubing without having to force it in and<br />
damaging the tissue. (**It may require several cuts to obtain a suitable piece of plant<br />
stem—I recommend first cutting a ‘thick’ portion, and then trim down to size if necessary**)<br />
10. Insert at least ½” of the stem of the seedling into the flexible tubing. Be sure that there<br />
are no air bubbles in the potometer at the base of the seedling. Remember, you want an<br />
airtight system. If air bubbles are present, remove the seedling, cut a couple of millimeters<br />
off the end, and reinsert it into the tubing.<br />
11. Dry the area at the base of the stem near the tubing and seal it with petroleum jelly. Your<br />
completed potometer should resemble Figure 2.<br />
12. “Zero” it by gently depressing the plunger of the syringe until the water level reaches the<br />
zero mark in the graduated pipet. (IF THERE IS NOT ENOUGH WATER IN THE SYRINGE TO<br />
DO THIS, MAKE SURE YOU RECORD THE STARTING LEVEL OF THE WATER.)<br />
13. Allow the potometer to equalize for approximately 10 minutes.<br />
14. Record your initial reading – time = 0 (which should be near 0.000 mL) for your setup in<br />
Table 1. Be sure to label the condition that your group was assigned in the data table.<br />
Monitor your potometer for 30 minutes. Record data every three minutes.<br />
15. Calculate the amount of water lost from Table 1 and enter this in Table 2 for each interval.<br />
16. This procedure will be repeated in three (or more – depending on class size) other<br />
environmental conditions. Your group will be assigned one of the following variations:<br />
a. Setup 1: Study the plant in room conditions.<br />
b. Setup 2: Place a fan on low setting, approximately three feet from the plant.<br />
c. Setup 3: Mist the plant leaves with water and place a plastic bag over the plant.<br />
d. Setup 4: Place the plant in darkness.<br />
e. Setup 5: Place the plant directly under a fluorescent Gro-Light<br />
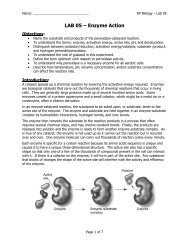
17. Once you have completed the experiment, cut the leaves off your seedling and gently blot<br />
off any excess moisture. Arranging all the cut-off leaves on the grid (Figure 3 – found in<br />
the back of the lab), trace the edge pattern directly onto the grid. Count all of the grid<br />
boxes that are completely within the tracing and estimate the number of grids that lie<br />
partially within the tracing. Figure 3 has been constructed so that a square of 4 blocks<br />
equals 1 cm 2 . The total surface area can then be calculated by dividing the total number of<br />
blocks covered (totally and estimated sum of all partials) by 4. This will be in cm 2 – you<br />
need to convert to m 2 (remember: 1 cm = 0.01 m). Record this value and make sure to<br />
indicate this in your results section. You will need this to calculate water loss per m 2 .<br />
18. Calculate the water loss per square meter of leaf surface by dividing the water loss at each<br />
reading by the leaf surface area you calculated. Record all results in Table 2.<br />
19. Finally, record the data from each group in the class in Table 3.<br />
Page 4 of 7
Results:<br />
Table 1: Potometer Readings for the Variable: _____________________<br />
Time (min) 0 3 6 9 12 15 18 21 <strong>24</strong> 27 30<br />
Reading (mL)<br />
Table 2: Individual Water Loss (mL and mL/m 2 ) for the Variable: _____________________<br />
Time (min) 0 3 6 9 12 15 18 21 <strong>24</strong> 27 30<br />
Water Loss<br />
(mL)<br />
Water Loss<br />
per m 2<br />
Table 3: Water Loss in mL/m 2 for each Variable<br />
Time (min) 0 3 6 9 12 15 18 21 <strong>24</strong> 27 30<br />
Room<br />
Fan<br />
Mist<br />
Darkness<br />
Gro-Light<br />
TBD:<br />
Page 5 of 7
Hints For Your <strong>Lab</strong> Report:<br />
The Introduction section of your lab should have (but not be limited to) your hypotheses for<br />
each of the variables that will be tested. Sequence the hypothesized order of water loss from<br />
most to least. A visual – made via an Excel ‘drawing’ – should be included with your written<br />
hypothesis showing the hypothesized respective rates of transpiration.<br />
The Results section of your lab report will include:<br />
<br />
<br />
<br />
Indicate what total surface area of your group’s leaves were. Show all calculations!<br />
All data tables (properly formatted and labeled).<br />
Graph of the water loss vs. time of each of the treatments on one graph. You may<br />
have to convert data to scientific notation. All numbers should have been recorded to<br />
the nearest thousandth. For mL/m 2 , go to the nearest hundredth.<br />
Page 6 of 7
Figure 3<br />
Page 7 of 7