2006 Parks, Trails and Open Space Plan - City of Lakeville
2006 Parks, Trails and Open Space Plan - City of Lakeville 2006 Parks, Trails and Open Space Plan - City of Lakeville
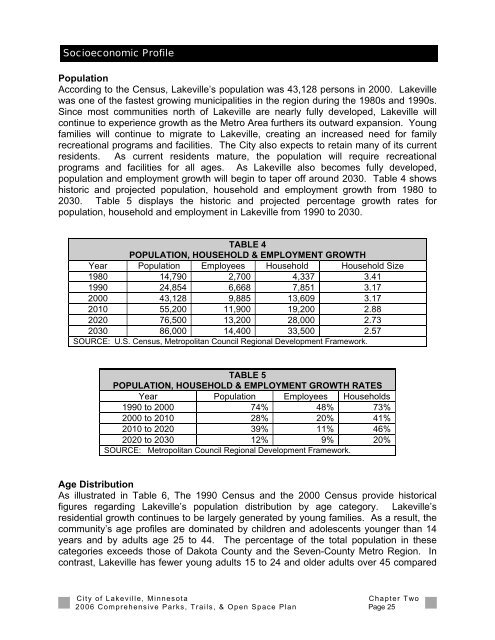
Socioeconomic Profile Population According to the Census, Lakeville’s population was 43,128 persons in 2000. Lakeville was one of the fastest growing municipalities in the region during the 1980s and 1990s. Since most communities north of Lakeville are nearly fully developed, Lakeville will continue to experience growth as the Metro Area furthers its outward expansion. Young families will continue to migrate to Lakeville, creating an increased need for family recreational programs and facilities. The City also expects to retain many of its current residents. As current residents mature, the population will require recreational programs and facilities for all ages. As Lakeville also becomes fully developed, population and employment growth will begin to taper off around 2030. Table 4 shows historic and projected population, household and employment growth from 1980 to 2030. Table 5 displays the historic and projected percentage growth rates for population, household and employment in Lakeville from 1990 to 2030. TABLE 4 POPULATION, HOUSEHOLD & EMPLOYMENT GROWTH Year Population Employees Household Household Size 1980 14,790 2,700 4,337 3.41 1990 24,854 6,668 7,851 3.17 2000 43,128 9,885 13,609 3.17 2010 55,200 11,900 19,200 2.88 2020 76,500 13,200 28,000 2.73 2030 86,000 14,400 33,500 2.57 SOURCE: U.S. Census, Metropolitan Council Regional Development Framework. TABLE 5 POPULATION, HOUSEHOLD & EMPLOYMENT GROWTH RATES Year Population Employees Households 1990 to 2000 74% 48% 73% 2000 to 2010 28% 20% 41% 2010 to 2020 39% 11% 46% 2020 to 2030 12% 9% 20% SOURCE: Metropolitan Council Regional Development Framework. Age Distribution As illustrated in Table 6, The 1990 Census and the 2000 Census provide historical figures regarding Lakeville’s population distribution by age category. Lakeville’s residential growth continues to be largely generated by young families. As a result, the community’s age profiles are dominated by children and adolescents younger than 14 years and by adults age 25 to 44. The percentage of the total population in these categories exceeds those of Dakota County and the Seven-County Metro Region. In contrast, Lakeville has fewer young adults 15 to 24 and older adults over 45 compared City of Lakeville, Minnesota Chapter Two 2006 Comprehensive Parks, Trails, & Open Space Plan Page 25
to the Metro Area as a whole. Lakeville is significantly lower in senior population compared to Dakota County and the Metro Area. As the City matures, its age profile will likely become more consistent with the remainder of Dakota County and ultimately, the Metropolitan Area. Lakeville’s projected growth through the next decade will still be primarily comprised of young families. However, the City must be cognizant of the maturation of its existing population and address its changing demographics in its recreational planning. The 1990 Census showed a median age of 27.9 in the City, while the 2000 Census indicated a median age of 31.5. The change in median age illustrates the gradual maturation of the City’s population that will continue through 2010 and beyond. Age Group TABLE 6 POPULATION ACCORDING TO AGE GROUP 1990 & 2000 No. 1990 Lakeville Dakota County 7-County Metro % % No. % No. 1990 2000 2000 2000 2000 No. 2000 % 2000 School Age: 0-4 2,952 4,358 11.9 10.1 27,585 7.8 188,236 7.1 5-9 2,747 4,655 11.0 10.8 29,549 8.3 198,690 7.5 10-14 2,128 4,413 8.6 10.2 30,047 8.4 197,611 7.5 15-19 1,566 3,104 6.3 7.2 25,050 7.0 183,491 6.9 Sub-Total 9,939 16,530 37.7 38.3 112,231 31.5 768,028 29.1 Labor Force: 20-24 1,353 1,561 5.4 3.6 19,817 5.6 173,732 6.6 25-34 6,083 6,554 24.4 15.2 54,030 15.2 411,155 15.6 35-44 4,625 9,757 18.6 22.6 68,194 19.2 469,324 17.8 45-54 1,961 5,215 7.9 12.1 49,249 13.8 363,592 13.8 55-64 854 2,285 3.4 5.3 26,137 7.3 200,980 7.6 Sub-Total 14,876 25,372 60.0 59.0 217,427 61.1 1,618,783 61.3 Retired: 65+ 585 1,226 2.3 3.0 26,246 7.4 255,245 9.7 TOTAL 24,854 43,128 100.0 100.0 355,904 100.0 2,642,056 100.0 SOURCE: U.S. Census 1990, 2000 NOTE: Seven County Metropolitan Area includes Anoka, Carver, Dakota, Hennepin, Ramsey, Scott and Washington Counties. School Enrollment Lakeville is served by Lakeville School District 194, Rosemount School District 196, and Farmington School District 192, as shown on Map 7. Tables 7, 8 and 9 show enrollment figures for the three districts from the 2000-2001 school year through the 2004-2005 school year. Official school enrollment numbers are measured in October. Enrollments in the Farmington and Lakeville School Districts have experienced significant increases in student enrollment from 2000 to 2005. The most substantial increases were among the Pre-Kindergarten and 6 th -12 th grades. The Rosemount School District has been experiencing gradual declines in student enrollment due to a City of Lakeville, Minnesota Chapter Two 2006 Comprehensive Parks, Trails, & Open Space Plan Page 26
- Page 2 and 3: Table of Contents Page CHAPTER 1 -
- Page 4 and 5: Page LIST OF MAPS Map 1 - Metropoli
- Page 6 and 7: Chapter 1 Plan Introduction Introdu
- Page 8 and 9: • Transportation. Integral to the
- Page 10 and 11: Chapter 2 Community Characteristics
- Page 12 and 13: City of Lakeville, Minnesota Chapte
- Page 14 and 15: City of Lakeville 2006 Parks, Trail
- Page 16 and 17: The staged MUSA expansions are prop
- Page 18 and 19: City of Lakeville 2006 Parks, Trail
- Page 20 and 21: Natural Environment Greenway Corrid
- Page 22 and 23: City of Lakeville 2006 Parks, Trail
- Page 26 and 27: decreasing amount of vacant land an
- Page 28 and 29: Crystal Lake Elementary ROSEMOUNT S
- Page 30 and 31: without children, while the percent
- Page 32 and 33: Primary Function/User Groups: Exten
- Page 34 and 35: Ice Hockey Basketball Tennis Comple
- Page 36 and 37: Passive Picnic accommodations for
- Page 38 and 39: oadways and property linkages or ot
- Page 40 and 41: Desirable Size in Acres: Varies by
- Page 42 and 43: Existing Park Facility Inventories
- Page 44 and 45: City of Lakeville, Minnesota Chapte
- Page 46 and 47: TABLE 14 Park Facilities (as of Jan
- Page 48 and 49: City of Lakeville, Minnesota Chapte
- Page 50 and 51: Existing Trail Facility Inventories
- Page 52 and 53: City of Lakeville, Minnesota Chapte
- Page 54 and 55: City of Lakeville, Minnesota Chapte
- Page 56 and 57: Dakota County/Empire Township Regio
- Page 58 and 59: City of Lakeville, Minnesota Chapte
- Page 60 and 61: The Dakota County Fairgrounds are l
- Page 62 and 63: City of Lakeville, Minnesota Chapte
- Page 64 and 65: City of Lakeville, Minnesota Chapte
- Page 66 and 67: Crystal Lake Golf Course 16725 Inns
- Page 68 and 69: City of Lakeville, Minnesota Chapte
- Page 70 and 71: Lakeville’s Parks, Trails and Ope
- Page 72 and 73: • Ritter Farm Park is a very uniq
Socioeconomic Pr<strong>of</strong>ile<br />
Population<br />
According to the Census, <strong>Lakeville</strong>’s population was 43,128 persons in 2000. <strong>Lakeville</strong><br />
was one <strong>of</strong> the fastest growing municipalities in the region during the 1980s <strong>and</strong> 1990s.<br />
Since most communities north <strong>of</strong> <strong>Lakeville</strong> are nearly fully developed, <strong>Lakeville</strong> will<br />
continue to experience growth as the Metro Area furthers its outward expansion. Young<br />
families will continue to migrate to <strong>Lakeville</strong>, creating an increased need for family<br />
recreational programs <strong>and</strong> facilities. The <strong>City</strong> also expects to retain many <strong>of</strong> its current<br />
residents. As current residents mature, the population will require recreational<br />
programs <strong>and</strong> facilities for all ages. As <strong>Lakeville</strong> also becomes fully developed,<br />
population <strong>and</strong> employment growth will begin to taper <strong>of</strong>f around 2030. Table 4 shows<br />
historic <strong>and</strong> projected population, household <strong>and</strong> employment growth from 1980 to<br />
2030. Table 5 displays the historic <strong>and</strong> projected percentage growth rates for<br />
population, household <strong>and</strong> employment in <strong>Lakeville</strong> from 1990 to 2030.<br />
TABLE 4<br />
POPULATION, HOUSEHOLD & EMPLOYMENT GROWTH<br />
Year Population Employees Household Household Size<br />
1980 14,790 2,700 4,337 3.41<br />
1990 24,854 6,668 7,851 3.17<br />
2000 43,128 9,885 13,609 3.17<br />
2010 55,200 11,900 19,200 2.88<br />
2020 76,500 13,200 28,000 2.73<br />
2030 86,000 14,400 33,500 2.57<br />
SOURCE: U.S. Census, Metropolitan Council Regional Development Framework.<br />
TABLE 5<br />
POPULATION, HOUSEHOLD & EMPLOYMENT GROWTH RATES<br />
Year Population Employees Households<br />
1990 to 2000 74% 48% 73%<br />
2000 to 2010 28% 20% 41%<br />
2010 to 2020 39% 11% 46%<br />
2020 to 2030 12% 9% 20%<br />
SOURCE: Metropolitan Council Regional Development Framework.<br />
Age Distribution<br />
As illustrated in Table 6, The 1990 Census <strong>and</strong> the 2000 Census provide historical<br />
figures regarding <strong>Lakeville</strong>’s population distribution by age category. <strong>Lakeville</strong>’s<br />
residential growth continues to be largely generated by young families. As a result, the<br />
community’s age pr<strong>of</strong>iles are dominated by children <strong>and</strong> adolescents younger than 14<br />
years <strong>and</strong> by adults age 25 to 44. The percentage <strong>of</strong> the total population in these<br />
categories exceeds those <strong>of</strong> Dakota County <strong>and</strong> the Seven-County Metro Region. In<br />
contrast, <strong>Lakeville</strong> has fewer young adults 15 to 24 <strong>and</strong> older adults over 45 compared<br />
<strong>City</strong> <strong>of</strong> <strong>Lakeville</strong>, Minnesota<br />
Chapter Two<br />
<strong>2006</strong> Comprehensive <strong>Parks</strong>, <strong>Trails</strong>, & <strong>Open</strong> <strong>Space</strong> <strong>Plan</strong> Page 25


