Download
Download
Download

You also want an ePaper? Increase the reach of your titles
YUMPU automatically turns print PDFs into web optimized ePapers that Google loves.
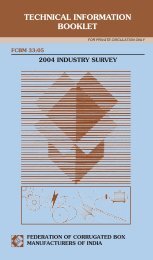
TECHNICAL INFORMATION<br />
BOOKLET<br />
FCBM 18:98<br />
1997 INDUSTRY SURVEY<br />
FOR PRIVATE CIRCULATION ONLY<br />
FEDERATION OF CORRUGATED BOX<br />
MANUFACTURERS OF INDIA
Compilation of statistical data, on the<br />
industry is necessary, for long term<br />
planing. This 1997 Industry Survey<br />
Booklet, being brought out by the R&D<br />
committee of our Federation, is a useful<br />
tool and a guiding factor on the direction<br />
the industry needs to take in the future.<br />
The R&D committee has been making<br />
continuous and consistent efforts in<br />
bringing out useful information booklets<br />
and publications for the benefit of our<br />
industry. These publications have been<br />
well received by everyone connected<br />
with the Corrugated Packaging Industry.<br />
This is an on going process. We have to<br />
continuously update the information and<br />
relevant factors which will serve as<br />
guidelines for the future. These booklets<br />
provide such useful data, and I am sure<br />
it will prove very useful for the members<br />
of our industry.<br />
I once again congratulate our R&D<br />
committee on its efforts and I do hope<br />
the committee will continue to bring out<br />
such useful publications.<br />
Ashwin Shah<br />
President<br />
Federation of Corrugated Box<br />
Manufacturers of India<br />
15.5.98<br />
2
INTRODUCTION<br />
Statistical analysis is a very useful tool to understand the profile<br />
of an industry and to predict the potential trends.<br />
The unique advantage of such analysis is that it allows compilation<br />
of useful data for the industry while protecting the participant’s<br />
proprietary information. In other words, by using statistical<br />
analysis we can come to some conclusions about the<br />
industry as a whole and yet not know any information about the<br />
organisations of the participants.<br />
The first survey was conducted by Indian Institute of Packaging<br />
in 1985 on our behalf. We conducted our own survey for the first<br />
time, in 1996 during the Annual Conference. Encouraged by the<br />
response another survey was conducted in 1997, during the<br />
Mount Abu Annual Conference.<br />
All three survey results are shown in this booklet<br />
The following points need to be highlighted:<br />
1. Number of participants in 1997 were 53, compared to 161<br />
in 1996. Yet the results are similar, thus reinforcing the<br />
power of statistical surveys to predict trends based on<br />
limited number of participants.<br />
2. Data on productivity and product category is same.<br />
3. Wastage appears to be lower at 3.43% compared to 3.8%<br />
in 1996<br />
4. Raw material profile GSM wise is same.<br />
5. Raw material category BF wise is same except for a shift<br />
away from 18 BF in favour of 20 BF.<br />
3
6. Market profile is same except for increase in Processed<br />
Foods category.<br />
Such annual reviews of trends affecting our industry are very<br />
useful. We hope to continue the surveys every year at the<br />
conferences.<br />
We hope to include some new information such as type of<br />
heating source, glue vs. stitch joints, etc., next year.<br />
We look forward to your comments/observations and your<br />
active participation in future surveys.<br />
Pankaj Shah<br />
Chairman<br />
R&D Committee<br />
4
1997 INDUSTRY SURVEY<br />
THE LEGEND<br />
Column A : Survey conducted during 26th FCBM<br />
Conference at Mount Abu on 14.12.1997<br />
For Comparison Purpose<br />
Column B : Survey conducted during 25th FCBM<br />
Conference held<br />
at Mumbai on 16.12.1996<br />
Column C : Survey conducted by Indian Institute of<br />
Packaging during 1985<br />
5
PRODUCTIVITY<br />
Table 1<br />
A B C<br />
Columns B and C are for comparison purpose only.<br />
* Not available<br />
No. of participants 53 161 144<br />
in the survey<br />
No. of Single Facers 99 237<br />
*<br />
used<br />
Average Single Facer<br />
per participant 1.87 1.5<br />
*<br />
Average production<br />
per day<br />
per Single Facer 2004 2150<br />
*<br />
(in kgs)<br />
Average number of<br />
people employed<br />
per participant 47 41 34<br />
Average production<br />
per day (in kgs) 3744 3172 1360<br />
Productivity<br />
kgs/person/day 80 78 40<br />
6
PRODUCT CATEGORY<br />
Number of plies A B C<br />
2-ply 2% 3%<br />
*<br />
3-ply 25% 28%<br />
*<br />
5-ply 50% 43%<br />
*<br />
7-ply 21% 21%<br />
*<br />
9-ply 2% 5%<br />
*<br />
Table 2<br />
Columns B and C are for comparison purpose only.<br />
* Not available<br />
7
Table 3<br />
WASTAGE<br />
Process waste A B C<br />
Average wastage 3.43% 3.8%<br />
*<br />
during manufacture<br />
(Not including<br />
trim, slots or<br />
punch scrap)<br />
Columns B and C are for comparison purpose only.<br />
Not available<br />
*<br />
8
RAW MATERIAL CATEGORY – GSM<br />
GSM A B C<br />
80 gsm 5% 5%<br />
*<br />
90 gsm 2% 1%<br />
*<br />
100 gsm 27% 24%<br />
*<br />
120 gsm 22% 24%<br />
*<br />
140 gsm 14% 12%<br />
*<br />
150 gsm 15% 18%<br />
*<br />
170 gsm 1% 1%<br />
*<br />
180 gsm 9% 10%<br />
*<br />
200 gsm 2% 1%<br />
*<br />
Other 3% 4%<br />
*<br />
Table 4<br />
100%<br />
Columns B and C are for comparison purpose only.<br />
* Not available<br />
9
Table 5<br />
RAW MATERIAL CATEGORY – BF<br />
Grade A B C<br />
14 BF or less 15% 16%<br />
*<br />
16 BF 14% 11%<br />
*<br />
18 BF 15% 21%<br />
*<br />
20 BF 21% 16%<br />
*<br />
22 BF 14% 14%<br />
*<br />
24 BF 8% 10%<br />
*<br />
25 BF or more 5% 4%<br />
*<br />
Duplex 4% 3%<br />
*<br />
Imported 3% 4%<br />
*<br />
Other 1% 1%<br />
*<br />
100%<br />
Columns B and C are for comparison purpose only.<br />
10
Table 6<br />
MARKET PROFILE<br />
Segment A B C<br />
Pharmaceutical 6% 9% 18%<br />
Processed Foods 19% 11% 15%<br />
Fresh Fruits/<br />
Vegetables 2% 5% 1%<br />
Soaps/Cosmetics 9% 7% 14%<br />
Beverages 2% 3%<br />
*<br />
Distillery 9% 8% 7%<br />
Tobacco/Cigarettes 3% 6% 2%<br />
Textiles/Yarns 20% 18% 9%<br />
Electricals/Lamps 2% 4% )<br />
) 9%<br />
Electronics 6% 4% )<br />
Glass 2% 2% 2%<br />
Engineering Goods 7% 7% 7%<br />
Consumer Durables 8% 7% 3%<br />
Defence 1% 1% 1%<br />
Miscellaneous 4% 8%<br />
*<br />
100%<br />
Columns B and C are for comparison purpose only.<br />
11
MEMBERS OF R & D COMMITTEE<br />
Shri PANKAJ SHAH<br />
Shri AL. ANNAMALAI<br />
Shri A. B. AJMERA<br />
Shri M. L. MEHRA<br />
Shri DEEPAK KILLAWALA<br />
Shri M. L. AGARWAL<br />
Shri B. K. MEHTA<br />
Shri K. B. DOSHI<br />
Shri P. B. PARIKH<br />
Shri HEMANT SARAOGI<br />
Shri SHILEN D. PATEL<br />
Shri HARISH MADAN<br />
Shri ROHIT CHOPRA<br />
Shri ANIL KUMAR REDDY<br />
Chairman<br />
Vice-Chairman<br />
Published in the interest of manufacturers and users of corrugated boxes.<br />
For additional copies, please write to:<br />
FEDERATION OF CORRUGATED BOX<br />
MANUFACTURERS OF INDIA<br />
138, Mittal Industrial Estate No. 3, M. Vasanji Road, Andheri (East),<br />
Mumbai-400 059, INDIA. Phone: (91) (22) 850 0687<br />
Fax: (91) (22) 850 4523 • E-mail: wicma@bom3.vsnl.net.in