- Page 1 and 2:
MATLAB ® 7 Programming
- Page 3:
Revision History June 2004 First pr
- Page 6 and 7:
Operating on Diagonal Matrices ....
- Page 8 and 9:
Creating a Cell Array .............
- Page 10 and 11:
Comma — , .......................
- Page 12 and 13:
Examples of Anonymous Functions ...
- Page 14 and 15:
Microsoft Excel Spreadsheets ......
- Page 16 and 17:
Features of Object-Oriented Program
- Page 18 and 19:
Object Precedence .................
- Page 20 and 21:
12 Programming Tips Command and Fun
- Page 22 and 23:
Converting Between Strings and Cell
- Page 24 and 25:
A External Interfaces Finding the D
- Page 26 and 27:
1 Data Structures Empty Matrices, S
- Page 28 and 29:
1 Data Structures (shown as E below
- Page 30 and 31:
1 Data Structures 0 0 0 0 0 0 0 0 0
- Page 32 and 33:
1 Data Structures 0.6068 0.7621 0.8
- Page 34 and 35:
1 Data Structures 3 5 7 3 5 7 3 5 7
- Page 36 and 37:
1 Data Structures A = 3:0.2:3.8 A =
- Page 38 and 39:
1 Data Structures 5000 50 B = [int8
- Page 40 and 41:
1 Data Structures class(x) ans = si
- Page 42 and 43:
1 Data Structures Matrix Indexing T
- Page 44 and 45:
1 Data Structures A used in the pre
- Page 46 and 47:
1 Data Structures 16 5 9 4 . . . 12
- Page 48 and 49:
1 Data Structures Getting Informati
- Page 50 and 51:
1 Data Structures Function islogica
- Page 52 and 53:
1 Data Structures This example runs
- Page 54 and 55:
1 Data Structures A = 10 20 30 40 5
- Page 56 and 57:
1 Data Structures This changes matr
- Page 58 and 59:
1 Data Structures A = [1+9i 2-8i 3+
- Page 60 and 61:
1 Data Structures rp = rp + blocksi
- Page 62 and 63:
1 Data Structures A = [1:8; 11:18;
- Page 64 and 65:
1 Data Structures rand('state', 0);
- Page 66 and 67:
1 Data Structures OperatingonDiagon
- Page 68 and 69:
1 Data Structures Empty Matrices, S
- Page 70 and 71:
1 Data Structures These operations
- Page 72 and 73:
1 Data Structures Use the isscalar
- Page 74 and 75:
1 Data Structures Full and Sparse M
- Page 76 and 77:
1 Data Structures Multidimensional
- Page 78 and 79:
1 Data Structures As you add dimens
- Page 80 and 81:
1 Data Structures Generating Arrays
- Page 82 and 83:
1 Data Structures • size — Retu
- Page 84 and 85:
1 Data Structures For example, cons
- Page 86 and 87:
1 Data Structures Avoiding Ambiguit
- Page 88 and 89:
1 Data Structures Permuting Array D
- Page 90 and 91:
1 Data Structures Computing with Mu
- Page 92 and 93:
1 Data Structures • As multivaria
- Page 94 and 95:
1 Data Structures A{2,2} = 7; B{1,1
- Page 96 and 97:
1 Data Structures Summary of Matrix
- Page 98 and 99:
1 Data Structures Functions to Dete
- Page 100 and 101:
1 Data Structures 1-76
- Page 102 and 103:
2 Data Types Cell Arrays (p. 2-94)
- Page 104 and 105:
2 Data Types Data Type Summary The
- Page 106 and 107:
2 Data Types Numeric Types Numeric
- Page 108 and 109:
2 Data Types the two equally nearby
- Page 110 and 111:
2 Data Types x = x = 127 -128 Also,
- Page 112 and 113:
2 Data Types Set the warning state
- Page 114 and 115:
2 Data Types Floating-Point Numbers
- Page 116 and 117:
2 Data Types isfloat(x) ans = 1 You
- Page 118 and 119:
2 Data Types In this example, 7.5 d
- Page 120 and 121:
2 Data Types 8.881784197001252e-016
- Page 122 and 123:
2 Data Types Note that the order of
- Page 124 and 125:
2 Data Types Complex Numbers Comple
- Page 126 and 127:
2 Data Types NaN MATLAB represents
- Page 128 and 129:
2 Data Types All available formats
- Page 130 and 131:
2 Data Types Integer Functions Func
- Page 132 and 133:
2 Data Types Infinity and NaN Funct
- Page 134 and 135:
2 Data Types 1 0 0 1 0 1 1 0 The MA
- Page 136 and 137:
2 Data Types A(B) ans = 5 15 30 35
- Page 138 and 139:
2 Data Types Characters and Strings
- Page 140 and 141:
2 Data Types name = ['Thomas R. Lee
- Page 142 and 143:
2 Data Types Phoenix length(strings
- Page 144 and 145:
2 Data Types • “Setting Field W
- Page 146 and 147:
2 Data Types Ordered Sequentially s
- Page 148 and 149:
2 Data Types An alternate syntax, t
- Page 150 and 151:
2 Data Types Precision is not usual
- Page 152 and 153:
2 Data Types Note You can specify m
- Page 154 and 155:
2 Data Types operator, specifying t
- Page 156 and 157:
2 Data Types Valid Syntax Invalid S
- Page 158 and 159:
2 Data Types A = 'fate'; B = 'cake'
- Page 160 and 161:
2 Data Types while (any(remainder))
- Page 162 and 163:
2 Data Types Converting from String
- Page 164 and 165:
2 Data Types Function Summary MATLA
- Page 166 and 167:
2 Data Types Functions to Determine
- Page 168 and 169:
2 Data Types Date Strings There are
- Page 170 and 171:
2 Data Types • The day field is a
- Page 172 and 173:
2 Data Types datestr(d) ans = 01-Ma
- Page 174 and 175:
2 Data Types Utility Functions (Con
- Page 176 and 177:
2 Data Types • “Applying Functi
- Page 178 and 179:
2 Data Types where the arguments ar
- Page 180 and 181:
2 Data Types You can access subarra
- Page 182 and 183:
2 Data Types Dynamic Field Names Ex
- Page 184 and 185:
2 Data Types Deleting Fields from S
- Page 186 and 187:
2 Data Types plot(mercury, 'b') plo
- Page 188 and 189:
2 Data Types There are at least two
- Page 190 and 191:
2 Data Types Element-by-element org
- Page 192 and 193:
2 Data Types Nesting Structures A s
- Page 194 and 195:
2 Data Types Cell Arrays A cell arr
- Page 196 and 197:
2 Data Types Operation Syntax Descr
- Page 198 and 199:
2 Data Types 3-by-3 Cell Array Note
- Page 200 and 201:
2 Data Types C5 = 'Jan' 'Feb' 'Mar'
- Page 202 and 203:
2 Data Types of an array without re
- Page 204 and 205:
2 Data Types Createa1-by-2arraywith
- Page 206 and 207:
2 Data Types ans = 7 ans = 2 ans =
- Page 208 and 209:
2 Data Types 3 4 B = reshape(A, 6,
- Page 210 and 211:
2 Data Types A{1,1} = [1 2; 3 4]; A
- Page 212 and 213:
2 Data Types [5x5 double] {2x2 cell
- Page 214 and 215:
2 Data Types G = cell(1,16); for m
- Page 216 and 217:
2 Data Types Function Handles A fun
- Page 218 and 219:
2 Data Types MATLAB Classes All MAT
- Page 220 and 221:
2 Data Types 2-120
- Page 222 and 223:
3 Basic Program Components Symbol R
- Page 224 and 225:
3 Basic Program Components Note If
- Page 226 and 227:
3 Basic Program Components Another
- Page 228 and 229:
3 Basic Program Components Verifyin
- Page 230 and 231:
3 Basic Program Components function
- Page 232 and 233:
3 Basic Program Components Evaluati
- Page 234 and 235:
3 Basic Program Components Keywords
- Page 236 and 237:
3 Basic Program Components Hereares
- Page 238 and 239:
3 Basic Program Components Operator
- Page 240 and 241:
3 Basic Program Components To test
- Page 242 and 243:
3 Basic Program Components Function
- Page 244 and 245:
3 Basic Program Components 5 11 10
- Page 246 and 247:
3 Basic Program Components Advantag
- Page 248 and 249:
3 Basic Program Components MATLAB E
- Page 250 and 251:
3 Basic Program Components This M-f
- Page 252 and 253:
3 Basic Program Components • “S
- Page 254 and 255:
3 Basic Program Components Operator
- Page 256 and 257:
3 Basic Program Components Word and
- Page 258 and 259:
3 Basic Program Components There ar
- Page 260 and 261:
3 Basic Program Components regexp(p
- Page 262 and 263:
3 Basic Program Components s = e =
- Page 264 and 265:
3 Basic Program Components ¥ dolla
- Page 266 and 267:
3 Basic Program Components Operator
- Page 268 and 269:
3 Basic Program Components Exact, M
- Page 270 and 271:
3 Basic Program Components As a sim
- Page 272 and 273:
3 Basic Program Components ans = De
- Page 274 and 275:
3 Basic Program Components Operator
- Page 276 and 277:
3 Basic Program Components Operator
- Page 278 and 279:
3 Basic Program Components Conditio
- Page 280 and 281:
3 Basic Program Components ans = g1
- Page 282 and 283:
3 Basic Program Components The dyna
- Page 284 and 285:
3 Basic Program Components at each
- Page 286 and 287:
3 Basic Program Components function
- Page 288 and 289:
3 Basic Program Components Operator
- Page 290 and 291:
3 Basic Program Components Find con
- Page 292 and 293:
3 Basic Program Components statemen
- Page 294 and 295:
3 Basic Program Components Characte
- Page 296 and 297:
3 Basic Program Components Quantifi
- Page 298 and 299:
3 Basic Program Components Named To
- Page 300 and 301:
3 Basic Program Components Comma-Se
- Page 302 and 303:
3 Basic Program Components 40 Thisi
- Page 304 and 305:
3 Basic Program Components ans = 10
- Page 306 and 307:
3 Basic Program Components X = -pi:
- Page 308 and 309:
3 Basic Program Components Program
- Page 310 and 311:
3 Basic Program Components if A S1
- Page 312 and 313:
3 Basic Program Components end disp
- Page 314 and 315:
3 Basic Program Components while St
- Page 316 and 317:
3 Basic Program Components Program
- Page 318 and 319:
3 Basic Program Components Asterisk
- Page 320 and 321:
3 Basic Program Components Numeric
- Page 322 and 323:
3 Basic Program Components Cell Arr
- Page 324 and 325:
3 Basic Program Components Dynamic
- Page 326 and 327:
3 Basic Program Components The purp
- Page 328 and 329:
3 Basic Program Components Function
- Page 330 and 331:
3 Basic Program Components MATLAB F
- Page 332 and 333:
3 Basic Program Components Forcing
- Page 334 and 335:
4 M-File Programming Function Argum
- Page 336 and 337:
4 M-File Programming Saving the Pro
- Page 338 and 339:
4 M-File Programming Improving Perf
- Page 340 and 341:
4 M-File Programming Working with M
- Page 342 and 343:
4 M-File Programming Function Defin
- Page 344 and 345:
4 M-File Programming This is the fi
- Page 346 and 347:
4 M-File Programming The process lo
- Page 348 and 349:
4 M-File Programming Providing Help
- Page 350 and 351:
4 M-File Programming M-File Scripts
- Page 352 and 353:
4 M-File Programming Simple Functio
- Page 354 and 355:
4 M-File Programming 3 Type inmem t
- Page 356 and 357:
4 M-File Programming sqr = @(x) x.^
- Page 358 and 359:
4 M-File Programming Call plotFhand
- Page 360 and 361:
4 M-File Programming This false res
- Page 362 and 363:
4 M-File Programming Create two equ
- Page 364 and 365:
4 M-File Programming • Overloadin
- Page 366 and 367:
4 M-File Programming Here is a more
- Page 368 and 369:
4 M-File Programming axis([xmin fix
- Page 370 and 371:
4 M-File Programming This section c
- Page 372 and 373:
4 M-File Programming addOptional(na
- Page 374 and 375:
4 M-File Programming % Display the
- Page 376 and 377:
4 M-File Programming Arguments That
- Page 378 and 379:
4 M-File Programming Enabling Case-
- Page 380 and 381:
4 M-File Programming Property Funct
- Page 382 and 383:
4 M-File Programming Using nargin a
- Page 384 and 385:
4 M-File Programming 4-52
- Page 386 and 387:
4 M-File Programming Determining Wh
- Page 388 and 389:
4 M-File Programming 7 Function els
- Page 390 and 391:
4 M-File Programming While the comm
- Page 392 and 393:
4 M-File Programming strcmp str1 st
- Page 394 and 395:
4 M-File Programming On the other h
- Page 396 and 397:
4 M-File Programming City Temp. Hea
- Page 398 and 399:
4 M-File Programming function [vout
- Page 400 and 401:
4 M-File Programming Running Extern
- Page 402 and 403:
5 Types of Functions Overview of MA
- Page 404 and 405:
5 Types of Functions Note Function
- Page 406 and 407:
5 Types of Functions Arrays of Anon
- Page 408 and 409:
5 Types of Functions Display the da
- Page 410 and 411:
5 Types of Functions If you change
- Page 412 and 413:
5 Types of Functions • “Example
- Page 414 and 415:
5 Types of Functions Supply the val
- Page 416 and 417:
5 Types of Functions Nested Functio
- Page 418 and 419:
5 Types of Functions • From a fun
- Page 420 and 421:
5 Types of Functions not shared bet
- Page 422 and 423:
5 Types of Functions You can now us
- Page 424 and 425:
5 Types of Functions Using a Subfun
- Page 426 and 427:
5 Types of Functions count = 125 22
- Page 428 and 429:
5 Types of Functions shape. The mak
- Page 430 and 431:
5 Types of Functions % FILTFCN. Eac
- Page 432 and 433:
5 Types of Functions 0.6667 filt2(1
- Page 434 and 435:
5 Types of Functions unless you dec
- Page 436 and 437:
5 Types of Functions Accessing Help
- Page 438 and 439:
5 Types of Functions 5-38
- Page 440 and 441:
6 Data Import and Export Working wi
- Page 442 and 443:
6 Data Import and Export • “Dat
- Page 444 and 445:
6 Data Import and Export file that
- Page 446 and 447:
6 Data Import and Export Function r
- Page 448 and 449:
6 Data Import and Export Importing
- Page 450 and 451:
6 Data Import and Export • rowhea
- Page 452 and 453:
6 Data Import and Export File to im
- Page 454 and 455:
6 Data Import and Export Example of
- Page 456 and 457:
6 Data Import and Export was select
- Page 458 and 459:
6 Data Import and Export Import fro
- Page 460 and 461:
6 Data Import and Export File Forma
- Page 462 and 463:
6 Data Import and Export or save ju
- Page 464 and 465:
6 Data Import and Export Data Compr
- Page 466 and 467:
6 Data Import and Export Preference
- Page 468 and 469:
6 Data Import and Export Saving fro
- Page 470 and 471:
6 Data Import and Export Loading Bi
- Page 472 and 473:
6 Data Import and Export Accessing
- Page 474 and 475:
6 Data Import and Export Sharing Me
- Page 476 and 477:
6 Data Import and Export • For sm
- Page 478 and 479:
6 Data Import and Export Note Prope
- Page 480 and 481:
6 Data Import and Export Writable:
- Page 482 and 483:
6 Data Import and Export Ifthefilet
- Page 484 and 485:
6 Data Import and Export For exampl
- Page 486 and 487:
6 Data Import and Export m = memmap
- Page 488 and 489:
6 Data Import and Export Mapping of
- Page 490 and 491:
6 Data Import and Export Repeating
- Page 492 and 493:
6 Data Import and Export Note To su
- Page 494 and 495:
6 Data Import and Export d = m.Data
- Page 496 and 497:
6 Data Import and Export ans = 166x
- Page 498 and 499:
6 Data Import and Export If you hav
- Page 500 and 501:
6 Data Import and Export m.Data(60)
- Page 502 and 503:
6 Data Import and Export m = memmap
- Page 504 and 505:
6 Data Import and Export d = m.Data
- Page 506 and 507:
6 Data Import and Export Data: 1658
- Page 508 and 509:
6 Data Import and Export One MATLAB
- Page 510 and 511:
6 Data Import and Export disp('ANSW
- Page 512 and 513:
6 Data Import and Export Terminatin
- Page 514 and 515:
6 Data Import and Export character.
- Page 516 and 517:
6 Data Import and Export Table6-2 A
- Page 518 and 519:
6 Data Import and Export A = dlmrea
- Page 520 and 521:
6 Data Import and Export number of
- Page 522 and 523:
6 Data Import and Export Exporting
- Page 524 and 525:
6 Data Import and Export A = [ 1 2
- Page 526 and 527:
6 Data Import and Export diary off
- Page 528 and 529:
6 Data Import and Export Importing
- Page 530 and 531:
6 Data Import and Export Working wi
- Page 532 and 533:
6 Data Import and Export Exporting
- Page 534 and 535:
6 Data Import and Export 3 Close th
- Page 536 and 537:
6 Data Import and Export type = Mic
- Page 538 and 539:
6 Data Import and Export ndata = xl
- Page 540 and 541:
6 Data Import and Export 41 42 43 4
- Page 542 and 543:
6 Data Import and Export Note While
- Page 544 and 545:
6 Data Import and Export Use these
- Page 546 and 547:
6 Data Import and Export Writing Bi
- Page 548 and 549:
6 Data Import and Export The act of
- Page 550 and 551:
6 Data Import and Export Conversion
- Page 552 and 553:
6 Data Import and Export • Two sp
- Page 554 and 555:
6 Data Import and Export Exchanging
- Page 556 and 557:
6 Data Import and Export urlread('h
- Page 558 and 559:
6 Data Import and Export Once you h
- Page 560 and 561:
6 Data Import and Export For exampl
- Page 562 and 563:
6 Data Import and Export 6-124
- Page 564 and 565:
7 Working with Scientific Data Form
- Page 566 and 567:
7 Working with Scientific Data Form
- Page 568 and 569:
7 Working with Scientific Data Form
- Page 570 and 571:
7 Working with Scientific Data Form
- Page 572 and 573:
7 Working with Scientific Data Form
- Page 574 and 575:
7 Working with Scientific Data Form
- Page 576 and 577:
7 Working with Scientific Data Form
- Page 578 and 579:
7 Working with Scientific Data Form
- Page 580 and 581:
7 Working with Scientific Data Form
- Page 582 and 583:
7 Working with Scientific Data Form
- Page 584 and 585:
7 Working with Scientific Data Form
- Page 586 and 587:
7 Working with Scientific Data Form
- Page 588 and 589:
7 Working with Scientific Data Form
- Page 590 and 591:
7 Working with Scientific Data Form
- Page 592 and 593:
7 Working with Scientific Data Form
- Page 594 and 595:
7 Working with Scientific Data Form
- Page 596 and 597:
7 Working with Scientific Data Form
- Page 598 and 599:
7 Working with Scientific Data Form
- Page 600 and 601:
7 Working with Scientific Data Form
- Page 602 and 603:
7 Working with Scientific Data Form
- Page 604 and 605:
7 Working with Scientific Data Form
- Page 606 and 607:
7 Working with Scientific Data Form
- Page 608 and 609:
7 Working with Scientific Data Form
- Page 610 and 611:
7 Working with Scientific Data Form
- Page 612 and 613:
7 Working with Scientific Data Form
- Page 614 and 615:
7 Working with Scientific Data Form
- Page 616 and 617:
7 Working with Scientific Data Form
- Page 618 and 619:
7 Working with Scientific Data Form
- Page 620 and 621:
7 Working with Scientific Data Form
- Page 622 and 623:
7 Working with Scientific Data Form
- Page 624 and 625:
7 Working with Scientific Data Form
- Page 626 and 627:
7 Working with Scientific Data Form
- Page 628 and 629:
7 Working with Scientific Data Form
- Page 630 and 631:
7 Working with Scientific Data Form
- Page 632 and 633:
7 Working with Scientific Data Form
- Page 634 and 635:
7 Working with Scientific Data Form
- Page 636 and 637:
8 Error Handling Checking for Error
- Page 638 and 639:
8 Error Handling Handling and Recov
- Page 640 and 641:
8 Error Handling X = A * B catch di
- Page 642 and 643:
8 Error Handling matrixMultiply(A,
- Page 644 and 645:
8 Error Handling Message Identifier
- Page 646 and 647:
8 Error Handling error('msg_id', 'e
- Page 648 and 649:
8 Error Handling Warnings Like erro
- Page 650 and 651:
8 Error Handling Warning Control Th
- Page 652 and 653:
8 Error Handling warnings by issuin
- Page 654 and 655:
8 Error Handling You must type the
- Page 656 and 657:
8 Error Handling s(2) ans = identif
- Page 658 and 659:
8 Error Handling end function f2(x)
- Page 660 and 661:
8 Error Handling Debugging Errors a
- Page 662 and 663:
9 Classes and Objects Classes and O
- Page 664 and 665:
9 Classes and Objects The diagram s
- Page 666 and 667:
9 Classes and Objects functions do
- Page 668 and 669:
9 Classes and Objects visible only
- Page 670 and 671: 9 Classes and Objects Class Method
- Page 672 and 673: 9 Classes and Objects Examples of C
- Page 674 and 675: 9 Classes and Objects not support p
- Page 676 and 677: 9 Classes and Objects overloaded me
- Page 678 and 679: 9 Classes and Objects A(1,2).name(3
- Page 680 and 681: 9 Classes and Objects Object Indexi
- Page 682 and 683: 9 Classes and Objects Converter Met
- Page 684 and 685: 9 Classes and Objects Operation M-F
- Page 686 and 687: 9 Classes and Objects Example — A
- Page 688 and 689: 9 Classes and Objects to the .c fie
- Page 690 and 691: 9 Classes and Objects end if d >= 2
- Page 692 and 693: 9 Classes and Objects % SUBSREF swi
- Page 694 and 695: 9 Classes and Objects q = polynom(q
- Page 696 and 697: 9 Classes and Objects % POLYNOM/DIF
- Page 698 and 699: 9 Classes and Objects Building on O
- Page 700 and 701: 9 Classes and Objects Multiple Inhe
- Page 702 and 703: 9 Classes and Objects Inheritance M
- Page 704 and 705: 9 Classes and Objects a.currentValu
- Page 706 and 707: 9 Classes and Objects error('Asset
- Page 708 and 709: 9 Classes and Objects case 'date' a
- Page 710 and 711: 9 Classes and Objects Note that the
- Page 712 and 713: 9 Classes and Objects For example,
- Page 714 and 715: 9 Classes and Objects The Stock sub
- Page 716 and 717: 9 Classes and Objects case '.' swit
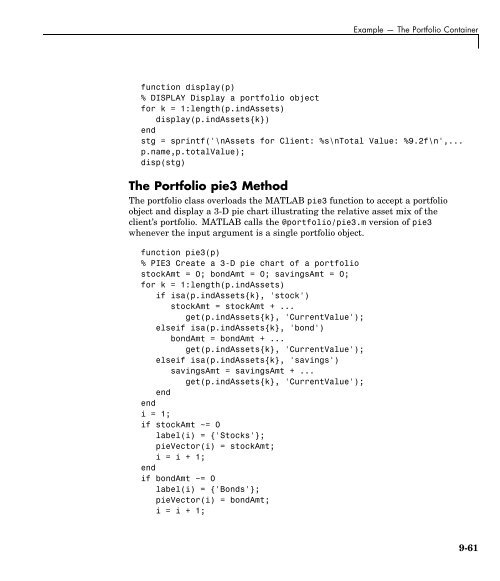
- Page 718 and 719: 9 Classes and Objects Example — T
- Page 722 and 723: 9 Classes and Objects end if saving
- Page 724 and 725: 9 Classes and Objects Saving and Lo
- Page 726 and 727: 9 Classes and Objects • subsref
- Page 728 and 729: 9 Classes and Objects function n =
- Page 730 and 731: 9 Classes and Objects Object Preced
- Page 732 and 733: 9 Classes and Objects How MATLAB De
- Page 734 and 735: 9 Classes and Objects Private funct
- Page 736 and 737: 9 Classes and Objects 9-76
- Page 738 and 739: 10 Scheduling Program Execution wit
- Page 740 and 741: 10 Scheduling Program Execution wit
- Page 742 and 743: 10 Scheduling Program Execution wit
- Page 744 and 745: 10 Scheduling Program Execution wit
- Page 746 and 747: 10 Scheduling Program Execution wit
- Page 748 and 749: 10 Scheduling Program Execution wit
- Page 750 and 751: 10 Scheduling Program Execution wit
- Page 752 and 753: 10 Scheduling Program Execution wit
- Page 754 and 755: 10 Scheduling Program Execution wit
- Page 756 and 757: 10 Scheduling Program Execution wit
- Page 758 and 759: 10 Scheduling Program Execution wit
- Page 760 and 761: 10 Scheduling Program Execution wit
- Page 762 and 763: 11 Improving Performance and Memory
- Page 764 and 765: 11 Improving Performance and Memory
- Page 766 and 767: 11 Improving Performance and Memory
- Page 768 and 769: 11 Improving Performance and Memory
- Page 770 and 771:
11 Improving Performance and Memory
- Page 772 and 773:
11 Improving Performance and Memory
- Page 774 and 775:
11 Improving Performance and Memory
- Page 776 and 777:
11 Improving Performance and Memory
- Page 778 and 779:
11 Improving Performance and Memory
- Page 780 and 781:
11 Improving Performance and Memory
- Page 782 and 783:
11 Improving Performance and Memory
- Page 784 and 785:
11 Improving Performance and Memory
- Page 786 and 787:
12 Programming Tips MATLAB Path (p.
- Page 788 and 789:
12 Programming Tips numberOfLines)
- Page 790 and 791:
12 Programming Tips Help This secti
- Page 792 and 793:
12 Programming Tips Topic Name arit
- Page 794 and 795:
12 Programming Tips Youcangethelpon
- Page 796 and 797:
12 Programming Tips Commenting Out
- Page 798 and 799:
12 Programming Tips For M-file func
- Page 800 and 801:
12 Programming Tips Function Argume
- Page 802 and 803:
12 Programming Tips Passing Argumen
- Page 804 and 805:
12 Programming Tips For more inform
- Page 806 and 807:
12 Programming Tips Debugging This
- Page 808 and 809:
12 Programming Tips Setting Breakpo
- Page 810 and 811:
12 Programming Tips Variables This
- Page 812 and 813:
12 Programming Tips AvoidUsingiandj
- Page 814 and 815:
12 Programming Tips Strings This se
- Page 816 and 817:
12 Programming Tips Function regexp
- Page 818 and 819:
12 Programming Tips are useful when
- Page 820 and 821:
12 Programming Tips File Precedence
- Page 822 and 823:
12 Programming Tips Making Nontoolb
- Page 824 and 825:
12 Programming Tips Using switch Ve
- Page 826 and 827:
12 Programming Tips try X = A * B c
- Page 828 and 829:
12 Programming Tips • Load spread
- Page 830 and 831:
12 Programming Tips Files and Filen
- Page 832 and 833:
12 Programming Tips -- METHOD #1 --
- Page 834 and 835:
12 Programming Tips Readable File F
- Page 836 and 837:
12 Programming Tips Starting MATLAB
- Page 838 and 839:
12 Programming Tips Finding the MAT
- Page 840 and 841:
12 Programming Tips For More Inform
- Page 842 and 843:
A External Interfaces A-2
- Page 844 and 845:
Index arithmetic operators 3-17 ove
- Page 846 and 847:
Index debugging 9-6 designing 9-9 j
- Page 848 and 849:
Index string, vector of input 2-70
- Page 850 and 851:
Index internet 6-116 downloading fr
- Page 852 and 853:
Index overloaded 5-37 function work
- Page 854 and 855:
Index I if and empty arrays 3-89 ex
- Page 856 and 857:
Index scalar 1-47 See also matrices
- Page 858 and 859:
Index inheritance multiple 9-40 sim
- Page 860 and 861:
Index reading HDF4 data 7-52 from t
- Page 862 and 863:
Index rotating matrices 1-34 S save
- Page 864 and 865:
Index T semicolon ; 3-106 single qu