Magnetic Characterization of Fischer-Tropsch Catalysts
Magnetic Characterization of Fischer-Tropsch Catalysts
Magnetic Characterization of Fischer-Tropsch Catalysts

You also want an ePaper? Increase the reach of your titles
YUMPU automatically turns print PDFs into web optimized ePapers that Google loves.
Oil & Gas Science and Technology – Rev. IFP, Vol. 64 (2009), No. 1, pp. 25-48<br />
Copyright © 2009, Institut français du pétrole<br />
DOI: 10.2516/ogst/2008050<br />
<strong>Magnetic</strong> <strong>Characterization</strong><br />
<strong>of</strong> <strong>Fischer</strong>-<strong>Tropsch</strong> <strong>Catalysts</strong><br />
P.A. Chernavskii 1 , J.-A. Dalmon 2 , N.S. Perov 3 and A.Y. Khodakov 4*<br />
1 Department <strong>of</strong> Chemistry, Moscow State University, 119992 Moscow - Russia<br />
2 Institut de Recherches sur la Catalyse et l’Environnement de Lyon, UMR 5256 CNRS, 2 avenue Albert Einstein,<br />
69626 Villeurbanne Cedex - France<br />
3 Department <strong>of</strong> Physics, Moscow State University, 119992 Moscow - Russia<br />
4 Unité de Catalyse et de Chimie du Solide, UMR 8181 CNRS, Bât. C3, USTL-ENSCL-EC Lille, Cite Scientifique,<br />
59655 Villeneuve d’Ascq - France<br />
e-mail: chern@kge.msu.ru - jean-alain.dalmon@ircelyon.univ-lyon1.fr - perov@magn.ru - andrei.khodakov@univ-lille1.fr<br />
* Corresponding author<br />
Dossier<br />
The <strong>Fischer</strong>-<strong>Tropsch</strong> Process<br />
Le procédé <strong>Fischer</strong>-<strong>Tropsch</strong><br />
Résumé — La caractérisation par la méthode magnétique des catalyseurs <strong>Fischer</strong>-<strong>Tropsch</strong> —<br />
Cet article passe en revue les développements récents dans le domaine de la caractérisation des<br />
catalyseurs <strong>Fischer</strong>-<strong>Tropsch</strong> à base de cobalt, de fer et de nickel par la méthode magnétique. La<br />
caractérisation magnétique fournit des informations précieuses sur la réduction du catalyseur, la taille des<br />
nanoparticules ferromagnétiques, la chimisorption, ainsi que sur les réactions topochimiques qui se<br />
produisent avec les catalyseurs au cours de la genèse de la phase active et dans des conditions<br />
réactionnelles. Les possibilités et les limites de la méthode magnétique sont examinées.<br />
Abstract — <strong>Magnetic</strong> <strong>Characterization</strong> <strong>of</strong> <strong>Fischer</strong>-<strong>Tropsch</strong> <strong>Catalysts</strong> — This paper reviews recent<br />
developments in the application <strong>of</strong> magnetic methods for investigation <strong>of</strong> <strong>Fischer</strong>-<strong>Tropsch</strong> catalysts<br />
involving cobalt, iron and nickel. <strong>Magnetic</strong> characterization provides valuable information about<br />
catalyst reduction, sizes <strong>of</strong> ferromagnetic nanoparticles, chemisorption on ferromagnetics and<br />
topochemical reactions which occur with the catalysts during the genesis <strong>of</strong> the active phase and in the<br />
conditions <strong>of</strong> <strong>Fischer</strong>-<strong>Tropsch</strong> synthesis. The capabilities and challenges <strong>of</strong> the magnetic methods are<br />
discussed.
26<br />
INTRODUCTION<br />
The increasing interest in <strong>Fischer</strong>-<strong>Tropsch</strong> synthesis has been<br />
instigated by the growing demand for clean fuels and utilization<br />
<strong>of</strong> abundant natural gas, coal and biomass-derivated synthesis<br />
gas [1-3]. The sub-ferrous metals (cobalt, iron and<br />
nickel) are the most active catalysts for carbon monoxide<br />
hydrogenation. Both cobalt and iron have been used at the<br />
industrial scale as catalysts for <strong>Fischer</strong>-<strong>Tropsch</strong> synthesis<br />
(South Africa, Malaysia, Qatar, etc.). Consequently, a growing<br />
number <strong>of</strong> works have focused on investigation <strong>of</strong> the<br />
structure <strong>of</strong> these catalysts. Much <strong>of</strong> this interest is due to<br />
industrial requirements, such as optimization <strong>of</strong> catalyst<br />
activity, selectivity and stability.<br />
The challenges in the investigation <strong>of</strong> these catalysts are<br />
usually due to the relatively high reactivity <strong>of</strong> small metal<br />
and oxide particles. First, chemical interaction <strong>of</strong> metals and<br />
oxides with a catalytic support (Al 2 O 3 , SiO 2 , TiO 2 , etc.) has<br />
to be taken into consideration [4]. Secondly, it is known that<br />
small metal particles can easily interrelate with the reacting<br />
medium; thus, they can be involved in a wide range <strong>of</strong><br />
topochemical processes on the catalyst surface. According to<br />
IUPAC, a topochemical reaction [5] is a reversible or irreversible<br />
reaction that involves the introduction <strong>of</strong> a guest<br />
species into a host structure and that results in significant<br />
structural modifications to the host; for example, the breakage<br />
<strong>of</strong> bonds. For metal catalysts in the conditions <strong>of</strong> <strong>Fischer</strong>-<br />
<strong>Tropsch</strong> synthesis, the topochemical reactions can include<br />
oxidation <strong>of</strong> metal particles by trace amounts <strong>of</strong> oxygen and<br />
water, carburization, sintering, formation <strong>of</strong> nitrides and sulfides,<br />
etc. It is clear that development <strong>of</strong> efficient catalytic<br />
processes would require more complete information about<br />
the topochemical reactions involving small oxide and metal<br />
particles which proceed during catalyst preparation and catalytic<br />
reaction. These reactions can <strong>of</strong>ten alter the catalytic<br />
performance.<br />
Unfortunately, most <strong>of</strong> the conventional characterization<br />
techniques do not always provide comprehensive data on<br />
topochemical processes which involve nanoparticles. In particular,<br />
extracting in situ and operando information about<br />
evolution <strong>of</strong> the catalyst structure during different pretreatments<br />
and the <strong>Fischer</strong>-<strong>Tropsch</strong> reaction represents significant<br />
difficulties. Measurements <strong>of</strong> particle size or metal dispersion<br />
in metal catalysts seem to be another challenge to overcome.<br />
Comparative analysis <strong>of</strong> different characterization methods<br />
<strong>of</strong> cobalt-supported <strong>Fischer</strong>-<strong>Tropsch</strong> catalysts was conducted<br />
in our recent publication [1].<br />
Application <strong>of</strong> magnetic methods has proven to provide<br />
very efficient solutions to the many problems associated with<br />
metal-supported catalysts involving ferromagnetic metals<br />
such as Fe, Co and Ni [6-8]. This present work addresses<br />
recent developments in magnetic characterization <strong>of</strong> metallic<br />
<strong>Fischer</strong>-<strong>Tropsch</strong> catalysts. Attention will be primarily<br />
focused on measurements <strong>of</strong> magnetization <strong>of</strong> ferromagnetic<br />
Oil & Gas Science and Technology – Rev. IFP, Vol. 64 (2009), No. 1<br />
phases. The magnetic resonance techniques, such as nuclear<br />
magnetic resonance, electron spin resonance or ferromagnetic<br />
resonance are beyond the scope <strong>of</strong> the present review.<br />
1 NON-RESONANCE MAGNETIC METHODS<br />
OF CATALYST CHARACTERIZATION<br />
The conventional methods <strong>of</strong> studying magnetic properties <strong>of</strong><br />
solids and liquids can be divided into two groups: static<br />
methods and dynamic methods. Both these methods can be<br />
applied to heterogeneous catalysts. Note, however, that specificity<br />
<strong>of</strong> catalytic materials introduces some specific requirements<br />
for both experimental conditions and magnetometric<br />
equipment. Thus, for evaluation <strong>of</strong> catalyst structure the magnetic<br />
measurements should be possibly conducted in situ in a<br />
controlled environment and at a wider range <strong>of</strong> temperatures<br />
(from the temperature <strong>of</strong> liquid helium to 1000 K). In addition,<br />
because <strong>of</strong> the presence <strong>of</strong> small superparamagnetic particles<br />
in the catalysts, the magnetic field should have high<br />
strength (up to 100 kOe or 8.96 × 10⁷ A/m). Therefore, it<br />
appears that all-purpose magnetometers are not very convenient<br />
and have to be modified for investigation <strong>of</strong> the structure<br />
<strong>of</strong> heterogeneous catalysts. Below is a brief description<br />
<strong>of</strong> the most common static and dynamic methods for measuring<br />
catalyst magnetization.<br />
The static methods are usually based on the Faraday<br />
equation. In the static method, a sample is placed in the area<br />
<strong>of</strong> constant gradient <strong>of</strong> the magnetic field. The gradient <strong>of</strong> the<br />
magnetic field is calibrated using a sample with known magnetization.<br />
The force applied to the sample is measured<br />
according to the equation:<br />
⎛ dH<br />
⎞<br />
F = χ ⋅V<br />
⋅ H ⋅⎜<br />
⎟<br />
(1)<br />
⎝ dx ⎠<br />
where χ is the magnetic susceptibility, V is the sample<br />
volume, H is the magnetic field strength, dH/dx is the gradient<br />
<strong>of</strong> the magnetic field along the x axis; the x axis can be vertical<br />
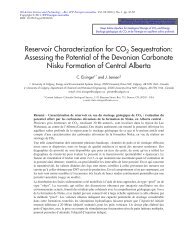
(rocker balance) and horizontal (pendulum balance). The<br />
schema <strong>of</strong> the Faraday rocker balance is presented in<br />
Figure 1. Typically, the space between the magnetic poles is<br />
very small, because it is undesirable that the sample be subjected<br />
to magnetic fields <strong>of</strong> very different strengths.<br />
The Faraday method has several limitations. First, the<br />
Faraday method is inconvenient for measuring the dependence<br />
<strong>of</strong> magnetization on the magnetic field. While the<br />
magnetic field is changing between the poles, its gradient is<br />
changing as well. This makes it difficult to calibrate the<br />
sensitivity <strong>of</strong> the installation. Secondly, it is known that for<br />
all substances, the magnetic moment is a function <strong>of</strong> the<br />
field strength. In the Faraday method it is essential that the<br />
sample has to be placed in an inhomogeneous field. The<br />
magnetic moment is a function <strong>of</strong> the sample size. For<br />
ferro- and ferrimagnetics, the variation in magnetic moment
N<br />
S<br />
Sample<br />
Figure 1<br />
Schema <strong>of</strong> Faraday rocker balance.<br />
PA Chernavskii et al. / <strong>Magnetic</strong> <strong>Characterization</strong> <strong>of</strong> <strong>Fischer</strong>-<strong>Tropsch</strong> <strong>Catalysts</strong> 27<br />
with magnetic field can be significant and therefore it can<br />
affect the quality <strong>of</strong> experimental data. Thirdly, typically a<br />
large volume <strong>of</strong> the Faraday balance makes it difficult to<br />
study evolution <strong>of</strong> catalyst structure and sample magnetization<br />
during the pretreatments and catalytic reactions, in particular<br />
in transient conditions.<br />
The dynamic methods involve measurements <strong>of</strong> the<br />
voltage which arises in the coils placed next to the sample<br />
during its displacement in the magnetic field (due to the<br />
variation in magnetic flux in the coils). This voltage is proportional<br />
to the magnetic moment <strong>of</strong> the sample. The<br />
Weiss and Foner methods are two different variants <strong>of</strong> the<br />
dynamic magnetic method. Of these two methods the<br />
Weiss extraction method [9] has been most widely used. In<br />
the Weiss method the sample is placed in a uniform field<br />
between the magnet poles (Fig. 2). The Helmholtz induction<br />
coil is located next to the sample. This coil is connected<br />
to the measuring equipment. During the measurements<br />
the sample is sharply displaced in the uniform<br />
magnetic field. The magnetization is evaluated from the<br />
voltage which occurs in the coil during the sample displacement.<br />
In the state-<strong>of</strong>-the-art Weiss magnetometers,<br />
the accuracy <strong>of</strong> measurements has been improved by averaging<br />
the results produced by a series <strong>of</strong> identical sample<br />
displacements.<br />
In the Foner method (also called a vibrating sample<br />
method [10]), the sample vibrates in the magnetic field with<br />
the sound frequency. The simplified schema <strong>of</strong> a Foner magnetometer<br />
is shown in Figure 3. The voltage arising in the<br />
pick-up coils is proportional to the magnetic moment <strong>of</strong> the<br />
Induction<br />
coil<br />
Pneumatic jack<br />
Electromagnet<br />
Sample<br />
Stabilized<br />
power supply<br />
Multimeter<br />
Computer<br />
Figure 2<br />
Schematic drawing <strong>of</strong> Weiss extraction magnetometer. The<br />
sample magnetization is obtained from the current induced in<br />
the coil during the extraction <strong>of</strong> the sample.<br />
Figure 3<br />
4<br />
3<br />
N S<br />
6<br />
7<br />
sample. Both the Weiss and Foner methods have the same<br />
physical background; the Foner method differs from the<br />
Weiss method only in data processing. Because <strong>of</strong> the possible<br />
generation <strong>of</strong> Foucault currents during the sample vibration,<br />
the Foner method is not well suited for studying conducting<br />
materials. In metal-supported catalysts the Foucault<br />
currents are not usually produced because the metal particles<br />
are electrically isolated from each other. The Foner method<br />
has great potential for studies <strong>of</strong> catalysts containing ferri- or<br />
ferromagnetic phases [11]. Despite several obvious advantages,<br />
the Foner method has not been widely disseminated.<br />
1<br />
2<br />
Simplified schema <strong>of</strong> Foner magnetometer: (1) sound<br />
generator, (2) horn, (3) reference coil, (4) reference sample <strong>of</strong><br />
constant magnetization, (5) non-magnetic bar, (6) sample, (7)<br />
pick-up coil.<br />
3<br />
5
28<br />
2 PROBLEM OF SMALL PARTICLES: SINGLE-DOMAIN<br />
PARTICLES AND SUPERPARAMAGNETICS<br />
The domain structure <strong>of</strong> bulk ferromagnetics corresponds to<br />
the minimum <strong>of</strong> its total energy [12]. The total energy <strong>of</strong><br />
ferromagnetics constitutes:<br />
– the electron exchange energy, which is minimal when all<br />
electron spins are parallel,<br />
– the energy <strong>of</strong> crystalline anisotropy due to the existence <strong>of</strong><br />
crystal axes <strong>of</strong> “easy” and “difficult” magnetization<br />
(because <strong>of</strong> dipole-dipole interaction <strong>of</strong> magnetic<br />
moments <strong>of</strong> individual atoms),<br />
– the magnetostatic energy related to the presence <strong>of</strong> magnetic<br />
poles inside and on the surface <strong>of</strong> the sample<br />
– the magnetostriction energy caused by changes in the<br />
domain size due to the changes in magnetization and its<br />
orientation.<br />
The presence <strong>of</strong> magnetic domains usually reduces the number<br />
<strong>of</strong> poles in the sample and related magnetostatic energy.<br />
The domains are areas <strong>of</strong> ferromagnetics spontaneously magnetized<br />
to saturation. The domains are mostly located along<br />
the axes <strong>of</strong> “easy” magnetization.<br />
Bulk ferromagnetics consists <strong>of</strong> a large number <strong>of</strong><br />
domains. The situation is different with smaller particles <strong>of</strong><br />
ferromagnetics. Frenkel and Dorfman [13] first predicted that<br />
small particles <strong>of</strong> ferromagnetics might have a single-domain<br />
structure. When the particle diameter decreases, the magnetostatic<br />
energy which is proportional to the volume decreases<br />
faster than the energy <strong>of</strong> the boundaries between domains<br />
which is proportional to the surface. At some particle size,<br />
the single-domain ferromagnetic structure becomes favored<br />
over the multidomain one. Kondorskii developed a rigorous<br />
theory <strong>of</strong> single-domain particles [14, 15]. In this theory an<br />
upper limiting or critical radius, Rc , <strong>of</strong> the area which has<br />
uniform magnetization is defined as:<br />
−1/<br />
2<br />
0.<br />
95<br />
1/<br />
2 ⎛ 2K<br />
H ⎞<br />
R<br />
(2)<br />
c ≈ ( 10 ⋅ A)<br />
⋅⎜<br />
Q − − 2 ⎟<br />
I s<br />
⎝ I s I s ⎠<br />
where Is is the saturation magnetization, A is the parameter <strong>of</strong><br />
exchange energy, K is the anisotropy constant, Q is the factor<br />
<strong>of</strong> demagnetization and H is the field strength. Note that the<br />
particles which radius satisfies Equation (2) have a single-<br />
2K<br />
domain structure for the values <strong>of</strong> the field H > − . The<br />
I s<br />
condition <strong>of</strong> the absolute single domain (in all magnetic<br />
fileds) is:<br />
(3)<br />
where c = 1/2; 1; 2 for, respectively, simple cube, volumecentered<br />
and face-centered cubic lattices; B = z2 12 /<br />
095 . ⎛10⋅c⋅B⎞<br />
R < Rc≈<br />
⋅⎜<br />
⎟<br />
Is<br />
⎝ a0⋅QR ⎠<br />
A is the parameter<br />
<strong>of</strong> exchange energy; z is the number <strong>of</strong> uncompensated<br />
spins per atom, A is the exchange integral, a0 is the crystal<br />
lattice parameter, and QR is the demagnetization factor <strong>of</strong> the<br />
Oil & Gas Science and Technology – Rev. IFP, Vol. 64 (2009), No. 1<br />
single-domain ellipsoid along the short axis. Equation (3)<br />
yields the upper estimation <strong>of</strong> the critical radius <strong>of</strong> singledomain<br />
particles. The evaluation <strong>of</strong> the single-domain critical<br />
size has been discussed in a number <strong>of</strong> reviews [16, 17]. The<br />
critical diameter <strong>of</strong> spherical single-domain ferromagnetic<br />
particles is 20 nm for cobalt [12, 18], 14 nm for iron, 55 nm<br />
for nickel, 128 nm for Fe3O4 and 166 nm for γ-Fe2O3 [19].<br />
As the ferromagnetic particles approach the single-domain<br />
state, the synchronic (coherent) rotation <strong>of</strong> individual atomic<br />
magnetic moments becomes the predominant mechanism <strong>of</strong><br />
remagnetization. This process is hindered by crystalline<br />
anisotropy and shape anisotropy. In order to remagnetize the<br />
single-domain spherical particle through coherent rotation, it<br />
is necessary to apply the opposite magnetic field:<br />
H (4)<br />
c,max = 2Ke<br />
/ Is<br />
where Hc, max is the maximum coercive force, Is is the saturation<br />
magnetization and Ke is the full anisotropy constant.<br />
Several experimental studies <strong>of</strong> the relations between coercive<br />
force and particle size [18, 20-21] have been conducted<br />
in the literature. This relation can be qualitatively illustrated<br />
by Figure 4.<br />
As the particle radius decreases, the inter-domain<br />
boundaries become energetically unfavorable and the particle<br />
turns into a single-domain one. Typically, a single-domain<br />
particle <strong>of</strong> upper critical size has the maximal coercive force.<br />
Increase in particle size leads to multidomain ferromagnetic<br />
structure and to a decrease in coercivity. Finally, when the<br />
particles become very large, the coercivity attains the value<br />
characteristic <strong>of</strong> bulk ferromagnetics.<br />
For single-domain particles, the change in magnetization<br />
can no longer be assigned to the displacement <strong>of</strong> interdomain<br />
boundaries, but it should be attributed to the coherent<br />
H c<br />
Single domain area<br />
Superparamagnetic<br />
area<br />
Figure 4<br />
0<br />
d<br />
Multidomain area<br />
Qualitative relation between the coercive force and particle<br />
size.
otation <strong>of</strong> atomic magnetic moments. Uniform magnetization<br />
is still present in the single-domain particles <strong>of</strong> smaller<br />
size, since the atomic moments are held by the exchange<br />
forces in the parallel direction.<br />
Decrease in particle volume leads to higher probability <strong>of</strong><br />
Brownian motion <strong>of</strong> the total magnetic moment: M = V Is .<br />
Note that the magnetic moment rotation is an activated<br />
process with the activation energy, E. The total magnetization,<br />
I = NMi , <strong>of</strong> the ensemble <strong>of</strong> N particles after switching<br />
<strong>of</strong>f the magnetic field drops to zero because <strong>of</strong> Brownian<br />
motion <strong>of</strong> magnetic moments, Mi , <strong>of</strong> individual particles. The<br />
relevant decrease in magnetization follows the law:<br />
I = Is ·exp(-t/τ) (5)<br />
where t is the time and τ is the relaxation time. Thus, the<br />
small particles behave like an ensemble <strong>of</strong> paramagnetic<br />
atoms which has a large magnetic moment, M. This phenomenon,<br />
called “superparamagnetism”, has been extensively<br />
studied both theoretically [22], and experimentally [23-24].<br />
The theory suggests that the relaxation time, τ, depends on<br />
the energy barrier, E:<br />
τ = τ<br />
PA Chernavskii et al. / <strong>Magnetic</strong> <strong>Characterization</strong> <strong>of</strong> <strong>Fischer</strong>-<strong>Tropsch</strong> <strong>Catalysts</strong> 29<br />
0<br />
⎛ E ⎞<br />
exp⎜ ⎟<br />
⎝ ⎠<br />
kT<br />
B<br />
where the τ 0 parameter is typically between 10 -9 and 10 -10 s.<br />
The energy barrier is E = K V; it depends on the anisotropy<br />
constant and particle volume. Therefore, according to<br />
Equation (6), τ depends on both particle volume and<br />
temperature.<br />
The particles become superparamagnetic when their<br />
diameter is smaller than the critical diameter, D c . In fact,<br />
superparamagnetism is a special case <strong>of</strong> ferromagnetism<br />
where particle magnetic moment, magnetic field and temperature<br />
are in thermodynamic equilibrium. As a result, superparamagnetic<br />
materials do not exhibit a stable residual magnetization.<br />
In order to facilitate things, in the present<br />
manuscript we will call particles whose diameter is larger<br />
than the critical diameter, D c , ferromagnetic particles, and<br />
those with diameter under D c superparamagnetic particles.<br />
The upper critical sizes <strong>of</strong> superparamagnetic particles for<br />
different metals can be easily estimated assuming τ to be<br />
equal to 10 -9 s. For example, for iron particles with a diameter<br />
<strong>of</strong> 30 nm at T = 300 K the relaxation time is τ ≈4 × 10 6 s<br />
but with the iron particles (D = 23.8 nm) with twice as small<br />
a volume the relaxation time τ would be 6 × 10 -2 s. Increase<br />
in temperature also results in decrease in the relaxation time.<br />
Thus, iron particles with a diameter <strong>of</strong> 23.8 nm or less at<br />
room temperature will lose their magnetization and would<br />
reach thermal equilibrium for less than one tenth <strong>of</strong> second,<br />
and consequently they exhibit superparamagnetic properties.<br />
At the same time, the iron particles <strong>of</strong> 30 nm at room temperature<br />
are extremely stable, and will behave like singledomain<br />
ferromagnetics. These 30nm particles, however,<br />
which are ferromagnetic at room temperatures, will transform<br />
into superparamagnetic at T = 600 K.<br />
(6)<br />
Note that all ferromagnetic particles lose their magnetization<br />
with time. Generally speaking, ranking particles into ferromagnetics<br />
and superparamagnetics depends only on the<br />
time <strong>of</strong> observation. Usually, in static measurements τ is suggested<br />
to be equal to 100 s. This evokes that the transition<br />
between the ferromagnetic and superparamagnetic states<br />
occurs when the following condition is fulfilled:<br />
KV =25kBT where K is the anisotropy constant, kb is Boltzmann’s constant,<br />
V is the volume <strong>of</strong> the particles and T is the temperature <strong>of</strong><br />
measurements. If the particle volume is larger than<br />
, the particle is a ferromagnetic and it has a<br />
residual magnetic moment; if the particle volume is smaller<br />
than kT B V < , the particle is a superparamagnetic.<br />
K<br />
In the external magnetic field, H, the particles acquire<br />
additional energy, which could affect the energy barrier, E,<br />
and hence relaxation time. In [25] the expression has been<br />
obtained for the coercive force Hc which would disorientate<br />
magnetic moments, Mi <strong>of</strong> particles <strong>of</strong> V volume for 100 s:<br />
25<br />
kT B V ><br />
K<br />
25<br />
2K<br />
⎡<br />
⎛ k T ⎞<br />
1/<br />
2<br />
B<br />
H c = ⎢1<br />
− 7⎜<br />
(7)<br />
3 ⎟ ⎥<br />
I s ⎢⎣<br />
⎝ KD ⎠ ⎥⎦<br />
At T = 0 K Equation (7) yields Hc = 2K/Is , and at T =<br />
KV/25kB it gets Hc = 0. Equation (7) allows the calculation <strong>of</strong><br />
the critical volume <strong>of</strong> superparamagnetic particles, Vc by<br />
extrapolating coercive force as a function <strong>of</strong> D to the value<br />
Hc = 0. By substituting temperature and Vc, one can calculate<br />
2K/Is . It should be borne in mind, however that according to<br />
recent data, the anisotropy constant, K, also depends on the<br />
particle size [26]. The “core-shell” theory [27] has been proposed<br />
to explain this phenomenon. This theory considers differently<br />
the contributions to the energy barrier, E, coming<br />
from superficial and inner particle atoms. Obviously, the relative<br />
contribution <strong>of</strong> superficial atoms decreases with<br />
increase in particle size, and correspondingly growth in the<br />
ratio <strong>of</strong> the number <strong>of</strong> superficial atoms to the total number<br />
<strong>of</strong> atoms in a particle. It was also [28] suggested that in the<br />
systems which constitute ultra-dispersed particles, the<br />
energy, E, was only a function <strong>of</strong> superficial atoms and did<br />
not much depend on the particle volume.<br />
When anisotropy can be neglected (kBT >> KV), the<br />
orientation <strong>of</strong> the magnetic vector can randomly evolve<br />
under the influence <strong>of</strong> thermal fluctuations. Hence the particle<br />
does not exhibit ferromagnetism. Consequently, the hysteresis<br />
loop turns into a sigma-shaped curve, i.e. both coercive<br />
force and residual magnetization become equal to zero.<br />
In this case, the dependence <strong>of</strong> the magnetization on the magnetic<br />
field can be described by the Langevin formula:<br />
⎛ MH k ⎞ BT<br />
I = I s ⎜cth<br />
− ⎟<br />
⎝ k BT<br />
MH ⎠<br />
⎤<br />
(8)
30<br />
Decomposition <strong>of</strong> the hyperbolic cotangent into a series<br />
assuming that MH >> k B T leads to:<br />
⎛ k ⎞<br />
BT<br />
I ≈ I s ⎜1−<br />
⎟<br />
⎝ MH ⎠<br />
while at MH
Number <strong>of</strong> particles (arb. units)<br />
0.4<br />
0.35<br />
0.3<br />
0.25<br />
0.2<br />
0.15<br />
0.1<br />
0.05<br />
0<br />
10<br />
15<br />
20<br />
PA Chernavskii et al. / <strong>Magnetic</strong> <strong>Characterization</strong> <strong>of</strong> <strong>Fischer</strong>-<strong>Tropsch</strong> <strong>Catalysts</strong> 31<br />
Particle size distributions for sample 1v.<br />
25 30<br />
Radii (A)<br />
35<br />
TEM<br />
<strong>Magnetic</strong><br />
40 45 50<br />
Figure 5<br />
Comparison <strong>of</strong> Co/SiO2 particle size distributions from TEM<br />
and magnetic measurements.<br />
In Equation (17) the summation is conducted over all<br />
measurements at a given point, σ i 2 is dispersion for each<br />
point, and values I i and y i are defined by a system <strong>of</strong><br />
Equations (15). Thus, to solve Equations (15) both the<br />
physical model which involves the Langevin equation and<br />
experimental dependence <strong>of</strong> magnetization on the magnetic<br />
field are required. It is important to note that the<br />
obtained solution would not involve any initial predefined<br />
distribution <strong>of</strong> particle size and any predefined value <strong>of</strong> I s .<br />
The saturation magnetization, I s , can be estimated from<br />
normalization <strong>of</strong> function f. The method <strong>of</strong> maximal<br />
entropy was successfully applied [35] for determination <strong>of</strong><br />
the size distribution function <strong>of</strong> Ni particles in Ag-Ni alloy.<br />
It was also shown [36] that the method can be very efficient,<br />
particularly in the analysis <strong>of</strong> bimodal distribution.<br />
Potton’s method was also used to follow particle size distribution<br />
in silica-supported cobalt catalysts. While the<br />
results obtained by the magnetic method were qualitatively<br />
consistent with TEM data (Fig. 5), electron microscopy<br />
seems to slightly overestimate cobalt particle size [37].<br />
Another technique to measure particle size distribution<br />
was suggested by Weil. This method involves measurements<br />
<strong>of</strong> residual magnetization as a function <strong>of</strong> temperature.<br />
The method is based on the fact that the residual magnetization<br />
at a given temperature should be principally<br />
affected by the particles which are larger than the upper<br />
critical size <strong>of</strong> superparamagnetics. Using this approach,<br />
Weil [23] studied Ni powder and obtained bimodal distribution,<br />
which was attributed to the influence <strong>of</strong> preparation<br />
conditions on the nickel particle size. The Weil method<br />
f v (D) Å -1 , x10 3<br />
10<br />
F v<br />
(D)<br />
5<br />
0<br />
1<br />
3<br />
f v (D) Å -1 , x10 3<br />
10<br />
100<br />
100<br />
D (Å) D (Å)<br />
Figure 6<br />
Volume particle size distributions <strong>of</strong> a Ni/SiO2 sample.<br />
Curves: (1) from the magnetization curve, (2) transmission<br />
electron microscopy, (3) small-angle X-ray scattering, (4)<br />
Weil method (temperature range 300-2.4 K).<br />
10<br />
20<br />
was also used to calculate particle size distribution in<br />
Ni/SiO 2 [38] and Co/SiO 2 [39] catalysts. The volume-base<br />
particle size distributions obtained by the Weil method and<br />
other characterization techniques are shown in Figure 6<br />
[38] and Figure 7 [39].<br />
The methods for measuring particle size distribution,<br />
which are discussed above, suggest that particles behave<br />
5<br />
30<br />
4<br />
2<br />
RM<br />
TEM<br />
40 D (nm)<br />
Figure 7<br />
Volume particle size distribution <strong>of</strong> a Co(37 wt%)/SiO 2 . Weil<br />
(or Remanence Method, RM), top. Transmission Electron<br />
Microscopy (TEM), bottom.
32<br />
independently <strong>of</strong> each other. Meanwhile, the effects <strong>of</strong> interaction<br />
<strong>of</strong> particles in real systems can significantly affect the<br />
apparent magnetic properties. First, the interparticle interaction<br />
is reflected in an inability to combine magnetic curves<br />
measured at different temperatures for superparamagnetic<br />
particles, but expressed via H/T ratios. Let us evaluate the<br />
validity <strong>of</strong> the theories discussed above in the context <strong>of</strong> particle-particle<br />
interaction.<br />
The energy <strong>of</strong> dipole-dipole interaction between particles<br />
with a magnetic moment, M, could be estimated using the<br />
expression [40]: Eint = M/R3 where R is the distance between<br />
the particles. For a system <strong>of</strong> superparamagnetic particles<br />
with a diameter D = 10 nm and situated at a distance <strong>of</strong> 2D<br />
from each other, from equation Eint = kT it follows that<br />
dipole-dipole interaction would be stronger than the thermal<br />
fluctuations at 300 K.<br />
Let us consider a system consisting <strong>of</strong> N superparamagnetic<br />
spherical particles with an average radius, r, located on<br />
the surface <strong>of</strong> porous media with pore volume Vpor . Let us<br />
also assume that distribution <strong>of</strong> metal particles on the surface<br />
<strong>of</strong> the substrate is Poisson’s (the most common physical<br />
considerations suggest that this can be the case). Thus, the<br />
distribution function <strong>of</strong> the distances from the center <strong>of</strong> one<br />
particle can be written as [41]:<br />
(18)<br />
where λ = N/Vpor is the number <strong>of</strong> particles in the elementary<br />
volume <strong>of</strong> porous support. The average distance between the<br />
particles is calculated as follows:<br />
(19)<br />
After integration, it appears that: L≈0.55·(Vpor /N) 1/3 2 4 3<br />
f( l) = 4π⋅l<br />
⋅λ⋅exp( −λ π⋅l<br />
)<br />
3<br />
∞<br />
3 ⎛ 4 3⎞<br />
l = 4πλ<br />
∫ l ⋅exp ⎜−λπ⋅l<br />
⎟ dl<br />
0 ⎝ 3 ⎠<br />
and<br />
consequently Eint ≈ 0.17MN/Vpor . The resulting expression<br />
allows the calculation <strong>of</strong> the energy <strong>of</strong> dipole-dipole interaction<br />
for a specific metal-supported catalytic system.<br />
It should be noted that the techniques <strong>of</strong> magnetic<br />
granulometry which were described above are applicable<br />
only to the ensemble <strong>of</strong> superparamagnetic particles. If the<br />
system in addition to superparamagnetic particles contains<br />
single-domain ones, the determination <strong>of</strong> particle size distribution<br />
becomes more complicated. In this case, the following<br />
approximate expression can be used for estimating the fraction<br />
<strong>of</strong> superparamagnetic particles:<br />
γ = 1 - 2σr /σs (20)<br />
where σr is residual magnetization and σs is saturation<br />
magnetization [29]. However, it should be noted that the<br />
estimation is valid only provided that the system does not<br />
contain multidomain ferromagnetic particles. For cobaltcontaining<br />
systems it means in particular that the sample<br />
does not contain particles with D ≥ 20 nm [12, 18].<br />
Naturally, the question arises: how can one prove that the<br />
system does not contain particles larger than the upper criti-<br />
Oil & Gas Science and Technology – Rev. IFP, Vol. 64 (2009), No. 1<br />
cal size <strong>of</strong> single-domain particles? Recently we proposed a<br />
relatively easy way to “eliminate” the systems containing<br />
multidomain ferromagnetic particles with D > D cr . [42].<br />
Low-temperature oxidation <strong>of</strong> metals (T < 600 K) usually<br />
proceeds via formation <strong>of</strong> thin oxide films on the surface <strong>of</strong><br />
metal particles. The formation <strong>of</strong> these films reduces the<br />
apparent size <strong>of</strong> relevant metal particles. If measurements are<br />
taken at temperatures above the Néel temperature <strong>of</strong> metal<br />
oxides, when the magnetic exchange interactions at the<br />
boundaries between oxide and metal can be neglected, the<br />
qualitative dependence <strong>of</strong> the coercive force on the particle<br />
size (Fig. 4) remains valid. Therefore, if D > D cr , then mild<br />
oxidation would lead to an increase in coercive force, H c .<br />
Otherwise, if D < D cr , then the coercive force would decrease<br />
as a result <strong>of</strong> the oxidative treatment.<br />
Recently, we proposed [43] a method for granulometric<br />
analysis <strong>of</strong> systems based on the hysteresis loop. Below is an<br />
example <strong>of</strong> this analysis conducted with a system containing<br />
cobalt metal particles. The relevant field dependence curve<br />
measured using an experimental setup described elsewhere<br />
[44] is shown in Figure 8. The shape <strong>of</strong> the field dependence<br />
indicates the presence <strong>of</strong> two types <strong>of</strong> cobalt metal particles.<br />
The presence <strong>of</strong> residual magnetization is probably due to<br />
“larger” cobalt single-domain ferromagnetic particles, while<br />
non-saturation <strong>of</strong> the hysteresis loop in the strong magnetic<br />
field (H = 8000 Oe) is indicative <strong>of</strong> “smaller” superparamagnetic<br />
ferromagnetic particles.<br />
The behavior <strong>of</strong> superparamagnetic particles in the<br />
magnetic field is described by the Langevin function [45].<br />
80<br />
40<br />
0<br />
-40<br />
-80<br />
Magnetization (arb. units) 120<br />
-120<br />
-6000<br />
Figure 8<br />
Experimental and theoretical loops<br />
Superparamagnetic<br />
particles<br />
-4000<br />
-2000 0<br />
H (Oe)<br />
Single domain particles<br />
2000<br />
4000<br />
6000<br />
Typical experimental and calculated hysteresis loops for a<br />
fine Co particle system, illustrating the theoretical approach<br />
presented in the text.
PA Chernavskii et al. / <strong>Magnetic</strong> <strong>Characterization</strong> <strong>of</strong> <strong>Fischer</strong>-<strong>Tropsch</strong> <strong>Catalysts</strong> 33<br />
For calculation <strong>of</strong> the particle size distribution <strong>of</strong> “larger”<br />
particles, we will suppose that all ferromagnetic particles<br />
have single-domain structure, spherical shape and uniaxial<br />
anisotropy. The well-known Stoner and Wohlfarth model<br />
[20] for non-interacting single-domain particles with uniaxial<br />
magneto-crystalline anisotropy and the axis <strong>of</strong> “easy” magnetization<br />
oriented randomly in space is used for description <strong>of</strong><br />
“larger” ferromagnetic particles.<br />
The weights α and β <strong>of</strong> the superparamagnetic and singledomain<br />
particle distribution, correspondingly, can be found<br />
using a normalization condition and the condition <strong>of</strong> proportionality<br />
<strong>of</strong> volumes <strong>of</strong> two fractions <strong>of</strong> particles to their satu-<br />
(1) (2) ration magnetizations Ms and Ms :<br />
(21)<br />
where V1 and V2 are the volume <strong>of</strong> the corresponding<br />
fractions.<br />
The following parameters were taken: the magnetic<br />
moment on the Co atom, mCo =1.62 μB /atom; and the fcc-Co<br />
lattice constant, a = 3.545 Å. The calculation gives the<br />
saturation magnetization, Ms = 1349 emu/cm3 ; uniaxial<br />
anisotropy constant, K1 = 4.53 × 10⁶ erg/cm3 (whence one<br />
gets H0 = 3358 Oe), and exchange stiffness constant,<br />
A = 2.8×10⁻⁶ () 1<br />
αV1<br />
M s<br />
α+ β=<br />
1,<br />
= ( 2)<br />
βV2<br />
M s<br />
erg/cm (the experimental value for nanocrys-<br />
talline Co samples, according to Ref. [46]). Then for the<br />
ferromagnetic exchange length we get L 0<br />
ex = 78.6 Å. The<br />
calculated particle size distribution is shown in Figure 9.<br />
The temperature dependence <strong>of</strong> the residual magnetization<br />
provides another opportunity to calculate the particle size in<br />
Particle size distribution<br />
0.04<br />
0.03<br />
0.02<br />
0.01<br />
0.00<br />
0<br />
Figure 9<br />
Superparamagnetic particles<br />
20 40 60<br />
Diameter <strong>of</strong> particle (Å)<br />
Single domain particles<br />
Particle size distribution <strong>of</strong> fine Co particles evaluated from<br />
the hysteresis loop shown in Figure 5 [40].<br />
80<br />
the catalysts containing single-domain and superparamagnetic<br />
particles. In this case, the particle size can be evaluated<br />
quantitatively. It is known that the upper critical size <strong>of</strong> single-domain<br />
particles is only weakly dependent on temperature,<br />
at least in the temperature range <strong>of</strong> 20 to 100 °C [47].<br />
Using Equation (20), the γ value was measured at 20 and<br />
100 °C and assuming log-normal particle size distribution<br />
[23, 48] one can solve numerically and yield the distribution<br />
parameters: μ (average value) and σ (mean-square deviation).<br />
μ and σ can be calculated as follows:<br />
2<br />
V = exp ( μ+ σ / 2)<br />
,<br />
(22)<br />
2 2 2<br />
( V − V)<br />
= exp( 2μ+ 2σ )− exp(<br />
2 μ+ σ ) .<br />
V (T) is the critical volume <strong>of</strong> a superparamagnetic particle at<br />
a temperature T.<br />
4 MAGNETISM OF SMALL PARTICLES<br />
AND ADSORPTION<br />
All magnetic properties which are discussed above refer to<br />
bulk ferromagnetics. It is, however, obvious that decreasing<br />
particle size would result in a higher fraction <strong>of</strong> surface<br />
atoms which have a lower metal-metal coordination number.<br />
These surface atoms can adsorb molecules from the gaseous<br />
phase. Upon chemisorption the d-orbitals <strong>of</strong> surface atoms<br />
would be involved in chemical bonding with the adsorbate<br />
and thus, they would be excluded from magnetic exchange<br />
interaction. In fact, it appears that after adsorption and chemical<br />
bonding, the contribution <strong>of</strong> surface atoms to the overall<br />
magnetic properties <strong>of</strong> ferromagnetic or superparamagnetic<br />
particles is strongly affected. This suggests that the impact <strong>of</strong><br />
adsorption on magnetization should be taken into account<br />
when studying the magnetic properties <strong>of</strong> small and especially<br />
nano-sized ferromagnetic particles.<br />
The effect <strong>of</strong> adsorption on magnetization was observed<br />
very clearly with nickel catalysts. The dependences <strong>of</strong> magnetization<br />
on hydrogen coverage, which are also called<br />
“magnetic isotherms”, were measured for these catalysts.<br />
Linear and reversible magnetic isotherms were observed with<br />
nickel-supported catalysts. The slope <strong>of</strong> the magnetic<br />
isotherms is approximately 1.4 μ B. The atomic nickel magnetic<br />
moment is 0.6 μ B , and hence α H2 ≈ 2 μ Ni . This suggests<br />
that at dissociative adsorption <strong>of</strong> hydrogen on nickel, one<br />
hydrogen molecule eliminates approximately two nickel<br />
atoms from the magnetic interaction. In a comparative study<br />
<strong>of</strong> H 2 and O 2 adsorption on NiCu alloys [49], it was shown<br />
that, contrary to O 2 , H 2 does not induce a demetallization <strong>of</strong><br />
the surface atom (i.e. there is no surface hydride formation);<br />
only a magnetic decoupling occurs upon H 2 adsorption.<br />
The number <strong>of</strong> surface atoms that are magnetically decoupled<br />
by the adsorption has been called the “magnetic bond<br />
number” by Selwood [8, 50]. This notion seems to be particularly<br />
suitable for nickel catalysts. This concept was extended
34<br />
Magnetization (arb. units)<br />
12<br />
10<br />
8<br />
6<br />
4<br />
2<br />
0<br />
0<br />
400<br />
800 1200<br />
Time (s)<br />
to a series <strong>of</strong> molecules, giving the structure <strong>of</strong> the corresponding<br />
adsorbed species [51] and validated by comparing<br />
IR and magnetic results <strong>of</strong> CO adsorption on NiCu alloys<br />
[52]. Figure 10 shows magnetization which was measured<br />
using a vibrating sample magnetometer, as a function <strong>of</strong> the<br />
number <strong>of</strong> pulses <strong>of</strong> carbon monoxide into the argon flow<br />
passing through the 40 wt.% Ni/SiO 2 catalyst at T = 300 K.<br />
The pulses were generated by a 6-way valve and the chemical<br />
composition <strong>of</strong> the gaseous phase was measured on-line by an<br />
IR detector. After each pulse a drop <strong>of</strong> magnetization was first<br />
observed and then the magnetization was slightly increased.<br />
Apparently, this was due to the partial desorption <strong>of</strong> carbon<br />
monoxide. With oxygen adsorption on Ni or Co at 283 K the<br />
catalyst is likely to undergo oxidation. The relevant phenomena<br />
will be discussed in more detail below.<br />
Figure 11 shows variation in relative magnetization <strong>of</strong> the<br />
Ni/Cr 2 O 3 catalyst when the flow <strong>of</strong> hydrogen over the catalyst<br />
was switched to a flow <strong>of</strong> argon at T = 400 K and vice<br />
versa. The observed increase in magnetization after switching<br />
from hydrogen to argon can be primarily attributed to<br />
the hydrogen desorption process. The subsequent switch<br />
from Ar to hydrogen leads to a rapid decline in magnetization<br />
to its level previously observed in the flow <strong>of</strong> hydrogen.<br />
This observation indicates that hydrogen and other<br />
chemisorbing gases have to be desorbed from the reduced<br />
catalysts prior to doing magnetic measurements when the<br />
extent <strong>of</strong> reduction or particle size are evaluated.<br />
The relationship between magnetization and hydrogen<br />
coverage is even more complex for cobalt catalysts. If with<br />
Oil & Gas Science and Technology – Rev. IFP, Vol. 64 (2009), No. 1<br />
CO pulses<br />
1600<br />
0<br />
2000<br />
1200<br />
1000<br />
800<br />
600<br />
400<br />
200<br />
Figure 10<br />
Influence <strong>of</strong> number <strong>of</strong> pulses <strong>of</strong> carbon monoxide on the<br />
magnetization <strong>of</strong> 40 wt.% Ni/SiO2 at T = 300 K.<br />
CO pulses<br />
Magnetization (arb. units)<br />
1.01<br />
1<br />
0.99<br />
0.98<br />
0.97<br />
0.96<br />
0.95<br />
0.94<br />
0.93<br />
0<br />
Ar<br />
100<br />
200 300<br />
Time (s)<br />
400<br />
nickel the dependence <strong>of</strong> magnetization on hydrogen coverage<br />
is not much affected by temperature, with cobalt catalysts<br />
α H2 increases with temperature. This seems to indicate<br />
that hydrogen adsorption is an activated process on cobalt<br />
catalysts, as was previously suggested by Bartholomew [53-<br />
54]. Decrease in magnetic moment upon hydrogen adsorption<br />
on cobalt normalized by the number <strong>of</strong> cobalt surface<br />
atoms is 0.54 ± 0.06 μ B at T = 300 K which yields α H2 ≈1<br />
[55]. In a more detailed magnetic study, two types <strong>of</strong> H 2<br />
chemisorption were identified on Co, corresponding to molecular<br />
adsorption at room temperature (α H2 ≈0.3μ B ) and dissociative<br />
adsorption at 200°C (α H2 ≈0.7μ B) [56]. These α H2<br />
values are much lower than those expected from the magnetic<br />
atomic moment <strong>of</strong> Co (1.6μ B ), if surface atoms, as in<br />
the case <strong>of</strong> Ni, have lost the magnetic contribution upon<br />
adsorption. This suggests that hydrogen does not completely<br />
cover the cobalt metallic surface, as is the case <strong>of</strong> nickel<br />
under similar conditions. Thus, H 2 adsorption is not a convenient<br />
method to measure Co dispersion. This reinforces<br />
interest to magnetic granulometry for the characterization <strong>of</strong><br />
Co-based <strong>Fischer</strong>-<strong>Tropsch</strong> catalysts.<br />
Hydrogen adsorption on ultrafine iron does not modify,<br />
within the experimental error, its magnetization (α H2 ≈0μ B )<br />
[57].<br />
It appears that α H2 decreases along with the sequence Ni,<br />
Co, Fe. This has been related to the different electronic structures<br />
<strong>of</strong> the 3 metals, from “hard” ferromagnetic Ni (Fermi<br />
level crossing only the d↓ sub-band) to “s<strong>of</strong>t” Fe (Fermi level<br />
crossing both the d↓ and d↓ sub-bands). H 2 adsorption<br />
H 2<br />
500 600<br />
Figure 11<br />
Temporal dependence <strong>of</strong> magnetization on time after<br />
switching from hydrogen to argon flow and vice versa for<br />
Ni/Cr 2 O 3 at T = 400 K.
modifies the Fermi level state density, generating a perturbation<br />
that is restricted to one sub-band (Ni), leading to a strong<br />
perturbation, or is shared by the two sub-bands (Fe), without<br />
global magnetic change. Co is an intermediate case [58].<br />
5 TOPOCHEMICAL REACTIONS IN IRON<br />
FISCHER-TROPSCH CATALYSTS<br />
Topochemical reactions <strong>of</strong>ten accompany <strong>Fischer</strong>-<strong>Tropsch</strong><br />
synthesis. For example, in the hydrogenation <strong>of</strong> carbon<br />
monoxide on cobalt-supported catalysts, it was suggested<br />
that cobalt could be partially oxidized by water, especially at<br />
higher carbon monoxide conversions. Carburization is usually<br />
observed during <strong>Fischer</strong>-<strong>Tropsch</strong> synthesis on iron catalysts.<br />
Passivation <strong>of</strong> cobalt catalysts usually represents the<br />
formation <strong>of</strong> oxide layer on the surface <strong>of</strong> metal particles.<br />
The topochemical reactions which proceed during catalyst<br />
preparations, pretreatments and catalytic reactions have several<br />
specificities. In particular, little information is available<br />
about the dependence <strong>of</strong> thermodynamics and kinetics <strong>of</strong><br />
topochemical reactions on the particle size <strong>of</strong> ferromagnetics<br />
in the range <strong>of</strong> 10-100 nm.<br />
Interaction between the supported metal or metal oxide<br />
and the support can also dramatically affect the catalyst<br />
activity and selectivity. With sub-ferrous metals, this interaction<br />
results in the changes in magnetization. This suggests<br />
that these processes can be investigated using magnetic<br />
methods. Combining the traditional temperature-programed<br />
reduction (TPR) with continuous measurements <strong>of</strong> magnetization<br />
has provided new insights into the mechanisms and<br />
kinetics <strong>of</strong> topochemical reactions proceeding during reduction,<br />
oxidation and different pretreatments <strong>of</strong> <strong>Fischer</strong>-<br />
<strong>Tropsch</strong> catalysts. The section below reviews the data<br />
obtained for iron catalysts.<br />
5.1 Kinetics <strong>of</strong> Reduction <strong>of</strong> Iron Oxides<br />
PA Chernavskii et al. / <strong>Magnetic</strong> <strong>Characterization</strong> <strong>of</strong> <strong>Fischer</strong>-<strong>Tropsch</strong> <strong>Catalysts</strong> 35<br />
Although the reduction <strong>of</strong> bulk metal oxides has been<br />
addressed in a very large number <strong>of</strong> works, the mechanism <strong>of</strong><br />
reduction <strong>of</strong> small particles <strong>of</strong> metal oxides has been little<br />
studied. High reactivity <strong>of</strong> supported nano-oxides on the one<br />
hand, and competition between reduction and reaction <strong>of</strong><br />
supported oxides with the support, on the other hand, makes<br />
this task particularly difficult. Figure 12 shows the dependence<br />
<strong>of</strong> magnetization on temperature, in other words, the<br />
thermomagnetic curve (TMC), obtained during temperatureprogramed<br />
heating <strong>of</strong> a Fe 2 O 3 /SiO 2 (12 wt.% Fe on KSK-2<br />
silica) catalyst in a flow <strong>of</strong> hydrogen [59]. The T 1 , T 2 , T 3 temperatures,<br />
which correspond to the A, B, C points in Figure<br />
12, depend on the temperature ramping rate. Thus, the X axis<br />
does not display the specific temperatures, but only the Curie<br />
temperature <strong>of</strong> iron (1043 K). The dotted lines correspond to<br />
TMC obtained during cooling down the sample from a given<br />
I<br />
A<br />
B<br />
B’<br />
C<br />
T1 T2 T3 1043<br />
T<br />
Figure 12<br />
Dependence <strong>of</strong> magnetization on temperature during the<br />
reduction <strong>of</strong> Fe2O3 /SiO2 with hydrogen.<br />
to room temperature. Increase in the temperature ramping<br />
rate leads to a shift in the TMC towards higher temperatures,<br />
but upon reaching 1043 K the magnetization always drops to<br />
zero. This suggests that at the temperature ramping rates (up<br />
to 1.5 K/s), the sample has enough time to attain a thermal<br />
equilibrium with the registering thermocouples. The applied<br />
technique allows one either to stop the programmable heating<br />
or sharply cooling sample, or continue the experiment in the<br />
isothermal regime. It turned out that the catalyst, which was<br />
cooled down after attaining the T2 temperature, regardless <strong>of</strong><br />
ramping rate represents Fe3O4 /SiO2 . This was confirmed by<br />
measuring the Curie temperature <strong>of</strong> this sample, by XRD<br />
analysis and Mossbauer spectroscopy. The sample, which<br />
was heated to T3 and then cooled down to room temperature,<br />
had no magnetization. XRD and Mossbauer spectroscopy<br />
showed that in the catalyst obtained from the cooling from T3 to room temperature all iron was in the form <strong>of</strong> vustite (FeO)<br />
[60]. When the catalyst is heated above the T3 temperature,<br />
the increase in magnetization is due to the reduction <strong>of</strong> FeO<br />
to α-Fe. α-Fe was detected in these conditions by XRD.<br />
The total saturation magnetic moment, Ms , experimentally<br />
measured by the magnetometer due to the presence <strong>of</strong> n magnetic<br />
phases, can be expressed as follows:<br />
s<br />
s<br />
M ( T) = ∑ M T<br />
(23)<br />
i ( )<br />
i s s M (T) = σ i (T)⋅ mi<br />
i<br />
D<br />
E<br />
(24)
36<br />
where σs i (T) is the specific saturation magnetization <strong>of</strong> the<br />
i-th phase at T temperature; mi is the mass <strong>of</strong> the i-th phase<br />
with<br />
s<br />
lim σ ( T ) = 0<br />
(25)<br />
T→T( θ) i<br />
where T(θ)- is the Curie temperature <strong>of</strong> the i-th phase. If the<br />
function σs i (T) is known for each phase, then mi can be<br />
obtained from Equations (23-25) using the experimental data<br />
Ms (T). Note that the following method <strong>of</strong> determining mi remains valid provided the contribution to the magnetization<br />
<strong>of</strong> superparamagnetic particles can be neglected. In Reference<br />
[60] a magnetic hysteresis in the field dependence curve was<br />
observed for all the samples. It can be suggested that the<br />
fraction <strong>of</strong> particles smaller than 8 nm was minor.<br />
The specific saturation magnetization σs i (T) <strong>of</strong> magnetite<br />
and iron was calculated from the experimentally measured<br />
temperature dependences <strong>of</strong> the saturation magnetic moment<br />
<strong>of</strong> commercially available Fe3O4 and α-Fe (high purity<br />
grade). The thermomagnetic curves Ms (T) were obtained by<br />
heating the sample in the flow <strong>of</strong> pure helium to avoid sample<br />
oxidation during the measurements. The empirical dependencies<br />
<strong>of</strong> specific saturation magnetization σs i (T) can be reasonably<br />
well described by polynomials Pk (T), where k = 7.<br />
Substitution <strong>of</strong> the empirical relationships into the system <strong>of</strong><br />
Equations (23-25) allows determination <strong>of</strong> mi at any point <strong>of</strong><br />
temperature-programed reduction with simultaneous recording<br />
<strong>of</strong> the magnetization. It can be assumed that the measured<br />
Ms is proportional to the m mass <strong>of</strong> the reference samples <strong>of</strong><br />
magnetite and iron [12].<br />
The above method allows the measurement <strong>of</strong> the concentration<br />
<strong>of</strong> magnetic phases anywhere on the thermomagnetic<br />
curve. The characteristic points <strong>of</strong> the spectrum are Tmax and<br />
Tmin (in Fig. 12, points B and C, respectively). A total magnetization<br />
<strong>of</strong> the sample was measured at the points C (Tmin )<br />
and B (Tmax ) after heating it to the appropriate temperature<br />
and further cooling to room temperature. The observed magnetic<br />
moment is due to the presence <strong>of</strong> either Fe3O4 or Fe or<br />
both compounds. The presence <strong>of</strong> these phases was confirmed<br />
by XRD. In addition, at the magnetization minimum<br />
(point C) XRD detected the presence <strong>of</strong> FeO. The method<br />
described above allows determination anywhere the value <strong>of</strong><br />
m and the fractions <strong>of</strong> Fe3O4 and Fe at Tmax and Tmin . The calculation<br />
showed that the concentration <strong>of</strong> magnetite did not<br />
depend on the temperature ramping rate and is equal to 85%<br />
at VH2 = 60 ml/min. At high ramping rates, magnetite concentration<br />
substantially depends on the flow rate <strong>of</strong> hydrogen.<br />
When the flow is less than 40 ml/min, a sharp decrease in the<br />
concentration <strong>of</strong> magnetite is observed. This decrease is<br />
attributed to the formation <strong>of</strong> FeO.<br />
Isothermal heating at a given temperature allows more<br />
detailed investigation <strong>of</strong> the selected reduction steps<br />
Fe2O3 → Fe3O4 → FeO → Fe (Fig. 12) [61]. Using the<br />
dependence <strong>of</strong> the temperature <strong>of</strong> emergence <strong>of</strong> ferro- and ferrimagnetic<br />
phases on the ramping rate, the kinetics <strong>of</strong> formation<br />
Oil & Gas Science and Technology – Rev. IFP, Vol. 64 (2009), No. 1<br />
<strong>of</strong> different phases can be followed at different temperatures<br />
and thus, the apparent activation energies can be determined.<br />
The kinetic curves obtained at different temperatures were<br />
analyzed assuming uniformity <strong>of</strong> the reaction space.<br />
It appears that the kinetics <strong>of</strong> Fe2O3 /SiO2→Fe3O4 /SiO2 transformation at the temperature range from 573 to 615 K is<br />
well described by Er<strong>of</strong>eev-Avrami equation:<br />
[-ln(1-α)] 1/2 = kt (26)<br />
where α is the product fraction and k is the kinetic constant.<br />
The kinetics <strong>of</strong> isothermal reduction <strong>of</strong> Fe3O4 /SiO2 to<br />
FeO/SiO2 exhibits a high initial rate and is described by the<br />
model <strong>of</strong> a shrinking sphere coupled with diffusion (Yander<br />
equation):<br />
[1-(1-α) 1/3 ] 2 = kt (27)<br />
The same model can also be used to describe the transformation<br />
FeO/SiO2→Fe/SiO2 .<br />
The technique <strong>of</strong> continuous measurement <strong>of</strong> magnetization<br />
during reduction has been very useful for studying the<br />
effect <strong>of</strong> the reduction promoters such as Pt, or Cu [62].<br />
Temperature dependence <strong>of</strong> magnetization during the reduction<br />
<strong>of</strong> Fe2O3/SiO2 and Pt/Fe2O3/SiO2 catalysts in hydrogen<br />
shows that Pt promotion lowers the temperature <strong>of</strong> iron<br />
reduction.<br />
5.2 Kinetics <strong>of</strong> Iron Carburization in Carbon<br />
Monoxide Hydrogenation<br />
Several iron carbides have been described in the literature:<br />
FeC carbide, hexagonal ε-Fe 2 C (Curie temperature T θ =<br />
653±10 K), pseudo-hexagonal ε’-Fe 2.2 C (T θ = 723±10 K),<br />
monoclinic Hägg χ-Fe 5 C 2 carbide (T θ = 478-529 K varies<br />
according to different sources) and orthorhombic θ-Fe 3 C<br />
cementite (T θ = 481±3 K) [63-66]. Each <strong>of</strong> these carbides can<br />
be detected during <strong>Fischer</strong>-<strong>Tropsch</strong> synthesis on iron catalysts<br />
[67]. The carbide composition depends on the H 2 /CO ratio,<br />
size <strong>of</strong> iron particles, extent <strong>of</strong> iron reduction and temperature.<br />
It appears that in the conditions <strong>of</strong> <strong>Fischer</strong>-<strong>Tropsch</strong> synthesis<br />
iron carburization involves hydrogen. Matsumoto and<br />
Bennett [68] showed that in the mixture <strong>of</strong> H 2 and CO iron<br />
can be carburized more readily than in CO/Ar. In the latter<br />
case carburization proceeds much more slowly and leads to<br />
another phase composition <strong>of</strong> carburization products. The<br />
authors suggest the following reaction for carburization in<br />
syngas: 4CO + 6Fe + 2H 2 = 2H 2 O + CO 2 + 3Fe 2 C.<br />
The ε’-carbide usually occurs during <strong>Fischer</strong>-<strong>Tropsch</strong><br />
synthesis on iron catalysts promoted with K 2 O, Cu and Si<br />
[65]. It is thermally instable in the absence <strong>of</strong> promoters and<br />
at T > 623 K it readily transforms into Hägg carbide. As the<br />
carburization advances, a mixture <strong>of</strong> ε’-carbide and Hägg<br />
χ-Fe 5C 2 carbide appears, at the end <strong>of</strong> carburization only<br />
χ-carbide has been detected [66].
PA Chernavskii et al. / <strong>Magnetic</strong> <strong>Characterization</strong> <strong>of</strong> <strong>Fischer</strong>-<strong>Tropsch</strong> <strong>Catalysts</strong> 37<br />
Formation <strong>of</strong> cementite during <strong>Fischer</strong>-<strong>Tropsch</strong> synthesis<br />
is typically an outcome <strong>of</strong> its thermal stability and easy<br />
decomposition <strong>of</strong> Hägg carbide in the excess <strong>of</strong> iron. It has<br />
been shown [65] that stability <strong>of</strong> iron carbides increases in the<br />
following sequence: ε’-Fe2.2C < ε-Fe2C < χ-Fe5C2 < θ-Fe3C. The carbides transform from one form into another with<br />
increase in temperature. Loktev et al. observed [69] that<br />
ε- and ε’-carbides occured at 388 K, at 423-458 K only ε-carbide<br />
was detected, at 493-673 K ε-carbide transforms into<br />
Hägg carbide, and at 723 K the cementite phase was obtained.<br />
Among different iron carbides, the identification <strong>of</strong><br />
ε’-Fe2.2C and ε-Fe2C carbides is particularly difficult [70,<br />
71]. It is not always very clear whether ε’ or ε-carbide can be<br />
considered as a primary product <strong>of</strong> iron carburization [66].<br />
The data about lattice parameters <strong>of</strong> ε’- and ε-iron carbides<br />
vary considerably according to different authors. This could<br />
lead to their incorrect identification from XRD data. The<br />
magnetic measurements can provide additional information<br />
about the composition <strong>of</strong> carbide phases, because <strong>of</strong> difference<br />
in their Curie temperatures.<br />
Investigation <strong>of</strong> carburization kinetics using the in situ<br />
magnetic method has proven to provide important information.<br />
In the conditions when only ε’- and χ-carbides occur,<br />
the fractions <strong>of</strong> these carbides can be deduced by the solution<br />
<strong>of</strong> linear equations with two unknown parameters:<br />
X1 M(ε’) σ (ε’) + X2 M(χ) σ(χ)– Ic = 0<br />
(28)<br />
σ(Fe) {(M(ε’) – 12) X1 + (M(χ) – 12) X2 } – IFe = 0<br />
where σ(i) is the specific magnetization i-th phase at room<br />
temperature, X1 and X2 are, respectively, the number <strong>of</strong> moles<br />
<strong>of</strong> ε’- and χ-carbides, M(ε’) and M(χ) are their molecular<br />
weights, and IC and IFe are the measured magnetizations.<br />
During carburization the overall magnetization <strong>of</strong> the<br />
sample decreases because σ(Fe) > Σσ(i) over a whole<br />
temperature range. This allows the extent <strong>of</strong> iron carburization<br />
to be determined using the following expression:<br />
(29)<br />
where α(t) is the carburization conversion at time t, Ii is<br />
sample magnetization at T temperature, and i means the<br />
following: i = 0 for the initial sample; i = c for a carburized<br />
sample at time t and after completing the carburization IT c (∞).<br />
T T<br />
Io−Ic() t<br />
α( t)<br />
= T T<br />
Io−Ic( ∞)<br />
The kinetics <strong>of</strong> carburization can be followed using continuous<br />
measurement <strong>of</strong> magnetization [72]. In addition, the<br />
measurement <strong>of</strong> the initial and final magnetization allows the<br />
composition <strong>of</strong> the carbide phases to be quantitatively determined.<br />
This is possible because the carbide content is stoichiometrically<br />
related to the mass <strong>of</strong> iron in the sample<br />
before the carburization. It should be noted that application<br />
<strong>of</strong> this method imposes some restrictions on phase composition.<br />
Thus, the presence <strong>of</strong> magnetite makes the application<br />
<strong>of</strong> Equation (29) incorrect, because in this case the magnetite<br />
contributes to the total magnetization.<br />
The specific rate <strong>of</strong> carburization can be determined by<br />
the equation:<br />
W (30)<br />
where n is the number <strong>of</strong> iron moles, and s is the specific area<br />
<strong>of</strong> iron.<br />
The conventional phenomenological theory <strong>of</strong> chemical<br />
kinetics involving a gas and a solid describes the situation<br />
which arises after the nuclei <strong>of</strong> the solid phase product are<br />
formed, and when heterogeneous inclusions appear within<br />
the solid. This is the so-called “pre-nuclear” period, which<br />
determines nucleus generation and thus further progress <strong>of</strong><br />
the reaction [49]. It turns out that at very low conversions<br />
(α < 0.03) the dependence <strong>of</strong> the carburization rate on the<br />
reaction time has a characteristic minimum. The sharp decline<br />
in the carburization rate in the initial period is due to the need<br />
to overcome some resistance because <strong>of</strong> the formation <strong>of</strong><br />
nuclei solid products. This effect is most pronounced at temperatures<br />
below 523 K. It has been shown [73-74] that the<br />
number <strong>of</strong> nuclei <strong>of</strong> the carbide phase is a function <strong>of</strong> time:<br />
N = zo S [1- exp(-k2t)] (31)<br />
where zo is the number <strong>of</strong> potential sites <strong>of</strong> nucleation, S is<br />
the surface area and k2 is the rate constant <strong>of</strong> nuclei formation.<br />
The dependence <strong>of</strong> conversion on time is described by<br />
the Avrami- Er<strong>of</strong>eev equation:<br />
N = zo S [1- exp(-k2t)] (32)<br />
where k1’= k1/zoS/n. Processing experimental data using<br />
Equation (31) yields the values <strong>of</strong> k1 and k2 through minimizing<br />
the root-mean-square deviation.<br />
Obviously, the method <strong>of</strong> continuous measurement <strong>of</strong><br />
magnetization can be applied to studying any other<br />
topochemical process which involves changes in magnetization.<br />
Naturally, the temperature <strong>of</strong> the experiment should not<br />
exceed the Curie temperature <strong>of</strong> ferromagnetic species.<br />
n d<br />
= ⋅<br />
s dt<br />
α<br />
6 CHARACTERIZATION OF COBALT CATALYSTS<br />
DURING DIFFERENT PRETREATMENTS<br />
AND THE FISCHER-TROPSCH REACTION<br />
Because <strong>of</strong> their stability, higher per pass conversion and<br />
high hydrocarbon productivity, cobalt catalysts represent the<br />
optimal choice for synthesis <strong>of</strong> long-chain hydrocarbons in<br />
<strong>Fischer</strong>-<strong>Tropsch</strong> synthesis. The <strong>Fischer</strong>-<strong>Tropsch</strong> reaction<br />
proceeds on cobalt metal particles supported by oxide supports<br />
(Al 2 O 3 , SiO 2 , TiO 2 , etc.). Information about the cobalt<br />
metal species is therefore crucial for the design <strong>of</strong> these catalysts.<br />
Only metallic cobalt has ferromagnetic properties. This<br />
makes data interpretation much easier than for iron catalysts.<br />
Both Co 3 O 4 and CoO are antiferromagnetic at lower temperatures.<br />
At the Néel temperature (30 K for Co 3O 4 [75], 288 K<br />
for CoO [76]) they undergo antiferromagnetic-paramagnetic
38<br />
Rate <strong>of</strong> H 2 consumption, (μmol s -1 g -1)<br />
30<br />
25<br />
20<br />
15<br />
10<br />
5<br />
transition. At ambient and higher temperatures, both Co 3 O 4<br />
and CoO exhibit paramagnetic behavior. This leads to only<br />
very small magnetization <strong>of</strong> the oxidized cobalt catalysts in<br />
the magnetic field. Our estimations suggest that the contribution<br />
<strong>of</strong> cobalt oxides to the overall magnetization is much<br />
lower than 5%. Thus, for cobalt-containing catalysts the<br />
magnetic method is almost selectively sensitive to the presence<br />
<strong>of</strong> cobalt metallic species.<br />
The magnetic measurements for cobalt catalysts can be<br />
conducted either in situ or ex situ. The in situ experiments<br />
involve measuring catalyst magnetization during different<br />
pretreatments and catalytic reaction. Cobalt has a high Curie<br />
temperature (≈1400 K) and hence cobalt reduction in most<br />
cases can be investigated in situ. A combination <strong>of</strong> the conventional<br />
methods <strong>of</strong> catalyst investigation such as temperature-programed<br />
reduction (TPR) with a continuous measurement<br />
<strong>of</strong> magnetization has proved to be very fruitful. The<br />
ex situ experiments address characterization <strong>of</strong> catalysts<br />
which were exposed to the reacting medium and then<br />
transferred to the magnetometer. In several cases this transfer<br />
can be done without exposure to air.<br />
The magnetic method can provide three sorts <strong>of</strong> information<br />
about cobalt FT catalysts. First, the extent <strong>of</strong> reduction<br />
can be evaluated. The measurement <strong>of</strong> the concentration <strong>of</strong><br />
the cobalt metal phase can <strong>of</strong>ten be done in situ in transient<br />
conditions. Secondly, the magnetic method can provide<br />
important information about oxidation <strong>of</strong> cobalt nanoparticles.<br />
Thirdly, the sizes <strong>of</strong> cobalt metal particles can be measured<br />
from the magnetic data.<br />
Oil & Gas Science and Technology – Rev. IFP, Vol. 64 (2009), No. 1<br />
0<br />
0 100 200 300 400 500 600 700<br />
a) Temperature (°C)<br />
b)<br />
Magnetization (arb. units)<br />
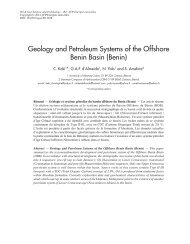
Figure 13<br />
Combined TPR and magnetization pr<strong>of</strong>iles during the reduction <strong>of</strong> 15% Co/ZrO2 + 6% Y2O3 (I) Tcalc = 300°C a) and 600°C b), tcalc – 0.5 h.<br />
Rate <strong>of</strong> H 2 consumption, (μmol s -1 g -1)<br />
30<br />
25<br />
20<br />
15<br />
10<br />
5<br />
0<br />
0<br />
100<br />
200 300 400<br />
Temperature (°C)<br />
6.1 Reducibility Measurements<br />
500<br />
600<br />
Reduction <strong>of</strong> cobalt species can be followed in situ using the<br />
magnetic method coupled with conventional TPR. Since the<br />
magnetic method is very sensitive to the presence <strong>of</strong> ferromagnetic<br />
phases, the formation <strong>of</strong> cobalt metal particles can<br />
be detected at relatively low concentrations, as was done for<br />
example, in La(Co,Fe)O 3 perovskites [77, 78].<br />
In contrast to conventional TPR, which operates with<br />
diluted hydrogen, the magnetic measurements can be done in<br />
pure hydrogen. This leads to more reliable data about cobalt<br />
reducibility than those obtained from conventional TPR. It<br />
was shown [79] that diluted hydrogen in TPR experiments<br />
could lead to significantly lower extents <strong>of</strong> reduction than<br />
those normally attained in pure hydrogen. The magnetic<br />
method can also detect the temperature <strong>of</strong> emergence <strong>of</strong> the<br />
cobalt metal phase. This information is essential for prediction<br />
and description <strong>of</strong> catalytic performance <strong>of</strong> cobalt catalysts<br />
in <strong>Fischer</strong>-<strong>Tropsch</strong> synthesis.<br />
Figure 13 shows TPR pr<strong>of</strong>iles <strong>of</strong> 15% Co/ZrO 2 + 6%<br />
Y 2 O 3 catalysts, calcined prior to reduction at 300 and 600°C<br />
for 0.5 h [80]. The same figure also displays the temperature<br />
dependence <strong>of</strong> magnetization during TPR measurements for<br />
the same catalysts. The low temperature TPR peak is not<br />
accompanied by an increase in magnetization. This suggests<br />
that this peak can be attributed to partial reduction <strong>of</strong> cobalt<br />
oxide which does not result in emergence <strong>of</strong> the ferromagnetic<br />
phase, probably Co 3 O 4 → CoO transition. The TPR<br />
peak observed at higher temperatures is accompanied by<br />
increase in magnetization. And thus, it could probably be<br />
Magnetization (arb. units)<br />
700
Magnetization (emu/g)<br />
50<br />
45<br />
40<br />
35<br />
30<br />
25<br />
20<br />
15<br />
10<br />
5<br />
4<br />
3<br />
2<br />
1<br />
PA Chernavskii et al. / <strong>Magnetic</strong> <strong>Characterization</strong> <strong>of</strong> <strong>Fischer</strong>-<strong>Tropsch</strong> <strong>Catalysts</strong> 39<br />
0<br />
273 373 473 573 673 773 873 973<br />
Temperature (K)<br />
Figure 14<br />
Magnetization versus temperature in pure hydrogen for<br />
monometallic cobalt alumina-supported catalysts calcined at<br />
(1) 473 K, (2) 613 K, (3) 673 K, (4) 773 K (ramping rate<br />
28.2 K/min). Reprinted from [112] with permission from<br />
Elsevier.<br />
attributed to the CoO → Co reduction step. High catalyst<br />
calcination temperature leads to the decrease in intensity <strong>of</strong><br />
the low temperature TPR peak and to its disappearance for<br />
the catalyst precalcined at 600°C. This is probably attributed<br />
to lower stability <strong>of</strong> supported Co 3 O 4 at higher temperatures<br />
and its transformation into more stable CoO. At<br />
T > 500°C the TPR pr<strong>of</strong>iles exhibit the third peak, which is<br />
accompanied by an increase in magnetization and thus corresponds<br />
to the emergence <strong>of</strong> the metal phase. This peak<br />
could be attributed to the reduction <strong>of</strong> a mixed, hardly<br />
reducible Co-Zr oxide.<br />
Figures 14 and 15 dispaly the in situ magnetic data for<br />
monometallic and Pt-promoted cobalt alumina-supported<br />
catalysts obtained in pure hydrogen. It appears [81] that the<br />
temperature <strong>of</strong> emergence <strong>of</strong> the cobalt metal phase in<br />
monometallic cobalt alumina-supported catalysts is a function<br />
<strong>of</strong> the catalyst calcination temperature. The cobalt<br />
metallic phase was detected starting from 547 K in the catalyst<br />
which was calcined at 473 K, while in the catalysts precalcined<br />
at higher temperatures (643, 673 and 773 K), the<br />
cobalt metallic phase emerges at 570-581 K. Different<br />
results were obtained for silica-supported catalysts. In those<br />
catalysts it was found that cobalt reduction proceeded much<br />
more easy when the catalysts were calcined at moderately<br />
higher temperatures (673 K instead <strong>of</strong> 423 K [82]). These<br />
effects were interpreted in different interactions between the<br />
cobalt and support in alumina- and silica-supported catalysts.<br />
Promotion with noble metals (Pt, Ru and Re) can also<br />
Magnetization (J) (emu/g)<br />
30<br />
25<br />
20<br />
15<br />
10<br />
5<br />
0<br />
273 373 473 573 673 773 873 973<br />
Temperature (K)<br />
Figure 15<br />
Magnetization versus temperature in pure hydrogen for<br />
monometallic (1) and (2) platinum promoted (0.1 wt.% Pt)<br />
cobalt alumina-supported catalysts (catalyst calcination<br />
temperature is 773 K, ramping rate during reduction<br />
28.2 K/min).<br />
significantly facilitate cobalt reduction [79, 81, 83]. Figure<br />
15 shows that cobalt metal particles in Pt-promoted catalysts<br />
can be detected by the magnetic method at 463-473 K, while<br />
in monometallic cobalt catalysts the metallic particles were<br />
usually observed above 563 K.<br />
The magnetic method could also provide information<br />
about the mechanism <strong>of</strong> cobalt reduction. Figure 16 displays<br />
differential magnetization (dJ/dT) measured at different heating<br />
rates for Pt-promoted cobalt alumina-supported catalysts.<br />
The differential magnetization is proportional to the rate <strong>of</strong><br />
formation <strong>of</strong> cobalt metal phases. Figure 16 shows that the<br />
position <strong>of</strong> the differential magnetization maxima is a function<br />
<strong>of</strong> the catalyst heating rate; the maximum <strong>of</strong> differential<br />
magnetization is situated at a lower temperature, when the<br />
catalyst is heated with a slower heating rate. This suggests<br />
that formation <strong>of</strong> cobalt metal phases is an activated process.<br />
The activation energy <strong>of</strong> formation <strong>of</strong> the cobalt metal phase<br />
can be calculated using the equation [84]:<br />
d ln<br />
Tm<br />
E<br />
R<br />
d<br />
T<br />
Φ ⎛ ⎞<br />
⎜ 2 ⎟<br />
⎝ ⎠<br />
=−<br />
⎛ 1 ⎞<br />
⎜ ⎟<br />
⎝ ⎠<br />
m<br />
2<br />
(33)<br />
where E is the activation energy, R is the universal gas constant,<br />
Φ is the heating rate and T m is the temperature <strong>of</strong> the<br />
maximum <strong>of</strong> differential magnetization. In this method the<br />
activation energy is calculated from the slope in the plot <strong>of</strong><br />
1
40<br />
0.2<br />
0.15<br />
0.1<br />
Diff. Magnetization 0.25<br />
0.05<br />
9 K/min<br />
⎛ 1 ⎞<br />
ln versus ⎜ ⎟.<br />
The activation energies <strong>of</strong> formation<br />
⎝Tm<br />
⎠<br />
<strong>of</strong> cobalt metal phases for monometallic and Pt-promoted<br />
cobalt alumina-supported catalysts were, respectively, 130<br />
and 60 kJ/mol [81].<br />
Other promoters <strong>of</strong> Co reduction have been studied. The<br />
selective production <strong>of</strong> higher alcohols (gasoline boosters)<br />
from syngas is a special case <strong>of</strong> <strong>Fischer</strong>-<strong>Tropsch</strong> synthesis<br />
developed by the IFP [85-86]. The process makes use <strong>of</strong><br />
Co/Al2O3 catalysts obtained via a specific coprecipitation<br />
method with Cu, Zn and Na as promoters. It has been shown<br />
by a combined TPR/magnetic study that Cu favors Co reduction<br />
via two effects:<br />
– Cu decreases the amount <strong>of</strong> Co ions located in the spinel<br />
CoAl2O4 , a structure that is difficult to reduce<br />
– metallic copper, produced at low reduction temperatures,<br />
may act as a catalyst for the Co reduction [87].<br />
Unfortunately, in situ magnetic measurements are not<br />
always feasible in realistic <strong>Fischer</strong>-<strong>Tropsch</strong> reaction conditions,<br />
because <strong>of</strong> difficulties maintaining high pressures and<br />
temperatures in the experimental cell during magnetic measurements.<br />
In this case, however, the essential information<br />
about cobalt catalysts can be obtained using a “pseudo in situ”<br />
method [88]. Note that in the reactor, cobalt catalysts are usually<br />
coated with hydrocarbon wax produced by <strong>Fischer</strong>-<br />
<strong>Tropsch</strong> synthesis. It is assumed that this wax can protect<br />
cobalt catalysts from reoxidation during their transfer from the<br />
reactor to the magnetometer and during the magnetization<br />
measurements. Van de Loosdrecht et al. [88] characterized<br />
wax-coated cobalt alumina-supported catalysts which were<br />
Φ ⎛ ⎞<br />
⎜ 2 ⎟<br />
⎝Tm<br />
⎠<br />
Oil & Gas Science and Technology – Rev. IFP, Vol. 64 (2009), No. 1<br />
28.2 K/min<br />
102 K/min<br />
0<br />
373 473 573 673 773 873 973<br />
Temperature (K)<br />
Figure 16<br />
Influence <strong>of</strong> temperature rate on the differential<br />
magnetization <strong>of</strong> a cobalt Pt-promoted cobalt aluminasupported<br />
catalyst in pure hydrogen. Reprinted from [112]<br />
with permission from Elsevier.<br />
90<br />
80<br />
70<br />
60<br />
50<br />
40<br />
30<br />
20<br />
Extent <strong>of</strong> reduction (%) 100<br />
10<br />
0<br />
0<br />
20<br />
40<br />
60 80 100<br />
Days on-stream<br />
Figure 17<br />
Extent <strong>of</strong> cobalt reduction in cobalt alumina-supported<br />
catalysts as a function <strong>of</strong> time on-stream in a slurry bubble<br />
column reactor.<br />
exposed to commercially relevant <strong>Fischer</strong>-<strong>Tropsch</strong> conditions<br />
(503 K, 20 bar (H 2 + CO), conversion between 50 and 70%)<br />
in a 100 barrel/day slurry bubble column reactor with a diameter<br />
<strong>of</strong> 0.9 m. The extent <strong>of</strong> reduction was calculated from the<br />
value <strong>of</strong> saturation magnetization. Figure 17 shows the extent<br />
<strong>of</strong> cobalt reduction in the alumina-supported catalysts as a<br />
function <strong>of</strong> time on-stream. The extent <strong>of</strong> cobalt reduction<br />
does not seem to decrease with time on-stream. It is <strong>of</strong>ten postulated<br />
[1, 89, 90] that reoxidation <strong>of</strong> small supported cobalt<br />
particles by water produced by <strong>Fischer</strong>-<strong>Tropsch</strong> synthesis is<br />
the principal reason for catalyst deactivation. The magnetic<br />
data [88] suggest however that reoxidation <strong>of</strong> cobalt metal<br />
particles in industrial <strong>Fischer</strong>-<strong>Tropsch</strong> reactors could be prevented<br />
by efficient control <strong>of</strong> water and hydrogen pressures.<br />
The metallic stability <strong>of</strong> cobalt under <strong>Fischer</strong>-<strong>Tropsch</strong> conditions<br />
(523 K, 50 bar (2 H 2 + CO), GHSV l0 4 h -l ), has also<br />
been related to the catalyst formulation [87]. In line with<br />
report [88], the magnetization <strong>of</strong> a Co/Al 2 O 3 catalyst, selective<br />
towards hydrocarbons, is unchanged during the reaction,<br />
the observed catalyst deactivation being related to carbon<br />
fouling (no bulk oxide or carbide formation). Contrarily, the<br />
CuNaZn-promoted Co/Al 2O 3, selective towards higher alcohols,<br />
shows, under similar reaction conditions, a loss <strong>of</strong> metallic<br />
cobalt that has been related to the formation <strong>of</strong> Co 2 C [87].<br />
6.2 Oxidation <strong>of</strong> Cobalt Nanoparticles<br />
120<br />
140<br />
160<br />
Oxidation <strong>of</strong> small cobalt particles in <strong>Fischer</strong>-<strong>Tropsch</strong><br />
catalysts is important from both practical and theoretical
PA Chernavskii et al. / <strong>Magnetic</strong> <strong>Characterization</strong> <strong>of</strong> <strong>Fischer</strong>-<strong>Tropsch</strong> <strong>Catalysts</strong> 41<br />
points <strong>of</strong> view. Practically, it is important to know the optimal<br />
conditions for passivation <strong>of</strong> reduced catalysts. In addition, it<br />
is essential to know the conditions when the active metal can<br />
be oxidized. Both <strong>of</strong> these phenomena require understanding<br />
the specificity <strong>of</strong> oxidation <strong>of</strong> small metal particles.<br />
From the theoretical point <strong>of</strong> view, small metal nanoparticles<br />
can be considered as model systems to study the dependence<br />
<strong>of</strong> topochemical reactions on the particle size <strong>of</strong> ferromagnetics.<br />
The method <strong>of</strong> continuous in situ measurement <strong>of</strong><br />
magnetization provides important information about their<br />
low temperature oxidation (from 280 to 500 K).<br />
During oxidation the magnetization decreases from the<br />
initial value which corresponds to the reduced sample, I0 , to<br />
some value, I(t), which corresponds to time t. Assuming the<br />
number <strong>of</strong> cobalt metal particles to be constant, the magnetization,<br />
I0 , is proportional to r3 , where r is the radius <strong>of</strong> an<br />
average Co particle. From geometric considerations it is<br />
easy to show that the oxide layer thickness can be defined<br />
as follows:<br />
⎡<br />
−13<br />
/<br />
⎛ ⎛ ⎞ ⎞ ⎤<br />
δ= ⋅⎢ I0<br />
r 1−⎜1. 48⋅⎜−1⎟+ 1⎟<br />
⎥ (34)<br />
⎣⎢<br />
⎝ ⎝ It () ⎠ ⎠ ⎥⎦<br />
where 1.48 is the ratio <strong>of</strong> Co and CoO densities.<br />
It is known that the gradient <strong>of</strong> electric potential is very<br />
small when oxide films have considerable thickness.<br />
Consequently, the mass transfer only depends on the concentration<br />
gradients. In these circumstances the oxidation proceeds<br />
according to the parabolic law, which follows from the<br />
theory <strong>of</strong> Wagner [91]. In the case <strong>of</strong> thin oxide films, however,<br />
especially at low temperatures, when the diffusion <strong>of</strong><br />
ions is hindered, the gradient <strong>of</strong> electric potential may play a<br />
major role. The kinetics <strong>of</strong> thin oxide film formation at low<br />
temperatures is consistent with the Cabrera-Mott theory [92].<br />
The theory predicts the existence <strong>of</strong> a critical temperature.<br />
Below this temperature the film thickness reaches the limit,<br />
which can be several dozens <strong>of</strong> angstroms. After attaining<br />
this limit the film growth considerably slows down.<br />
The thickness, δ, <strong>of</strong> oxide film is a function <strong>of</strong> the temperature.<br />
This thickness can be determined from the equation:<br />
Veb<br />
δ=<br />
(35)<br />
( W − 39k<br />
T)<br />
where V is the electric potential in the oxide layer, e is the<br />
electron charge, b is the value approximately equal to a half<br />
<strong>of</strong> the interplanar distance <strong>of</strong> the oxide crystal lattice, W is the<br />
work necessary to remove from the cation vacancy from the<br />
surface to the volume and k B is the Boltzmann constant.<br />
Equation (35) suggests that the thickness limit exists only at<br />
temperatures below W/39k B .<br />
Figure 18 shows the dependence <strong>of</strong> the thickness <strong>of</strong> oxide<br />
layer on time for the isothermal oxidation <strong>of</strong> a 10 wt.%<br />
Co/Al 2 O 3 catalyst at several temperatures. After the oxide<br />
film has attained some thickness, its growth is strongly<br />
affected by the temperature. This qualitatively corresponds to<br />
B<br />
the oxidation involving the Cabrera-Mott model [92].<br />
Oxidation in non-isothermal mode allows the production <strong>of</strong><br />
TPO (temperature-programed oxidation) pr<strong>of</strong>iles, which<br />
reflect the dependence <strong>of</strong> the oxidation rate on temperature.<br />
The oxidation rate is determined by the rate <strong>of</strong> decrease in<br />
magnetization, thus the magnetization-TPO pr<strong>of</strong>iles in this<br />
case reflect only a drop in cobalt metal concentration, as<br />
opposed to the traditional method <strong>of</strong> TPO, which records the<br />
overall rate <strong>of</strong> oxygen absorption by the sample. Figure 19<br />
displays magnetization-TPO pr<strong>of</strong>iles for the 10 wt.%<br />
Co/ZrO 2 + 6% Y 2 O 3 catalyst.<br />
To explain the presence <strong>of</strong> several peaks in magnetization-<br />
TPO pr<strong>of</strong>iles which correspond to several maxima <strong>of</strong> oxidation<br />
rates, the fraction <strong>of</strong> superparamagnetic particles was<br />
measured at different stages <strong>of</strong> oxidation. The highest is the<br />
fraction <strong>of</strong> superparamagnetic particles, the smallest is the<br />
average size <strong>of</strong> cobalt particles in the catalyst. The measurements<br />
<strong>of</strong> the residual magnetization indicate a decline in the<br />
fraction <strong>of</strong> superparamagnetic particles after the first TPO<br />
peak has been attained. Thus, it follows that the first TPO<br />
peak is probably due to the oxidation <strong>of</strong> relatively small Co<br />
particles, while the second peak corresponds to the oxidation<br />
<strong>of</strong> larger metal particles.<br />
The magnetization-TPO spectra can therefore provide the<br />
essential information about the metal particle size distribution.<br />
Note that it is rather difficult to extract this information from<br />
the conventional TPO method, because the TPO pr<strong>of</strong>iles are<br />
usually rather complex. A combination <strong>of</strong> TPO pr<strong>of</strong>iles with<br />
in situ measurements <strong>of</strong> magnetization provides new insights<br />
into metal particle size distribution in cobalt catalysts.<br />
12<br />
8<br />
6<br />
4<br />
δ (rel. units) 10<br />
2<br />
0<br />
20<br />
40 60<br />
Time (s)<br />
Figure 18<br />
Dependence <strong>of</strong> the thickness <strong>of</strong> oxide layer on the surface <strong>of</strong><br />
cobalt particles on time <strong>of</strong> oxidation for 10 wt% Co/Al2O3. 80<br />
211°C<br />
170°C<br />
100°C<br />
20°C<br />
100
42<br />
O 2 consumption (rel.units)<br />
1400 1400<br />
1200<br />
1000<br />
800<br />
600<br />
400<br />
200<br />
0<br />
2<br />
100<br />
6.3 Measuring Cobalt Metal Particle Size<br />
1<br />
Determination <strong>of</strong> sizes <strong>of</strong> cobalt particles is based on the<br />
relation between the magnetization and intensity <strong>of</strong> magnetic<br />
field. Below are summarized several methodologies which<br />
were used in our recent publications to determine cobalt<br />
metal particle sizes in supported catalysts.<br />
First, the preliminary analysis <strong>of</strong> cobalt particle size distribution<br />
in cobalt-supported catalysts can be realized using<br />
variation in coercive force during mild oxidization (see also<br />
Sect. 3). It is known that the coercive force increases with the<br />
size <strong>of</strong> single-domain cobalt particles and reaches [12, 19,<br />
42] a maximum for cobalt metal particles <strong>of</strong> about 20 nm.<br />
Then the coercive force decreases to the limit typical <strong>of</strong> bulk<br />
metal cobalt. At relatively low temperatures, oxidation <strong>of</strong><br />
cobalt metal particles follows a Cabrera-Mott mechanism<br />
(see Sect. 6.2) [92]. In this mechanism, the oxidation proceeds<br />
via formation <strong>of</strong> thin oxide layers on the surface <strong>of</strong><br />
metal particles. Therefore, oxidation in mild conditions could<br />
reduce the apparent size <strong>of</strong> cobalt metal particles. If the average<br />
size <strong>of</strong> cobalt particles is larger than 20 nm, the decrease<br />
in the apparent size <strong>of</strong> cobalt metal particles would result in<br />
an increase in coercive force. If the average size <strong>of</strong> cobalt<br />
particles is smaller than 20 nm, the oxidation would lead to a<br />
decrease in coercive force. This technique allows qualitative<br />
ranking <strong>of</strong> cobalt-supported catalysts into two major groups:<br />
catalysts with larger cobalt particles (> 20 nm) and catalysts<br />
with smaller cobalt particles (< 20 nm).<br />
The second method <strong>of</strong> evaluation <strong>of</strong> cobalt particle size<br />
distribution involves catalysts which contain only superparamagnetic<br />
and single-domain ferromagnetic cobalt particles.<br />
Oil & Gas Science and Technology – Rev. IFP, Vol. 64 (2009), No. 1<br />
200 300 400<br />
Temperature (°C)<br />
500<br />
Figure 19<br />
TPO pr<strong>of</strong>ile <strong>of</strong> a 10 wt.% Co/ZrO2 + 6% Y2O3 catalyst.<br />
600<br />
1200<br />
1000<br />
800<br />
600<br />
400<br />
200<br />
Magnetization (rel.units)<br />
In these catalysts the fraction <strong>of</strong> superparamagnetic particles<br />
can be estimated using Equation (20). This method was used<br />
to evaluate variation <strong>of</strong> cobalt particle size in monometallic<br />
and Pt-promoted cobalt alumina-supported catalysts [81].<br />
Table 1 shows that promotion with Pt and higher catalyst<br />
reduction temperatures <strong>of</strong> monometallic cobalt alumina-supported<br />
catalysts result in an increase in the fraction <strong>of</strong> superparamagnetic<br />
particles and thus, in smaller average diameter<br />
<strong>of</strong> cobalt particle size. Some increase in the fraction <strong>of</strong> cobalt<br />
superparamagnetic particles upon promotion with Ru and Re<br />
was also observed [79] in silica-supported catalysts.<br />
TABLE 1<br />
Fraction <strong>of</strong> superparamagnetic cobalt particles in alumina-supported<br />
catalysts calculated using Equation (20) as a function <strong>of</strong> catalyst reduction<br />
temperature and promotion with Pt<br />
Catalyst Reduction<br />
Catalyst calcination temperature<br />
temperature (K)<br />
Co/Al 2 O 3 -473 473<br />
Co/Al 2 O 3 -613 613<br />
Co/Al 2 O 3 -673 673<br />
Co/Al 2 O 3 -773 773<br />
Co/Al 2 O 3 -473 473<br />
Co/Al 2 O 3 -773 773<br />
* Reduction in pure hydrogen, ramp 28.2 K/min.<br />
Fraction <strong>of</strong><br />
super-paramagnetic<br />
cobalt metal<br />
particles in the<br />
reduced catalysts<br />
(d < 7 nm) (%)<br />
973 70<br />
673 66<br />
973 61<br />
673 60<br />
973 58<br />
673 54<br />
973 62<br />
673 56<br />
973 87<br />
673 90<br />
973 71<br />
673 77<br />
The third method <strong>of</strong> particle size analysis addresses catalysts<br />
which contain only superparamagnetic catalysts. In<br />
these catalysts the cobalt particle size can be obtained by<br />
fitting the field dependence curves using the Langevin formula<br />
(Equation (8)). Barbier and Dalmon et al. [37, 93-94]<br />
showed that small cobalt particles could be prepared in silica-supported<br />
catalysts using the ammonia method. The<br />
magnetic method revealed that these small cobalt metal<br />
particles had superparamagnetic properties. The particle<br />
size distributions in these catalysts were measured using<br />
the Langevin function. The magnetic data were consistent<br />
with the results <strong>of</strong> transmission electron microscopy. The<br />
catalytic performance in CO + H 2 reaction as a function <strong>of</strong><br />
Co average particle size showed that the reaction rate
PA Chernavskii et al. / <strong>Magnetic</strong> <strong>Characterization</strong> <strong>of</strong> <strong>Fischer</strong>-<strong>Tropsch</strong> <strong>Catalysts</strong> 43<br />
(expressed per metallic surface area) presented a maximum.<br />
Smaller particles were not efficient towards CO conversion<br />
and chain growth. This was related to the so-called<br />
ensemble effect [95].<br />
Impregnation <strong>of</strong> silica with cobalt acetate solution also<br />
results in cobalt superparamagnetic particles [79]. Figure 20<br />
presents the field dependences measured for the catalysts prepared<br />
from cobalt acetate. The field dependence without hysteresis<br />
loop is indicative <strong>of</strong> the presence <strong>of</strong> only superparamagnetic<br />
metal particles in these catalysts. The size <strong>of</strong> cobalt<br />
metallic particles was estimated using Equation (8). The calculation<br />
yields the size <strong>of</strong> superparamagnetic particles in the<br />
range <strong>of</strong> 3-6 nm.<br />
The superparamagnetic particles can also be obtained in<br />
silica-supported catalysts prepared using addition <strong>of</strong> sucrose<br />
during co-impregnation with solutions <strong>of</strong> cobalt nitrate and<br />
ruthenium or rhenium precursors [79]. The hysteresis loops<br />
observed in these catalysts without sucrose addition suggest<br />
the presence <strong>of</strong> single-domain and multidomain ferromagnetic<br />
particles (Fig. 21a). This indicates the large size <strong>of</strong><br />
cobalt particles. Addition <strong>of</strong> sucrose to the impregnating<br />
solution results in a major increase in cobalt dispersion.<br />
Mostly superparamagnetic particles were detected in these<br />
catalysts after their reduction in hydrogen. The calculation<br />
yields cobalt particle size <strong>of</strong> 4 nm for cobalt silica-supported<br />
catalysts promoted with rhenium and sucrose. The relevant<br />
Magnetization (arb. units)<br />
-8000 -6000 -4000 -2000 2000 4000 6000 8000<br />
H (Oe)<br />
Ac d = 6 nm<br />
Ru Ac d = 3.6 nm<br />
Re Ac d = 3.3 nm<br />
Figure 20<br />
Field dependences measured for cobalt silica-supported<br />
catalysts prepared from cobalt acetate: (Ac) monometallic<br />
Co/SiO2 , (RuAc) CoRu/SiO2 , (ReAc) CoRe/SiO2 . The<br />
catalysts were obtained via s<strong>of</strong>t decomposition <strong>of</strong> cobalt<br />
acetate at 443 K. The cobalt particle sizes in the reduced<br />
catalysts were calculated from the Langevin formula<br />
(Equation (8)).<br />
cobalt Ru-promoted catalyst prepared with sucrose addition<br />
probably contains both superparamagnetic and single-domain<br />
ferromagnetic particles (Fig. 21b). The calculation using<br />
Equation (20) estimates as 97% the fraction <strong>of</strong> superparagmanetic<br />
particles in this catalyst. The fraction <strong>of</strong> singledomain<br />
ferromagnetic particles in this sample is therefore<br />
lower than 3%. Assuming that 3% <strong>of</strong> single-domain ferromagnetic<br />
particles do not disturb to a larger extent the field<br />
dependence curve, the evaluation using the Langevin function<br />
(Equation (8)) yields 6 nm for cobalt metal particle size<br />
in CoRu/SiO 2 prepared with sucrose addition.<br />
Magnetization (arb. units)<br />
a)<br />
Magnetization (arb. units)<br />
b)<br />
-7000 -5000 -3000 -1000 1000 3000 5000 7000<br />
H (Oe)<br />
-7000 -5000 -3000 -1000 1000 3000 5000 7000<br />
H (Oe)<br />
Figure 21<br />
Field dependences measured for CoRu/SiO2 catalysts<br />
prepared without a) and with b) addition <strong>of</strong> sucrose.<br />
Reprinted from [112] with permission from Elsevier.
44<br />
Smaller cobalt superparamagnetic particles can also be<br />
prepared in alumina-supported catalysts using decomposition<br />
<strong>of</strong> cobalt nitrate in glow discharge plasma [96]. The experimental<br />
procedure was similar to that previously applied to<br />
nickel catalysts [97]. The supports were impregnated with<br />
cobalt nitrate and dihydrogen hexachloroplatinate and dried<br />
at 373 K. Then, the plasma treatment in mild conditions was<br />
performed, at nearly room temperature for 45 minutes in<br />
nitrogen plasma for decomposition, and for another 45 minutes<br />
in hydrogen plasma for reduction. The catalysts were<br />
reduced at 673 K in hydrogen flow. The relevant field dependence<br />
curves exhibit [96] the sigmoid shape characteristic <strong>of</strong><br />
superparamagnetic particles with an average cobalt particle<br />
size <strong>of</strong> about 5 nm.<br />
The preparation recipe may play a key role in the final Co<br />
dispersion. A Co/Al 2 O 3 catalyst prepared by coprecipitation<br />
and reduced at 773 K shows a large fraction <strong>of</strong> ferromagnetic<br />
particles blocked at room temperature (ca. 30 wt.%) [87].<br />
When Cu is introduced during the coprecipitation, the system<br />
is superparamagnetic (average particle size 4 nm). This effect<br />
has been related to the higher dispersion <strong>of</strong> the Co oxide<br />
phase in the precursor, before reduction [87]. Such an effect<br />
<strong>of</strong> Cu addition has not been observed in the case <strong>of</strong> conventional<br />
impregnation <strong>of</strong> Co and Cu [98].<br />
7 COMPARISON OF MAGNETIC METHODS<br />
AND OTHER TECHNIQUES OF CATALYST<br />
CHARACTERIZATION<br />
The magnetic method is particularly sensitive to the presence<br />
<strong>of</strong> ferromagnetic phases in cobalt, iron and nickel catalysts.<br />
Three sorts <strong>of</strong> information about catalyst structure can be<br />
obtained:<br />
– about the overall fraction <strong>of</strong> ferromagnetic phases,<br />
– about size and size distribution <strong>of</strong> ferromagnetic particles,<br />
– about the mechanism <strong>of</strong> formation <strong>of</strong> different carbide and<br />
oxide phases in iron catalysts.<br />
Variation in magnetization during chemisorption can provide<br />
information about the stoichiometry <strong>of</strong> chemisorption, in particular<br />
for nickel catalysts. Saturation magnetization allows<br />
quantitative evaluation <strong>of</strong> the fraction <strong>of</strong> the cobalt metal<br />
phase and thus the extent <strong>of</strong> cobalt reduction in both transient<br />
and steady state conditions during different pretreatments and<br />
catalytic reaction. Measuring field dependences (magnetization<br />
versus magnetic field) could provide essential information<br />
about the sizes <strong>of</strong> ferromagnetic particles. The specificity<br />
<strong>of</strong> the magnetic method is that in many cases the information<br />
about catalyst structure can be obtained in situ when the<br />
sample has become inaccessible to other characterization<br />
techniques.<br />
Temperature-programed reduction (TPR) is a common<br />
technique which can evaluate catalyst reducibility. The TPR<br />
methods, however, has several shortcomings. The reduction<br />
Oil & Gas Science and Technology – Rev. IFP, Vol. 64 (2009), No. 1<br />
in TPR experiments is conducted in diluted hydrogen (typically<br />
5-10% H 2 in inert gas), while the catalysts for catalytic<br />
measurements are typically reduced in pure hydrogen. It is<br />
known [79] that the rate and extent <strong>of</strong> reduction are to a<br />
greater extent affected by hydrogen partial pressure. Thus,<br />
the extent <strong>of</strong> reduction calculated from hydrogen consumption<br />
in TPR experiments could be much lower than the extent<br />
<strong>of</strong> reduction normally obtained during reduction in pure<br />
hydrogen. Note that the reduction <strong>of</strong> transition metal oxides<br />
<strong>of</strong>ten involves several steps, e.g. the reduction <strong>of</strong> Co 3 O 4 to<br />
cobalt metallic phases usually proceeds via intermediate formation<br />
<strong>of</strong> CoO [99-101]. Thus, the attribution <strong>of</strong> hydrogen<br />
consumption peaks to different metal oxide reduction steps is<br />
<strong>of</strong>ten arbitrary in TPR experiments [102] and should always<br />
be confirmed by additional experimental evidence. In cobalt<br />
catalysts, only metallic cobalt has ferromagnetic properties.<br />
Thus, with cobalt catalysts the increase in magnetization is<br />
primarily due to the growth <strong>of</strong> cobalt metallic phases.<br />
Several spectroscopic methods such as X-ray photoelectron<br />
spectroscopy (XPS), X-ray diffraction (XRD) and X-ray<br />
absorption (XANES/EXAFS) [103] also allow the measurement<br />
<strong>of</strong> the extent <strong>of</strong> reduction. The accuracy in measuring<br />
the extent <strong>of</strong> reduction depends, however, on the quality<br />
<strong>of</strong> the decomposition <strong>of</strong> spectra, which <strong>of</strong>ten represent a<br />
combination <strong>of</strong> signals coming from different reduced and<br />
oxidized phases. The experiments are commonly conducted<br />
with the reduced catalysts in quasi-steady state conditions,<br />
while the magnetic method can detect magnetization variation<br />
in the catalyst transient state. The rapid development <strong>of</strong><br />
time-resolved spectroscopy such as dispersive EXAFS and<br />
Quick-EXAFS [104] can possibly overcome some <strong>of</strong> these<br />
difficulties.<br />
The magnetic method also provides quantitative information<br />
about particle sizes and particle size distribution.<br />
Unfortunately, the particle size can only be estimated qualitatively<br />
when the catalysts contain both single-domain and<br />
multidomain ferromagnetic particles. It is known that XRD,<br />
TEM, XPS and EXAFS also provide information about<br />
metal particle size in the supported catalysts. The principal<br />
drawback <strong>of</strong> particle size evaluation from XRD pr<strong>of</strong>iles<br />
using the Scherrer equation or Williamson-Hall method<br />
[105] is due to the polycrystallinity <strong>of</strong> small metal and oxide<br />
particles in supported catalysts. The accuracy in evaluation <strong>of</strong><br />
the crystallite sizes smaller than 6 nm from XRD data is<br />
rather low because <strong>of</strong> significant broadening <strong>of</strong> the diffraction<br />
patterns.<br />
Evaluation <strong>of</strong> particle size from transmission and scanning<br />
electron microscopy requires uniform catalyst samples [106].<br />
Sample heterogeneity can introduce dramatic effect on the<br />
quality <strong>of</strong> particle size evaluation. In the samples with high<br />
metal contents, the presence <strong>of</strong> agglomerates makes it difficult<br />
to obtain sufficient contrast and to measure the sizes <strong>of</strong><br />
primary metal particles. The electron beam could alter particle<br />
size [107], particularly when interacting with smaller
metal particles. The electron measurements are usually conducted<br />
in ultrahigh vacuum or at very low pressures [106],<br />
while it is generally accepted that the presence <strong>of</strong> gaseous<br />
components can significantly modify catalyst structure.<br />
The Kerk<strong>of</strong>-Moulijn [108] and Kuipers models [109] are<br />
commonly used for evaluation <strong>of</strong> nanoparticle sizes from<br />
XPS data. These models, however, are only valid for diluted<br />
samples (metal content < 10 wt.%). In addition, the simultaneous<br />
presence <strong>of</strong> different oxidized and reduced phases can<br />
significantly complicate interpretation <strong>of</strong> XPS data. XPS is<br />
only sensitive to the surface and subsurface layers <strong>of</strong> the catalyst<br />
[110] and non-uniform distribution <strong>of</strong> active components<br />
with the catalyst grain can significantly affect the<br />
results <strong>of</strong> XPS analysis. EXAFS provides [103, 106] information<br />
about the sizes <strong>of</strong> metal particles smaller than 1-2 nm.<br />
For larger particles, however, the accuracy <strong>of</strong> this technique<br />
is much smaller due to very minor correlation between particle<br />
size and coordination number [111]. The chemisorption<br />
methods measure only the number <strong>of</strong> metal sites in the catalysts.<br />
The amount <strong>of</strong> adsorbed gas strongly depends on the<br />
stoichiometry <strong>of</strong> adsorption, which is <strong>of</strong>ten uncertain for<br />
metal catalysts. It is known that the number <strong>of</strong> metal sites in<br />
supported catalysts is a function <strong>of</strong> both metal reducibility<br />
and metal particle size. The chemisorption methods cannot,<br />
however, distinguish between contributions to the number <strong>of</strong><br />
metal sites arising from variation in metal dispersion or metal<br />
reducibility.<br />
CONCLUSION<br />
PA Chernavskii et al. / <strong>Magnetic</strong> <strong>Characterization</strong> <strong>of</strong> <strong>Fischer</strong>-<strong>Tropsch</strong> <strong>Catalysts</strong> 45<br />
In summary, it could be argued that magnetic characterization<br />
in combination with conventional techniques, such as highresolution<br />
electron microscopy, X-ray absorption spectroscopy,<br />
X-ray photoelectron spectroscopy, X-ray diffraction, temperature-programed<br />
reduction, temperature-programed oxidation,<br />
temperature-programed surface reaction and chemisorption<br />
provides additional and sometimes unique information<br />
about the catalysts which contain ferri- or ferromagnetic<br />
phases. Magnetization is very sensitive to the fraction <strong>of</strong> the<br />
ferromagnetic phase and the sizes <strong>of</strong> small ferromagnetic<br />
nanoparticles. It appears that the small ferromagnetic particles<br />
are <strong>of</strong>ten unstable in air. Thus, the use <strong>of</strong> in situ and<br />
operando experimental setups is highly recommended.<br />
The magnetic method is particularly suited for cobaltcontaining<br />
catalysts. Only metallic cobalt has ferromagnetic<br />
properties. This simplifies the interpretation <strong>of</strong> magnetization<br />
data. The Curie temperature for cobalt is much higher than<br />
for iron and nickel. This allows investigation <strong>of</strong> small cobalt<br />
nanoparticles by the magnetic method in the conditions characteristic<br />
<strong>of</strong> most <strong>of</strong> the catalyst pretreatments and during<br />
catalytic reactions such as <strong>Fischer</strong>-<strong>Tropsch</strong> synthesis.<br />
The uniqueness <strong>of</strong> metal-supported catalysts should also<br />
be emphasized in terms <strong>of</strong> physics <strong>of</strong> nanoparticles. In metal-<br />
supported catalysts with a high specific surface there is virtually<br />
no dipole-dipole magnetic interaction. This considerably<br />
facilitates investigation <strong>of</strong> these systems using the magnetic<br />
methods.<br />
ACKNOWLEDGMENTS<br />
The authors are grateful to Dr. G.V. Pankina for help with the<br />
experiments and data analysis. They also thank Pr<strong>of</strong>essor<br />
V.V. Lunin and Dr. F. Diehl for fruitful discussions. P.A. C.<br />
acknowledges the financial support <strong>of</strong> the Russian Foundation<br />
for Fundamental Research (grant # 06-03-32500-a).<br />
REFERENCES<br />
1 Khodakov A.Y., Chu W., Fongarland P. (2007) Advances in the<br />
development <strong>of</strong> novel cobalt <strong>Fischer</strong>-<strong>Tropsch</strong> catalysts for synthesis<br />
<strong>of</strong> long-chain hydrocarbons and clean fuels, Chem. Rev.<br />
107, 1692-1744.<br />
2 Iglesia E. (1997) Design, synthesis, and use <strong>of</strong> cobalt-based<br />
<strong>Fischer</strong>-<strong>Tropsch</strong> synthesis catalysts, Appl. Catal. A-Gen. 161,<br />
59-78.<br />
3 Dry M. (2002) The <strong>Fischer</strong>-<strong>Tropsch</strong> process: 1950-2000, Catal.<br />
Today 71, 227-241.<br />
4 Chernavskii P.A., Lunin V.V. (1993) Oxide-oxide interaction in<br />
Ni, Co, and Fe supported catalysts, Kinet. Catal.+ 34, 470-477.<br />
5 http://www.iupac.org/goldbook/T06395.pdf.<br />
6 Selwood P.W. (1975) Chemisorption and Magnetization,<br />
Academic Press, New York.<br />
7 Richardson J.T. (1978) Magnetism and catalysis, J. Appl. Phys.<br />
49, 1781-1786.<br />
8 Dalmon J.-A. (1994) <strong>Catalysts</strong> <strong>Characterization</strong>, Physical<br />
Techniques for Solid Materials, Plenum, New York, pp. 585-609.<br />
9 Weiss P., Forrer R. (1926) Magnetization and Magnetocaloric<br />
Phenomena <strong>of</strong> Nickel, Ann. Phys. 5, 153-213.<br />
10 Foner S. (1959) Versatile and Sensitive Vibrating-Sample<br />
Magnetometer, Rev. Sci. Instrum. 30, 548-557.<br />
11 Chernavskii P.A. (2001) Topochemical processes in metal supported<br />
catalysts, Dr. Sci. thesis, Moscow State University.<br />
12 Petrov Y.I. (1982) Physics <strong>of</strong> small particles, Moscow, Nauka,<br />
p. 327.<br />
13 Frenkel J., Dorfman J. (1930) Spontaneous and Induced<br />
Magnetisation in Ferromagnetic Bodies, Nature 126, 274-275.<br />
14 Kondorskii E.I. (1952) On the theory <strong>of</strong> single-domain particles,<br />
Doklady Academii Nauk SSSR 82, 365-368.<br />
15 Kondorskii E.I. (1978) Micromagnetism and remagnetization <strong>of</strong><br />
quasi-single-domain particles, Izvestiya Akademii Nauk SSSR,<br />
Seriya Fizicheskaya 42, 8, 1638-1645.<br />
16 Brown W. F. Jr. (1963) Micromagnetics, Wiley-Inter., N.Y.<br />
17 Kneller E. (1969) In Magnetism and Metallurgy, Academic<br />
Press, N.Y., Vol. 1, p. 365.<br />
18 Sort J., Suriñach S., Muñoz J.S., Baró M.D., Wojcik M., Jedryka<br />
E., Nadolski S., Sheludko N., Nogués J. (2003) Role <strong>of</strong> stacking<br />
faults in the structural and magnetic properties <strong>of</strong> ball-milled<br />
cobalt, Phys. Rev. B 68, 014421, 7 p.
46<br />
Oil & Gas Science and Technology – Rev. IFP, Vol. 64 (2009), No. 1<br />
19 Pelecky D.L., Rieke D.R. (1996) <strong>Magnetic</strong> Properties <strong>of</strong><br />
Nanostructured Materials, Chem. Mater. 8, 1770-1783.<br />
20 Stoner E.C., Wohlfarth E.P. (1948) A Mechanism <strong>of</strong> <strong>Magnetic</strong><br />
Hysteresis in Heterogeneous Alloys, Philos. T. Roy. Soc. A 240,<br />
599-642.<br />
21 Chen C., Kitakami O., Shimada Y.J. (1998) Particle size effects<br />
and surface anisotropy in Fe-based granular films, J. Appl. Phys.<br />
84, 2184-2188.<br />
22 Neel L.C.R. (1949) Influence des fluctuations thermiques a<br />
l’aimantation des particules ferromagnétiques, C. R. Hebd.<br />
Seances Acad. Sci. 228, 664-668.<br />
23 Weil L. (1954) Structure <strong>of</strong> catalysts and ferromagnetic properties<br />
at very low temperatures, J. Chim. Phys. Physico-Chimie<br />
Bio. 51, 715-717.<br />
24 Wohlfarth E.P. (1980) The magnetic field dependence <strong>of</strong> the susceptibility<br />
peak <strong>of</strong> some spin glass materials, J. Phys. F: Met.<br />
Phys. 10, L241-L246.<br />
25 Bean C.P., Livingston J.D. (1959) Superparamagnetism, J. Appl.<br />
Phys. 30, S120-S129.<br />
26 Chen J.P., Sorensen C.M., Klabunde K.J. (1995) Enhanced magnetization<br />
<strong>of</strong> nanoscale colloidal cobalt particles, Phys. Rev. B<br />
51, 11527-11532.<br />
27 Billas M.L., Chatelain A., de Herr W.A. (1994) Magnetism from<br />
the Atom to the Bulk in Iron, Cobalt, and Nickel Clusters,<br />
Science 265, 1682-1684.<br />
28 Sohl H., Bertram H.N. (1997) Localized surface nucleation <strong>of</strong><br />
magnetization reversal, J. Appl. Phys. 82, 6128-6137.<br />
29 Primet M., Dalmon J.A., Martin G.A. (1977) Adsorption <strong>of</strong><br />
CO on well-defined Ni/SiO2 catalysts in the 195-373 K range<br />
studied by infrared spectroscopy and magnetic methods, J.<br />
Catal. 46, 25-36.<br />
30 Martin G.A. (1981) Détermination des tailles de particules<br />
métalliques et de leur distribution en catalyse hétérogène, Rev.<br />
Phys. Appl. 16, 181-192.<br />
31 Estournes C., Lutz T., Happich J., Quaranta T., Wissler P.,<br />
Guille J.L. (1997) Nickel nanoparticles in silica gel: Preparation<br />
and magnetic properties, J. Magn. Magn. Mater. 173, 83-92.<br />
32 Richardson J.T., Desai P. (1976) Ultrahigh magnetic field measurements<br />
<strong>of</strong> nickel crystallite size distributions, J. Catal. 42,<br />
294-302.<br />
33 Potton J.A., Daniell G.J., Eastop A.D., Kitching M., Melville D.,<br />
Poslad S., Rainford B.D., Stanley H. (1983) Ferr<strong>of</strong>luid particle<br />
size distributions from magnetisation and small angle neutron<br />
scattering data, J. Magn. Magn. Mater. 39, 95-98.<br />
34 Skilling J., Bryan R.K. (1984) Maximum-entropy image-reconstruction<br />
– general algoritm, Mon. Not. R. Astron. Soc. 211, 111.<br />
35 Zolla H.G., Spaepen F. (1995) Size distribution <strong>of</strong> Ni precipitates<br />
in Ag-Ni alloys determined by maximum entropy analysis<br />
<strong>of</strong> magnetization curves, Mater. Sci. Eng. A 204, 71-75.<br />
36 Attila Kákay, Gutowski M.W., Takacs L., Franco V., Varga L.K.<br />
(2004) Langevin granulometry <strong>of</strong> the particle size distribution, J.<br />
Phys. A: Math. Gen. 37, 6027-6042<br />
37 Lermontov A., Dalmon J.-A., Miachon S., van Berge P.J., van de<br />
Loosdrecht J. (2002) TEM and magnetic characterization <strong>of</strong><br />
well-dispersed Co/SiO2 catalysts. Abstract CATSA 2002.<br />
38 De Montgolfier P., Martin G.A., Dalmon J.-A. (1973)<br />
Granulometry and metallic mass <strong>of</strong> finely divided ferromagnetic<br />
catalyzers calculated using magnetization/magnetic field curves,<br />
J. Phys. Chem. Solids 34, 801-812.<br />
39 Dalmon J.-A., Martin G., Imelik B. (1973) Basic silicate <strong>of</strong><br />
cobalt tale and antigorite – synthesis, morphologie, thermal<br />
decomposotion and reduction by hydrogen- granulometric study<br />
<strong>of</strong> cobalt on silica catalysts thus obtained, J. Chim. Phys.<br />
Physico-Chimie Bio 70, 214-224.<br />
40 Kokorin V.V., Perekos A.E., Chuistov K.V. (1977)<br />
Magnetostatic interaction <strong>of</strong> ferromagnetic phase particles in<br />
non-ferromagnetic matrix, Fizika Metallov i Metallovedenie 43,<br />
966-971.<br />
41 Venttsel E.C., Ovcharov L.A. (1969) Theory <strong>of</strong> probability,<br />
Moscow, Nauka, p. 364.<br />
42 Chernavskii P.A. (2005) Preparation <strong>of</strong> <strong>Fischer</strong>-<strong>Tropsch</strong> catalysts,<br />
Kinetics Catal. 46, 634-640.<br />
43 Perov N.S., Sudarikova N.Yu., Bagrets A.A. (2003) The magnetic<br />
properties <strong>of</strong> the systems <strong>of</strong> the ultra-fine particles, J.<br />
Magn. (Korean Magn. Soc.) 8, 1, 7-12.<br />
44 Perov N.S., Radkovskaya A.A. (2000) A Vibrating Sample<br />
Anisometer, Proceeding <strong>of</strong> 1 & 2 Dimensional <strong>Magnetic</strong><br />
Measurement and Testing, 20-21 Sept. 2000, Bad Gastein, ISBN<br />
3-902105, p. 104.<br />
45 Yakushiji K., Mitani S., Takanashi K., Ha J.-G., Fujimori H.<br />
(2000) Composition dependence <strong>of</strong> particle size distribution and<br />
giant magnetoresistance in Co-Al-O granular films, J. Magn.<br />
Magn. Mater. 212, 75-81.<br />
46 Weissmuller J., Michels A., Barker J.G., Wiedenmann A., Erb<br />
U., Shull R.D. (2001) Analysis <strong>of</strong> the small-angle neutron scattering<br />
<strong>of</strong> nanocrystalline ferromagnets using a micromagnetics<br />
model, Phys. Rev. B 63, 2144141-21441418.<br />
47 Brown W.F. Jr. (1969) The fundamental theorem <strong>of</strong> the theory<br />
<strong>of</strong> fine ferromagnetic particles, Ann. NY Acad. Sci. 147, 463-488.<br />
48 Dormann J.L., Fiorani D, Tronc E. (1997) <strong>Magnetic</strong> relaxation in<br />
fine-particle systems, Adv. Chem. Phys. 98, 283-494.<br />
49 Dalmon J.-A., Martin G.A., Imelik B. (1974) Adsorptions de H2 et de O2 sur des alliages Ni---Cu divisés supportés sur SiO2 ,<br />
etudiées par mesure d’aimantation à saturation, Surf. Sci. 41,<br />
587-590.<br />
50 Selwood P.W. (1975) Chemisorption and Magnetization,<br />
Academic Press, New York.<br />
51 Martin G.A., Imelik B. (1974) Adsorption <strong>of</strong> hydrocarbons and<br />
various gases on Ni-SiO2 catalysts studied by high field magnetic<br />
methods, Surf. Sci. 42, 157-172<br />
52 Dalmon J.-A., Primet M., Martin G.A., Imelik B. (1975)<br />
<strong>Magnetic</strong> and infrared study <strong>of</strong> CO chemisorption on silica supported<br />
nickel-copper alloys, Surf. Sci. 50, 95-108.<br />
53 Reuel R.C., Bartholomew C.H. (1984) The stoichiometries <strong>of</strong> H2 and CO adsorptions on cobalt: Effects <strong>of</strong> support and preparation,<br />
J. Catal. 85, 63-77.<br />
54 Zowtiak J.M., Bartholomew C.H. (1983) The kinetics <strong>of</strong> H2 adsorption on and desorption from cobalt and the effects <strong>of</strong> support<br />
thereon, J. Catal. 83, 107-120.<br />
55 Abeledo C.R., Selwood P.W.J. (1962) Chemisorption <strong>of</strong> hydrogen<br />
on cobalt, J. Chem. Phys. 37, 2709.<br />
56 Dalmon J.-A., Martin G.A., Imelik B. (1974) Adsorption <strong>of</strong> H2 on Ni-Cu alloys studied by magnetic measurements, Jpn. J.<br />
Appl. Phys. Suppl. 2, Part 2, 261-264.<br />
57 Dumesic J.A., Topsoe H., Boudart, M. (1975) Surface, catalytic<br />
and magnetic properties <strong>of</strong> small iron particles: III. Nitrogen<br />
induced surface reconstruction, J. Catal. 37, 513-522.
PA Chernavskii et al. / <strong>Magnetic</strong> <strong>Characterization</strong> <strong>of</strong> <strong>Fischer</strong>-<strong>Tropsch</strong> <strong>Catalysts</strong> 47<br />
58 Dutartre R., Bussière P., Dalmon J.-A., Martin G.A. (1979)<br />
Activation <strong>of</strong> hydrogen on Fe/MgO catalysts studied by magnetic<br />
methods and Mössbauer spectroscopy, J. Catal. 59, 383-<br />
394<br />
59 Chernavskii P.A., Kiselev V.V., Kuprin A.P., Grechenko A.N.,<br />
Baranaova L.I., Lunin V.V. (1991) Characteristics <strong>of</strong> hydrogen<br />
reduction <strong>of</strong> iron-oxide applied on silica-gel, Russ. J. Phys.<br />
Chem. 65, 1675-1679.<br />
60 Chernavskii P.A., Kiselev V.V., Lunin V.V. (1992) Mechanism<br />
<strong>of</strong> the reduction <strong>of</strong> iron-oxides applied on silica gel, Russ. J.<br />
Phys. Chem. 66, 2712-2718.<br />
61 Chernavskii P.A., Pankina G.V., Zavalishin I.N., Lunin V.V.<br />
(1994) The kinetics <strong>of</strong> reduction <strong>of</strong> iron oxides supported on<br />
SiO2, Al2O3, ZrO2 by hydrogen, Kinetics Catal. 35, 111-113.<br />
62 Chernavskii P.A., Pankina G.V., Lunin V.V. (1998)<br />
Temperature-programmed reduction <strong>of</strong> Fe2O3 /Al2O3 and<br />
Pt/Fe2O3/Al2O3 catalysts, Russ. J. Phys. Chem. 72, 2086-2088.<br />
63 Wielers A.F.H., Kock A.J.H.M., Hop C.E.C.A., Geus J.W., van<br />
der Kraan A.M. (1989) The reduction behavior <strong>of</strong> silica-supported<br />
and alumina-supported iron catalysts: A Mössbauer and<br />
infrared spectroscopic study, J. Catal. 117, 1-18.<br />
64 Wang C.J., Ekerdt J.G.J. (1983) Study <strong>of</strong> <strong>Fischer</strong>-<strong>Tropsch</strong> synthesis<br />
over Fe/SiO2 : Reactive scavenging with pyridine and<br />
cyclohexene, J. Catal. 80, 172-187.<br />
65 Amelse J.A., Butt J.B., Schwartz L.H.J. (1978) Carburization <strong>of</strong><br />
supported iron synthesis catalysts, J. Phys. Chem. 82, 558-563.<br />
66 Rozovskii A.Y. (1989) Heterogeneous catalytic reactions:<br />
Kinetics and macrokinetics, Moscow, Nauka, p. 323.<br />
67 Bartolomew C.H. (1988) Hydrogen effect in catalysis.<br />
Fundamental and practical applications. Role <strong>of</strong> hydrogen in<br />
CO hydrogenation, Dekker, Basel, NY, p. 543.<br />
68 Matsumoto H., Bennett C.O. (1978) The transient method<br />
applied to the methanation and <strong>Fischer</strong>-<strong>Tropsch</strong> reactions over a<br />
fused iron catalyst, J. Catal. 53, 331-344.<br />
69 Loktev S.M., Makarenkova L.I., Slivinskii E.V., Entin S.D.<br />
(1972) Thermomagnetic analysis <strong>of</strong> fused iron catalysts for synthesis<br />
<strong>of</strong> higher alcohols from carbon monoxide and hydrogen,<br />
Kinetics Catal. 13, 1042-1049.<br />
70 Niemantsverdriet J.W., van der Kraan A.M., van Dijk W.L., van<br />
der Baan H.S. (1980) Behavior <strong>of</strong> metallic iron catalysts during<br />
<strong>Fischer</strong>-<strong>Tropsch</strong> synthesis studied with Moessbauer spectroscopy,<br />
X-ray diffraction, carbon content determination, and<br />
reaction kinetic measurements, J. Phys. Chem. 84, 3363-3370.<br />
71 Unmuth E.E., Schwartz L.H., Butt J.B. (1980) Iron alloy<br />
<strong>Fischer</strong>-<strong>Tropsch</strong> catalysts: I: Carburization studies <strong>of</strong> the Fe---Ni<br />
system, J. Catal. 63, 404-414.<br />
72 Chernavskii P.A., Pankina G.V., Lunin V.V. (1996) Carbidizing<br />
<strong>of</strong> iron deposited on SiO2 and Al2O3 in <strong>Fischer</strong>-<strong>Tropsch</strong> synthesis,<br />
Russ. J. Phys. Chem. 70, 1016-1021.<br />
73 Chernavskii P.A., Lunin V.V. (1996) Kinetics <strong>of</strong> Iron Carbide<br />
Formation in Hydrogenation <strong>of</strong> CO over a Potassium-promoted<br />
Fe/SiO2 Catalyst, Kinetics Catal. 37, 850-854.<br />
74 Chernavskii P.A. (1997) The carburization kinetics <strong>of</strong> iron-based<br />
<strong>Fischer</strong>-<strong>Tropsch</strong> synthesis catalysts, Catal. Lett. 45, 215-219.<br />
75 Ichiyanagi Y., Yamada S. (2005) The size-dependent magnetic<br />
properties <strong>of</strong> Co3O4 nanoparticles, Polyhedron 24, 2813-2816.<br />
76 Romero J., Jiménez J., Del Cerro J. (2004) Calorimetric investigation<br />
on the paramagnetic-antiferromagnetic phase transition in<br />
CoO, J. Magn. Magn. Mater. 280, 257-263.<br />
77 Bedel L., Roger A.C., Estournes C., Kiennemann A. (2003) Co0 from partial reduction <strong>of</strong> La(Co,Fe)O3 perovskites for <strong>Fischer</strong>-<br />
<strong>Tropsch</strong> synthesis, Catal. Today 85, 207-218.<br />
78 Bedel L., Roger A.-C., Rehspringer J.-L., Zimmermann Y.,<br />
Kiennemann A. (2005) La (1-y) Co0.4Fe0.6O3-delta perovskite oxides<br />
as catalysts for <strong>Fischer</strong>-<strong>Tropsch</strong> synthesis, J. Catal. 235, 279-<br />
294.<br />
79 Chernavskii P.A., Khodakov A.Y., Pankina G.V., Girardon J.-S.,<br />
Quinet E. (2006) In situ characterization <strong>of</strong> the genesis <strong>of</strong> cobalt<br />
metal particles in silica-supported <strong>Fischer</strong>-<strong>Tropsch</strong> catalysts<br />
using Foner magnetic method, Appl. Catal. A 306, 108-119.<br />
80 Chernavskii P.A., Lermontov A.S., Pankina G.V., Torbin S.N.,<br />
Lunin V.V. (2002) Effect <strong>of</strong> the ZrO2 pore structure on the<br />
reduction <strong>of</strong> a supported cobalt oxide in catalysts for <strong>Fischer</strong>-<br />
<strong>Tropsch</strong> synthesis, Kinetics Catal. 43, 268-274<br />
81 Chu W., Chernavskii P.A., Gengembre L., Pankina G.A.,<br />
Fongarland P.A., Khodakov A.Y. (2007) Cobalt species in promoted<br />
cobalt alumina-supported <strong>Fischer</strong>-<strong>Tropsch</strong> catalysts, J.<br />
Catal. 252, 215-230.<br />
82 Girardon J.-S., Lermontov A.S., Gengembre L., Chernavskii<br />
P.A., Griboval-Constant A., Khodakov A.Y. (2005) Effect <strong>of</strong><br />
cobalt precursor and pretreatment conditions on the structure and<br />
catalytic performance <strong>of</strong> cobalt silica-supported <strong>Fischer</strong>-<strong>Tropsch</strong><br />
catalysts, J. Catal. 230, 339-352.<br />
83 Girardon J.-S., Constant-Griboval A., Gengembre L.,<br />
Chernavskii P.A., Khodakov A.Y. (2005) Optimization <strong>of</strong> the<br />
pretreatment procedure in the design <strong>of</strong> cobalt silica supported<br />
<strong>Fischer</strong>-<strong>Tropsch</strong> catalysts, Catal. Today 106, 161-165.<br />
84 Kissinger H.E. (1957) Reaction kinetics in differential thermal<br />
analysis, Anal. Chem. 29, 1703-1706.<br />
85 Grandvallet P., Courty Ph., Freund E. (1984) <strong>Characterization</strong><br />
and catalytic properties <strong>of</strong> copper-cobalt-aluminium-zinc mixed<br />
phases for higher alcohol synthesis, Proc. <strong>of</strong> the 8th Int. Cong.<br />
on Catal., Springer Verlag, Berlin, II, pp. 81-92.<br />
86 Courty Ph., Chaumette P., Raimbault C., Travers Ph. (1990)<br />
Production <strong>of</strong> methanol-higher alcohol mixtures from natural gas<br />
via syngas chemistry, Revue I.F.P. 45, 4, 561-578.<br />
87 Dalmon J.-A., Chaumette P., Mirodatos C. (1992) Higher alcohols<br />
synthesis on cobalt based model catalysts, Catal. Today 15,<br />
101-127.<br />
88 van de Loosdrecht J., Balzhinimaev B., Dalmon J.-A.,<br />
Niemantsverdriet J.W., Tsybulya S.V., Saib A.M., van Berge<br />
P.J., Visagie J.L. (2007) Cobalt <strong>Fischer</strong>-<strong>Tropsch</strong> synthesis:<br />
Deactivation by oxidation? Catal. Today 123, 293-302.<br />
89 Bremaud M., Fongarland P., Anfray J., Jallais S., Schweich D.,<br />
Khodakov A.Y. (2005) Influence <strong>of</strong> syngas composition on the<br />
transient behavior <strong>of</strong> a <strong>Fischer</strong>-<strong>Tropsch</strong> continuous slurry reactor,<br />
Catal. Today 106, 137-142.<br />
90 van Steen E., Clayes M., Dry M.E., van de Loosdrecht J.,<br />
Vilkoen E.L., Visagie J.L. (2005) Stability <strong>of</strong> nanocrystals:<br />
Thermodynamic analysis <strong>of</strong> oxidation and re-reduction <strong>of</strong> cobalt<br />
in water/hydrogen mixtures, J. Phys. Chem. B 109, 3575-3677.<br />
91 Hauffe K. (1963) Reactions in solids and at their surface,<br />
Russian translation, Moscow, IL, Vol. 2, p. 275.
48<br />
Oil & Gas Science and Technology – Rev. IFP, Vol. 64 (2009), No. 1<br />
92 Cabrera N., Mott N.F. (1948) The theory <strong>of</strong> the oxidation <strong>of</strong><br />
metals, Rep. Prog. Phys. 12, 163-184.<br />
93 Barbier A., Tuel A., Arcon I., Kodre A., Martin G.A. (2001)<br />
<strong>Characterization</strong> and catalytic behavior <strong>of</strong> Co/SiO2 catalysts:<br />
Influence <strong>of</strong> dispersion in the <strong>Fischer</strong>-<strong>Tropsch</strong> reaction, J.<br />
Catal. 200, 106-116.<br />
94 Barbier A., Hanif A., Dalmon J.-A., Martin G.A. (1998)<br />
Preparation and characterization <strong>of</strong> well-dispersed and stable<br />
Co/SiO2 catalysts using the ammonia method, Appl. Catal. A-<br />
Gen. 168, 333-343.<br />
95 Martin G.A., Dalmon J.-A., Mirodatos C. (1984) Particle sizesensitivity<br />
in catalysis by nickel: a statistical approach based<br />
on the combined effect <strong>of</strong> surface coverage and active dimension<br />
site, Proc. 8th Int. Cong. Catal., Berlin 1984, Dechema,<br />
IV, pp. 371-380.<br />
96 Chu W., Wang L.-N., Chernavskii P.A., Khodakov A.Y.<br />
(2008) Glow discharge plasma assisted design <strong>of</strong> cobalt catalysts<br />
for <strong>Fischer</strong> <strong>Tropsch</strong> synthesis, Angew. Chem. Int. Edit.<br />
47, 5052-5055.<br />
97 Zhang Y., Chu W., Cao W., Luo C., Wen X., Zhou K. (2000)<br />
A plasma-activated Ni/alpha-Al2O3 catalyst for the conversion<br />
<strong>of</strong> CH4 to syngas, Plasma Chem. Plasma P. 20, 137-144.<br />
99 Baker J.E., Burch R., Hibble S.J., Loader P.K. (1990)<br />
Properties <strong>of</strong> silica-supported Cu-Co bimetallic catalysts in the<br />
synthesis <strong>of</strong> higher alcohols, Appl. Catal. 65, 281-292.<br />
100 Khodakov A., Griboval-Constant A., Bechara R., Villain F.<br />
(2001) Pore-size control <strong>of</strong> cobalt dispersion and reducibility<br />
in mesoporous silicas, J. Phys. Chem. B 105, 9805-9811.<br />
101 Khodakov A., Lynch J., Bazin D., Rebours B. Zanier N.<br />
Moisson B., Chaumette P. (1997) Reducibility <strong>of</strong> cobalt<br />
species in silica-supported <strong>Fischer</strong>-<strong>Tropsch</strong> catalysts, J. Catal.<br />
168, 16-25.<br />
102 Sewell G.S., van Steen E., O’Connor C.T. (1996) Use <strong>of</strong><br />
TPR/TPO for characterization <strong>of</strong> supported cobalt catalysts,<br />
Catal. Lett. 37, 255-260.<br />
103 Pichon C., Lynch J. (2005) Synchrotron radiation and oil<br />
industry research, Oil Gas Sci. Technol. 60, 735-746.<br />
104 Newton M.A., Dent A.J., Fiddy S.G., Jyoti B., Evans J. (2007)<br />
Combining diffuse reflectance infrared spectroscopy<br />
(DRIFTS), dispersive EXAFS, and mass spectrometry with<br />
high time resolution: Potential, limitations, and application to<br />
the study <strong>of</strong> NO interaction with supported Rh catalysts,<br />
Catal. Today 126, 1-2, 64-72; Frahm R. (1988) Quick scanning<br />
EXAFS: First experiments, Nucl. Instrum. Meth. A 270,<br />
2-3, 578-581.<br />
105 Williamson G.K., Hall W.H. (1953) X-ray line broadening<br />
from filed aluminium and wolfram, Acta Metal. 1, 22-31.<br />
106 Lynch J. (2002) Development <strong>of</strong> Structural Characterisation<br />
Tools for <strong>Catalysts</strong>, Oil Gas Sci. Technol. 57, 281-305.<br />
107 Pan M., Cowley J.M., Chan I.Y. (1990) HREM imaging <strong>of</strong><br />
small Pt clusters dispersed in Y-zeolites, Catal. Lett. 5, 1-11.<br />
108 Kerkh<strong>of</strong> F.P.J., Moulijn J.A. (1979) Quantitative analysis <strong>of</strong><br />
XPS intensities for supported catalysts, J. Phys. Chem. 83,<br />
1612-1619.<br />
109 Kuipers H.P.C.E., Van Leuven H.C.E., Visser W.M. (1986)<br />
The characterization <strong>of</strong> heterogeneous catalysts by XPS based<br />
on geometrical probability. 1. Monometallic catalysts, Surf.<br />
Interface Anal. 8, 235-242.<br />
110 Somorjai G.A. (1994) Introduction to Surface Chemistry and<br />
Catalysis, Willey, New York.<br />
111 Benfield R. (1992) Mean coordination numbers and the nonmetal<br />
metal transition in clusters, J. Chem. Soc. Faraday<br />
Trans. 88, 8, 1107-1110.<br />
112 Chu W., Chernavskii P.A., Gengembre L., Pankina G.A.,<br />
Fongarland P., Khodakov A.Y. (2007) Cobalt Species in<br />
Promoted Cobalt Alumina-Supported <strong>Fischer</strong>-<strong>Tropsch</strong><br />
<strong>Catalysts</strong>, J. Catal. 252, 215-230<br />
Final manuscript received in September 2008<br />
Published online in February 2009<br />
Copyright © 2009 Institut français du pétrole<br />
Permission to make digital or hard copies <strong>of</strong> part or all <strong>of</strong> this work for personal or classroom use is granted without fee provided that copies are not made<br />
or distributed for pr<strong>of</strong>it or commercial advantage and that copies bear this notice and the full citation on the first page. Copyrights for components <strong>of</strong> this<br />
work owned by others than IFP must be honored. Abstracting with credit is permitted. To copy otherwise, to republish, to post on servers, or to redistribute<br />
to lists, requires prior specific permission and/or a fee: Request permission from Documentation, Institut français du pétrole, fax. +33 1 47 52 70 78,<br />
or revueogst@ifp.fr.