81292 AMGEN BUSH TUCKER ART, page 1-40 @ PDFReady
81292 AMGEN BUSH TUCKER ART, page 1-40 @ PDFReady
81292 AMGEN BUSH TUCKER ART, page 1-40 @ PDFReady

You also want an ePaper? Increase the reach of your titles
YUMPU automatically turns print PDFs into web optimized ePapers that Google loves.
Bush Tucker<br />
in Kidney Failure and Diabetes<br />
Lesley Salem Nephrology Nurse Practitioner<br />
Hunter New England Health<br />
Elizabeth Thompson Research Assistant<br />
Herbert Leslie Elvin Artist<br />
This book has been supported by an<br />
unrestricted educational grant from <strong>AMGEN</strong>
Contents<br />
ACKNOWLEDGMENTS 4<br />
FOREWORD 4<br />
INTRODUCTION 5<br />
HOW TO USE THE FOOD TABLES 9<br />
DIETITIAN RECOMMENDATIONS 10<br />
ANIMAL FOODS 12<br />
INSECT AND INSECT PRODUCTS 17<br />
FRUIT 19<br />
VEGETABLES 28<br />
INDEX 38
ACKNOWLEDGMENTS<br />
Miller, J.B., James, J.K. & Maggiore, P.M.A. 1993, Tables of Composition<br />
of Australian Aboriginal Foods. Aboriginal Studies Press, Canberra.<br />
<strong>AMGEN</strong><br />
Herbert Leslie Elvin for the wonderful artwork throughout the publication.<br />
Barbara Harvie. Nephrology Nurse Practitioner Greater Southern Area<br />
Health Service.<br />
Jenny Blissett for her help with editing.<br />
The Nephrology Department at John Hunter Hospital.<br />
FOREWORD<br />
This book has been put together for people with chronic kidney<br />
disease who wish to eat Indigenous foods.<br />
It is designed to assist you and the dietician to make choices of<br />
Indigenous food.<br />
This is a selection of the more common foods eaten. For the<br />
composition of other foods, a more complete reference is available<br />
in “Tables of Composition of Australian Aboriginal Foods” by<br />
Janette Brand Miller, Keith W. James and Patricia M A Maggiore<br />
Available through Aboriginal Studies Press<br />
GPO Box 553,<br />
Canberra ACT 2601<br />
www.aiatsis.gov.au/aboriginal studies press aboriginal<br />
4
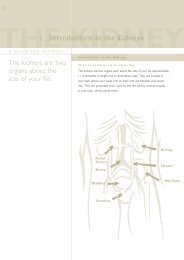
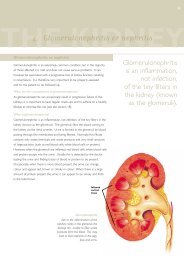
INTRODUCTION<br />
About Kidney failure and the need for a ‘Kidney diet’<br />
A ‘kidney diet’ may help to slow down kidney damage and help to keep you<br />
well. In later stages of kidney damage, the diet may also help you control the<br />
amount of waste products in your blood and body. If these waste products<br />
build up to very high levels, they may cause nausea, vomiting, hiccups,<br />
tiredness, weakness, sleepiness and other problems.<br />
Your diet is determined from the blood tests that you have. They tell us<br />
about how well your kidney is working and what your diet needs to control.<br />
The controlled amounts of each of these nutrients are based on the blood<br />
levels of potassium, sodium, protein and urea.<br />
Kidney Failure and your diet<br />
If you have kidney failure you need a special diet to keep you healthy.<br />
Your kidneys remove waste products and excess fluid that come from your<br />
diet and what you drink. When they fail, there are stages the kidneys go<br />
through and with each of these stages your diet needs to change also. A<br />
special diet can slow the rate of kidney failure and limit the build up of waste<br />
products and fluid in your body.<br />
In kidney failure we are mainly concerned about salt (sodium), phosphate,<br />
protein, potassium, and calories.<br />
Your Nephrologist or GP will refer you to a Dietician. It is important that you<br />
let the dietician know what types of food you like. You will still be able to<br />
have them but the dietician will let you know how much and how often so<br />
that you keep well.<br />
5
Protein<br />
You need protein for building muscles and repairing itself.<br />
Excess protein turns into urea, which the kidney normally gets rid of. In<br />
kidney failure this waste product builds up and can affect all parts of your<br />
body and blood.<br />
To avoid a lot of this waste in your body you need to eat less protein. Eating<br />
less protein has been shown to lessen the stress on the kidney and slow<br />
down the rate at which it is failing.<br />
Protein is found in two types of foods:<br />
● Animal sources- meat, bird, seafood, milk have large amounts<br />
● Plant sources- breads, grains, vegetables and fruits have smaller<br />
amounts<br />
Even though you have to limit protein in your diet it is essential that you still<br />
eat the right amount of protein to keep well.<br />
If you are on peritoneal dialysis, you will need to increase the amount of<br />
protein you eat because dialysis removes some protein from your system.<br />
In the later stages of kidney failure, a low-protein diet can lead to<br />
malnutrition and should only be implemented under the guidance of a kidney<br />
specialist.<br />
Phosphorus<br />
A good level of phosphorus is necessary for the good health of your bones.<br />
In kidney failure your kidney cannot get rid of all the phosphate that is in<br />
food.<br />
Too much phosphate causes your bones to weaken. If this happens they<br />
can ache and possibly break easily.<br />
To help prevent this, it would be good to have a diet of foods low in<br />
phosphate but if diet alone does not work medication will also have to be<br />
used. The phosphate level is listed in the tables and your dietician will give<br />
you a daily allowance.<br />
6
High phosphorus levels are found in the following foods:<br />
● Milk<br />
● Nuts<br />
● Beer and cola drinks<br />
Sodium (salt)<br />
Sodium helps to regulate your blood pressure and the amount of fluid you<br />
retain in your body. In kidney failure where your kidney does not get rid of<br />
excess sodium high blood pressure and fluid retention occur.<br />
To prevent these problems you may need to limit the amount of sodium in<br />
your diet.<br />
Sodium is found in many foods<br />
● Table salt<br />
● Snack foods, processed cheese, some canned foods, “fast foods”, ham,<br />
bacon and luncheon meats<br />
Substitutes for salt can include spices, lemon or pepper.<br />
Potassium<br />
Potassium helps your heart and muscles function properly. The amount you<br />
need varies, depending on your body size, how well your kidney works and<br />
the tablets you take. In the early stages of kidney failure this does not have<br />
to be restricted.<br />
Potassium is found in many foods.<br />
● Foods high in potassium include fruits, vegetables, breads, cereals,<br />
starches<br />
You can reduce the potassium in some food before you eat it. For example<br />
you can: cut peeled potatoes into small pieces, soak them for at least two<br />
hours in a large amount of warm water, drain, and then cook.<br />
7
Calories<br />
The calories in food are what give you energy. Because you are restricted in<br />
the amount of protein you eat, you need to increase other foods to get<br />
enough calories.<br />
With all the restrictions in the type and quantity of foods you can consume it<br />
is important to work with your dietician to formulate a balanced diet. Losing<br />
too much weight can cause you to be ill. Your weight should be monitored<br />
regularly.<br />
If you are diabetic or overweight, talk with your renal dietician about the best<br />
way for you to loose weight.<br />
Your new diet may have more fats and carbohydrates (starches and sweets)<br />
than you are used to eating. These are added to help maintain weight and<br />
protect your muscle tissue. However this does not mean that the Australian<br />
native foods that you would like to eat cannot be included in your ‘kidney<br />
diet’.<br />
Fluids<br />
It is only in the later stages of kidney failure when the fluid you drink is<br />
retained in your body. Drinking fluid is only restricted when you accumulate<br />
excessive amounts in your body.<br />
Vitamins<br />
Whether you need extra vitamins depends on your various dietary<br />
restrictions and how much kidney damage there is. A good diet gives you<br />
enough vitamins A, E, and K. You may need to supplement your diet with<br />
vitamins B and C when you start dialysis.<br />
8
HOW TO USE THE FOOD TABLES<br />
There are some symbols in the tables that you need to understand.<br />
BDL (below detectable limit) indicates that a trace amount of the<br />
component is present. It is not considered to be of dietetic<br />
significance.<br />
ND<br />
(not determined) means that no value is available for this component.<br />
* indicates that the value in the carbohydrate column was derived by<br />
direct measurement, rather than calculated by difference.<br />
(T)<br />
indicates that the average total carbohydrate content (that is including<br />
fibre) of the food has been calculated.<br />
N/A indicates that data was not available<br />
The tables are put together in four sections.<br />
Table 1: Animals<br />
Table 2: Insects and Insect Products<br />
Table 3: Fruits<br />
Table 4: Vegetables<br />
Tables 1,2 and 3 have been put together linking the Common Names in<br />
groups according to type. For example, all kangaroos are together and all<br />
reptiles are together rather than listing by their scientific names. Table 4 has<br />
been put together using the ‘part’ to link the groups together. For example,<br />
all seeds are together, all tubers are together etc. This also means that the<br />
scientific names are not in alphabetical order.<br />
A column under the heading ‘Local Name’ is for the patient’s use, this is to<br />
cater for local knowledge of plant and animal names in the patients own<br />
area.<br />
9
Dietician Recommendations<br />
DATE<br />
RECOMMENDATIONS<br />
10
DATE<br />
RECOMMENDATIONS<br />
11
Animal Foods
Animal Foods<br />
Buffalo, Walleroo, Kangaroo, Possum, Goose<br />
Proximate constituents per 100g edible portion, raw unless otherwise indicated.<br />
Taxonomic Common Local Part Energy Water Protein Fat Carbs Na K Ca Fe P<br />
Name Name Name kj g g g g mg mg mg mg mg<br />
Bubalus Feral Flesh 641 69.7 21.0 4.4 7.6 358 121 5 4.0 ND<br />
bubalis Water cooked,<br />
Buffalo<br />
salted<br />
Macropus Antilopine Flesh 661 63.8 25.3 3.7 5.9 26 215 9 6.8 ND<br />
antilopinus Walleroo<br />
average<br />
Macropus Antilopine Heart 546 71.0 21.9 3.7 2.3 70 191 16 10.1 ND<br />
antilopinus Walleroo<br />
average<br />
Macropus Antilopine Liver 769 61.9 25.4 6.4 6.4 92 248 12 10.5 ND<br />
antilopinus Walleroo<br />
average<br />
Macropus Common Flesh 374 77.8 19.5 0.4 1.7 170 560 10 12.7 1<strong>40</strong><br />
robustus Walleroo<br />
Macropus Kangaroo Flesh ND 73.2 24.2 2.3 ND 63 364 3 6.0 ND<br />
sp. average<br />
Macropus Kangaroo Heart ND 76.7 18.8 3.5 ND 90 270 5 4.5 ND<br />
sp.<br />
Macropus Kangaroo Liver 664 66.4 24.4 5.9 2.0 79 268 4 4.4 ND<br />
sp. average<br />
Macropus Kangaroo Kidney ND 74.2 19.8 5.6 ND 243 220 10 12.1 ND<br />
sp.<br />
Trichosurus Northern Flesh, 701 61.3 33.6 3.5 BDL 147 495 25 10.3 ND<br />
arnhemensis Brushtail<br />
cooked<br />
Possum<br />
Trichosurus Northern Liver, 704 64.7 26.5 6.8 0.1 192 325 25 10.2 ND<br />
arnhemensis Brushtail<br />
cooked<br />
Possum<br />
Trichosurus Northern Kidney, 713 62.2 28.7 5.7 0.9 212 319 132 2.0 ND<br />
arnhemensis Brushtail<br />
cooked<br />
Possum<br />
Anseranus Magpie Flesh of 614 68.5 24.2 4.6 2.0 90 660 7 3.5 390<br />
semipalmata Goose<br />
bird<br />
Anseranus Magpie Liver 718 56.7 22.1 2.9 14.7 130 500 80 35.3 4<strong>40</strong><br />
semipalmata Goose<br />
Anseranus Magpie Egg 877 69.7 10.1 18.4 1.5 129 109 51 3.3 260<br />
semipalmata Goose<br />
average<br />
Source: Miller, J.B., James, J.K. & Maggiore, P.M.A. 1993,<br />
Tables of Composition of Australian Aboriginal Foods. Aboriginal Studies Press, Canberra.<br />
13
Animal Foods<br />
Proximate constituents per 100g edible portion, raw unless otherwise indicated<br />
Taxonomic Common Local Part Energy Water Protein Fat Carbs Na K Ca Fe P<br />
Name Name Name kj g g g g mg mg mg mg mg<br />
Ardeotis Australian Bird ND 69.4 24.2 0.4 ND 88 410 20 17.8 17<br />
australis Bustard<br />
Bush Turkey, 763 60.4 29.1 6.6 1.5 355 248 34 ND ND<br />
Turkey<br />
cooked<br />
Acanthopleura Spiny Flesh 588 61.5 19.2 3.4 8.5 630 152 500 214.0 ND<br />
spinosa Chiton<br />
Acrochordus File Flesh 454 74.7 16.1 3.7 2.7 1<strong>40</strong> 178 478 6.7 ND<br />
sp. average Snake<br />
Amphibolurus Dragon Flesh 785 60.6 30.2 7.2 0.4 142 179 111 12.0 ND<br />
sp. average Lizard & skin,<br />
cooked<br />
Amphibolurus Dragon Liver 1070 56.4 11.8 18.7 11.1 11 228 52 23.0 ND<br />
sp. Lizard<br />
Amphibolurus Dragon Fat 2568 16.7 4.0 59.9 17.7 80 84 <strong>40</strong> 25.5 ND<br />
sp. Lizard<br />
Liasis fuscus Water Reptile ND 61.7 33.1 ND ND ND ND ND ND ND<br />
Python<br />
Pseudechis Redbellied Flesh 453 74.0 23.0 1.5 0.4 70 335 31 1.3 ND<br />
porphyriacus Black<br />
snake<br />
Varanus Gould’s Flesh, ND 64.6 32.1 1.6 ND 150 4<strong>40</strong> 20 9.8 260<br />
gouldii goanna, cooked<br />
sand monitor<br />
Varanus sp. Goanna Flesh, 821 56.1 30.5 7.2 2.2 230 257 116 11.2 ND<br />
average<br />
cooked<br />
Varanus sp. Goanna Heart, ND 65.6 25.9 5.6 ND 150 260 102 35.0 ND<br />
cooked<br />
Varanus sp. Goanna Liver, 516 69.9 19.1 5.5 1.2 141 189 219 101.5 ND<br />
average<br />
cooked<br />
Varanus sp. Goanna Fat, 1579 45.5 16.5 33.8 2.9 56 201 63 49.2 ND<br />
average<br />
cooked<br />
Chelodina Northern Flesh 592 67.8 26.8 2.9 1.8 93 280 ND 1.8 ND<br />
rugosa Snake-<br />
Necked<br />
Turtle<br />
Chelodina Northern Liver 924 65.0 11.1 18.1 4.1 109 195 ND ND ND<br />
rugosa Snake-<br />
Necked<br />
Turtle<br />
14<br />
Source: Miller, J.B., James, J.K. & Maggiore, P.M.A. 1993,<br />
Tables of Composition of Australian Aboriginal Foods. Aboriginal Studies Press, Canberra.
Turtle, Oysters, Mussel, Snail, Worm, Mud Crab<br />
Proximate constituents per 100g edible portion, raw unless otherwise indicated<br />
Taxonomic Common Local Part Energy Water Protein Fat Carbs Na K Ca Fe P<br />
Name Name Name kj g g g g mg mg mg mg mg<br />
Chelonia Flatback Flesh, 473 72.4 25.1 0.7 1.2 72 282 2 14.3 1<strong>40</strong><br />
depressa Turtle cooked<br />
average<br />
Cheloni Flatback Heart 553 76.1 20.0 5.6 0.5 99 174 3 6.9 ND<br />
depressa Turtle<br />
average<br />
Chelonia Flatback Fat 1595 51.9 2.9 <strong>40</strong>.0 4.1 58 120 6 1.3 ND<br />
depressa Turtle<br />
Chelonia Flatback Intestine 432 75.6 18.1 2.7 1.5 260 181 122 5.7 ND<br />
depressa Turtle<br />
Chelonia Flatback Egg 5<strong>40</strong> 75.9 11.8 8.7 3.2 127 76 54 1.3 170<br />
depressa Turtle<br />
average<br />
Elseya Northern Flesh 418 76.6 22.3 0.7 0.8 80 310 10 8.5 1<strong>40</strong><br />
dentata Snapping<br />
Turtle<br />
Eretmochelys Hawksbill Egg ND 88.9 5.7 ND 7.6 97 70 <strong>40</strong> 0.5 120<br />
imbricata Turtle<br />
Intada| Black Lip Flesh 496 77.0 8.8 1.5 18.2 590 190 150 4.5 90<br />
margerafida Oysters<br />
Pinctada Black Lip 215 86.8 7.4 1.3 2.54 380 80 50 32.3 93<br />
margaretifera Oyster<br />
Saccostrea Common 478 76.6 6.6 5.3 10.6 110 160 50 1.8 ND<br />
cucullata Milky Oyster<br />
Rock Oysters <strong>40</strong>9 80.2 8.6 5.2 4.4 180 170 160 7.5 ND<br />
Polymesada Mud 511 69.3 13.3 2.0 13.6 438 1<strong>40</strong> 181 107 200<br />
coaxans Mussel<br />
average<br />
Velesunio Freshwater Mussel 303 64.4 5.4 1.4 8.7 53 22 124 16.6 ND<br />
ambiguous Mussel<br />
Velesunio Mussel Cooked 346 79.0 11.6 2.0 4.7 36 27 324 6.0 ND<br />
angasi<br />
Nertia Mangrove 438 75.0 15.9 1.7 7.2 1225 531 528 24.1 BDL<br />
articulate Snail<br />
average<br />
Teredo Mangrove 351 77.1 4.4 0.7 16.4 229 117 153 55.0 ND<br />
sp. Average worm<br />
Scylla serrata Mud Crab ND 72.7 22.4 0.4 ND 250 330 80 3.9 210<br />
Source: Miller, J.B., James, J.K. & Maggiore, P.M.A. 1993,<br />
Tables of Composition of Australian Aboriginal Foods. Aboriginal Studies Press, Canberra.<br />
15
Shellfish, Mud Whelk, Crocodile<br />
Proximate constituents per 100g edible portion, raw unless otherwise indicated<br />
Taxonomic Common Local Part Energy Water Protein Fat Carbs Na K Ca Fe P<br />
Name Name Name kj g g g g mg mg mg mg mg<br />
Scylla sp. Mud Flesh 372 76.9 18.0 1.1 1.7 355 220 90 1.6 ND<br />
average Crab<br />
Scylla sp. Mud Crab Fat 739 64.4 5.6 11.6 13.4 1300 1970 880 7.3 ND<br />
Monodonta Shellfish 337 68.8 14.4 2.5 BDL* 510 320 700 31.0 ND<br />
labio<br />
Cassidula Shellfish Flesh, 319 71.8 13.0 1.3 3.1 83 205 836 5.4 ND<br />
angulifera<br />
cooked<br />
Nerita Shellfish 456 72.0 17.0 2.6 4.5 534 181 287 10.0 ND<br />
lineata<br />
average<br />
Telescopium Shellfish 464 66.9 16.8 1.2 8.5 851 214 802 20.4 ND<br />
telescopium Marine<br />
average<br />
Terebralia Shellfish, 387 71.9 16.9 0.8 4.4 639 224 179 12.0 ND<br />
sulcata Mud Whelk,<br />
Marine<br />
Terebralia sp. Mud Whelk 338 73.5 12.7 0.5 6.5 800 460 430 16.4 66<br />
Fish Fish, 621 66.4 20.0 7.3 0.9 246 269 1<strong>40</strong> ND ND<br />
average<br />
cooked<br />
Dugong Dugong Flesh 524 72.3 24.2 3.1 BDL 48 175 4 2.9 ND<br />
average<br />
Crocody Saltwater Flesh 438 75.5 31.0 2.1 N/A N/A N/A N/A N/A N/A<br />
lusporsus Crocodile cooked<br />
Source: Miller, J.B., James, J.K. & Maggiore, P.M.A. 1993,<br />
Tables of Composition of Australian Aboriginal Foods. Aboriginal Studies Press, Canberra.<br />
16
Insect and Insect Products
Insects and insect products - Moth, Locust, Witchetty Grub, Ant, Lerp<br />
Scale, Bush Coconut average, Sugarbag<br />
Inorganic constituents per 100g edible portion, raw unless otherwise indicated.<br />
Taxonomic Common Local Part Energy Water Protein Fat Carbs Na K Ca Fe P<br />
Name Name Name kj g g g g mg mg mg mg mg<br />
Agrotis infusa Bogong Abdomen 1805 32.5 21.7 38.8 BDL* 26 317 113 7.0 ND<br />
Moth<br />
Agrotis infusa Bogong Wings 870 54.5 30.5 6.9 6.0* 27 300 289 16.1 ND<br />
Moth<br />
Agrotis infusa Bogong Whole 1188 49.1 24.2 20.6 BDL* 23 354 126 8.7 380<br />
average Moth Insect<br />
Chortiocetes Australian Whole 501 67.2 25.0 2.0 0.1 101 239 ND 4.0 ND<br />
terminifera Plague Insect<br />
Locust<br />
Cossidae Witchetty Raw 1027 61.3 16.2 28.6 4.6 12 231 9 3.1 ND<br />
sp. Average Grub<br />
Cossidae Witchetty Cooked 1318 49.7 14.7 25.1 9.5 28 223 119 14.0 ND<br />
sp. Average Grub<br />
Cystococcus Blackwood Gall 570 75.8 5.9 4.8 12.8 32 720 47 2.8 19<br />
sp. Average Apple, Lining<br />
Insect Gall<br />
Melophorus Honeypot Whole ND 32.5 1.5 0.90 ND 14 120 5 2.4 ND<br />
sp. Average Ant Insect<br />
Oecophylla Green Tree Whole 846 65.3 11.0 7.3 21.1 141 620 117 13.9 ND<br />
smaragdina Ant Insect<br />
average<br />
Psylla Lerp Fresh 1324 10.6 0.5 0.1 82.0 56 32 BDL 7.1 ND<br />
eucalypti Scale Scale<br />
Psylla Lerp Old Scale 1432 1.9 6.1 0.7 81.4 1 65 131 7.0 ND<br />
eucalypti Scale from<br />
ground<br />
Psylla Lerp 1332 14.2 1.9 0.6 80.0 49 139 63 7.1 ND<br />
eucalypti Scale<br />
Bush Gall 636 59.1 6.4 0.5 35.2 34 753 97 ND ND<br />
Coconut<br />
average<br />
Snail ND ND 48.9 ND ND 649 504 180 ND ND<br />
Sugarbag 1435 6.8 10.8 3.5 70.1 5 222 56 31.0 ND<br />
Wild Honey<br />
Sugarbag Honey & ND 13.2 5.8 7.7 ND 19 180 62 46.0 ND<br />
Larvae<br />
18<br />
Source: Miller, J.B., James, J.K. & Maggiore, P.M.A. 1993,<br />
Tables of Composition of Australian Aboriginal Foods. Aboriginal Studies Press, Canberra.
Fruits
Fruits Gum, Lillypilly, White Aspen, Wild Ginger, native Cardamon, Grape, Mistletoe,<br />
Cashew Fruit, Cherry<br />
Proximate constituents per 100g edible portion, raw unless otherwise indicated<br />
Taxonomic Common Local Part Energy Water Protein Fat Carbs Na K Ca Fe P<br />
Name Name Name kj g g g g mg mg mg mg mg<br />
Acmena Cassowary Fruit ND 75.9 1.6 0.5 ND 12 139 30 1.5 ND<br />
hemilampra Gum<br />
Acmena Lillypilly Fruit 89 93.4 0.3 0.1 5.0 22 35 8 0.1 ND<br />
smithii<br />
average<br />
Syzygium Scrub Fruit 178 89.1 0.8 0.2 9.8* 14 60 <strong>40</strong> 1.5 ND<br />
australis Cherry,<br />
Greek<br />
Lillypilly<br />
Acronychia White Fruit ND 62.0 0.5 2.8 ND <strong>40</strong> 455 12 2.6 24<br />
acronychioides Aspen<br />
Acronychia Crater Fruit ND 77.8 1.3 1.1 ND 30 200 60 0.4 20<br />
crassipetala Aspen<br />
Alpinia Wild Fruit 1162 64.9 2.2 2.5 57.6 3 250 120 0.2 63<br />
caerulea Ginger<br />
average<br />
Costa sp. Green Fruit 696 55.6 3.8 0.8 37.6 25 617 97 ND ND<br />
Ginger<br />
Hornnstedtia Red Ginger, Green 912 42.0 4.0 0.7 51.1 18 243 47 ND ND<br />
sp. native Pod<br />
Cardamon<br />
Cissus Native Fruit 243 83.7 0.4 0.9 12.7* 12 268 100 3.4 ND<br />
hypoglauca Grape<br />
Wild Grape Fruit 213 84.7 0.8 0.1 12.2 16 225 95 0.5 37<br />
average<br />
Amyema sp. Mistletoe Fruit ND 74.3 2.2 3.6 Nd 2 250 14 0.3 ND<br />
Anacardium Cashew Fruit 213 84.7 0.8 0.1 12.2 18 43 32 1.0 ND<br />
occidentale Fruit<br />
Cashew Fruit 226 86.9 1.2 0.6 11.4 39 44 13 ND ND<br />
Fruit<br />
Average<br />
Antidesma Wild Cherry Fruit 281 81.7 0.7 0 16.8 29 137 29 ND ND<br />
bunis<br />
Eugenia Cedar Bay Fruit 309 70.8 1.9 0.3 16.6 14 350 50 1.1 ND<br />
reinwardtiana Cherry<br />
Exocarpus Native Fruit 286 71.1 2.4 0.4 14.4 66 490 23 1.4 ND<br />
latifolius Cherry<br />
20<br />
Source: Miller, J.B., James, J.K. & Maggiore, P.M.A. 1993,<br />
Tables of Composition of Australian Aboriginal Foods. Aboriginal Studies Press, Canberra.
Fruits Current Tree, Asian Breadfruit<br />
Proximate constituents per 100g edible portion, raw unless otherwise indicated.<br />
Taxonomic Common Local Part Energy Water Protein Fat Carbs Na K Ca Fe P<br />
Name Name Name kj g g g g mg mg mg mg mg<br />
Rhyncharrhena Native Fruit 191 85.8 1.1 0.5 9.7 2 192 21 0.4 ND<br />
linearis Cherry<br />
Syzygium Brush Fruit 89 93.4 0.3 0.1 5.0 3 18 4 0.1 ND<br />
paniculatum Cherry,<br />
Scrub<br />
Cherry<br />
Antidisma Currant Fruit 450 71.9 1.4 0.8 26.7 42 469 35 2.5 44<br />
ghaesembilla Tree (T)<br />
average<br />
Canthium Currant Fruit 834 41.6 2.8 0.1 48.9 6 420 61 11.2 ND<br />
latifolium Bush<br />
Artocarpus Asian Fruit 506 74.4 0.9 0.3 30.0* 21 161 19 0.4 ND<br />
altilis, mix Breadfruit<br />
Austromyrtus Midjin Fruit 386 75.8 0.9 0.3 22.5* 70 1<strong>40</strong> 50 5.1 ND<br />
dulcis<br />
Billardiera Apple- Fruit 319 66.7 1.1 2.2 13.7* 22 469 11 7.7 ND<br />
scandens berry<br />
Buchanania Green Fruit 318 77.8 1.5 0.5 21.1 6 299 67 1.7 ND<br />
abovata Plum (T)<br />
average<br />
Davidsonia Davidson Fruit 72 90.6 0.4 0.9 8.7 2 150 12.1 1.2 ND<br />
pruriens Plum (T)<br />
average<br />
Manilkara Wongi Fruit 642 58.9 1.2 1.9 34.8 113 472 119 1.4 35<br />
kauki average Plum<br />
Parinari nonda Nonda Fruit & 222 78.3 1.0 0.9 20.0 290 383 91 1.5 12<br />
average Plum Juice (T)<br />
Planchonella Black Fruit 213 74.7 2.2 0.5 19.0 5 252 34 1.0 ND<br />
australis Apple, (T)<br />
average Wild Plum<br />
Planchonella Wild Fruit 314 67.6 0.7 0.2 18.4 3 617 14 ND ND<br />
pohlmaniana Plum<br />
Pleiogynium Burdekin Fruit 298 72.7 1.3 1.3 25.0 47 458 241 0.9 ND<br />
timorense Plum (T)<br />
average<br />
Santalum Bush Fruit 636 63.2 3.3 4.4 25.7 6 800 41 1.9 91<br />
lanceolatum Plum (T)<br />
average<br />
Source: Miller, J.B., James, J.K. & Maggiore, P.M.A. 1993,<br />
Tables of Composition of Australian Aboriginal Foods. Aboriginal Studies Press, Canberra.<br />
21
Fruits<br />
Lawyer Vine, Awalyuru, Orange, Finger Lime, Native Caper, Conkerberry, Berry<br />
Proximate constituents per 100g edible portion, raw unless otherwise indicated<br />
Taxonomic Common Local Part Energy Water Protein Fat Carbs Na K Ca Fe P<br />
Name Name Name kj g g g g mg mg mg mg mg<br />
Terminalia Billy Fruit 247 76.2 0.8 0.5 17.2(T) 13 261 62 2.4 24<br />
ferdinandiana Goat<br />
average Plum<br />
Ximenia Yellow Fruit 210 78.6 2.7 0.9 8.2 14 570 4 0.7 ND<br />
Americana Plum<br />
Bush Fruit 331 77.6 1.5 1.0 16.8* 9 223 79 ND ND<br />
Plum<br />
Calamus Lawyer Fruit 447 70.3 1.6 0.1 26.0 26 349 72 ND ND<br />
moti average Vine<br />
Canthium Awalyuru Fruit 1195 23.8 5.4 0.4 68 23 591 85 ND ND<br />
lineare<br />
Capparis Wild Fruit 500 63.1 5.8 1.3 27.9 7 424 46 0.7 ND<br />
mitchellii Orange (T)<br />
average<br />
Microcitrus Finger Fruit 411 65.5 2.5 4.9 11.7* 9 290 50 0.8 ND<br />
australasica Lime<br />
var.australis<br />
Microcitrus Finger Fruit ND 76.7 ND 1.7 8.7* 3 200 <strong>40</strong> 0.6 ND<br />
australasica Lime<br />
var. sanguinus<br />
Microcitrus Finger Fruit 277 74.8 2.2 BDL 15.0 4 270 46 0.5 ND<br />
australis Lime<br />
Bush Citrus Fruit 119 87.9 1.3 0.4 5.1 1 176 49 0.2 ND<br />
Capparis Native Fruit 379 79.6 4.6 3.6 10.5* 18 383 28 0.9 ND<br />
spinosa Caper<br />
Capparis Native Fruit 486 73.1 3.0 3.2 25.8 17 875 68 2.0 170<br />
spinosa var. Caper<br />
nummularia<br />
average<br />
Capparis Native Fruit 619 51.5 8.8 1.8 25.2 1 580 75 0.8 ND<br />
umbonata Caper<br />
Carissa Conkerberry Fruit 545 65.5 2.4 2.3 30.6 8 328 55 2.8 ND<br />
lanceolata<br />
(T)<br />
average<br />
Grewia Emu Berry Fruit 839 44.3 3.0 0.2 48.8 34 626 704 ND ND<br />
breviflora<br />
Grewia Emu Berry Fruit ND 59.8 1.0 ND 34.6 6 380 120 1.22 53<br />
latifolia<br />
22<br />
Source: Miller, J.B., James, J.K. & Maggiore, P.M.A. 1993,<br />
Tables of Composition of Australian Aboriginal Foods. Aboriginal Studies Press, Canberra.
Fruits<br />
Proximate constituents per 100g edible portion, raw unless otherwise indicated.<br />
Taxonomic Common Local Part Energy Water Protein Fat Carbs Na K Ca Fe P<br />
Name Name Name kj g g g g mg mg mg mg mg<br />
Grewia Emu Fruit 458 61.0 1.5 0.1 30.6 29 145 212 17.9 36<br />
multiflora Berry (T)<br />
average<br />
Grewia Emu Fruit 799 33.1 3.8 0.8 52.7 27 883 411 5.9 120<br />
retusifolia Berry (T)<br />
average<br />
Physalis Native Fruit 264 84.2 3.2 0.3 14.0 5 109 <strong>40</strong> 4.2 120<br />
minima Gooseberry<br />
average<br />
Rubus Wild Fruit ND 82.9 1.3 0.3 ND BDL <strong>40</strong>8 50 BDL 32<br />
rosifolius Raspberry<br />
average<br />
Sambucus Yellow Fruit 380 81.7 2.3 2.3 16.0* 13 330 70 6.0 ND<br />
australasica Elderberry<br />
Blackberry Fruit ND 69.7 1.4 ND 28.0 23 156 44 ND ND<br />
Blackberry Fruit 345 78.8 0.9 0.7 19.0 32 81 13 ND ND<br />
Cassytha sp Dodder Fruit ND 86.9 ND ND ND ND ND ND ND ND<br />
Laurel<br />
Carpobrotus Pigface Fruit 213 75.2 2.4 0.9 19.8 231 207 173 2.7 ND<br />
modestus<br />
(T)<br />
average<br />
Cucumis. Melo Native Fruit 149 87.0 1.7 1.2 9.0 14 389 30 1.3 ND<br />
ssp. Agrestis Cucumber (T)<br />
average<br />
Dendrocnide Stinging Fruit ND 71.9 2.3 5.2 ND 8 636 <strong>40</strong>0 1.4 46<br />
excelsa Tree<br />
average<br />
Dendrocnide Shiny-Leaf Fruit 114 92.0 1.4 0.4 4.7 14 614 42 ND ND<br />
photinophylla Stinging<br />
Tree<br />
Diospyrus sp. Jurdal Fruit 669 57.4 1.4 0.8 38.5 33 322 81 ND ND<br />
Diploglottis Tamarind Fruit 34 91.1 1.0 0.1 0.8* 5 220 10 0.2 ND<br />
campbellii<br />
Tamarindus Tamarind Fruit ND 19.3 5.6 1.9 ND 30 630 120 1.1 89<br />
indica average<br />
Eleocarpus Blue Fruit 351 72.0 1.3 0.6 19.9 14 1055 <strong>40</strong> 1.3 78<br />
grandis Quondong<br />
average<br />
Source: Miller, J.B., James, J.K. & Maggiore, P.M.A. 1993,<br />
Tables of Composition of Australian Aboriginal Foods. Aboriginal Studies Press, Canberra.<br />
23
Fruits<br />
Proximate constituents per 100g edible portion, raw unless otherwise indicated.<br />
Taxonomic Common Local Part Energy Water Protein Fat Carbs Na K Ca Fe P<br />
Name Name Name kj g g g g mg mg mg mg mg<br />
Eleocharis Water Chestnut 1<strong>40</strong>7 9.8 5.9 0.7 81.4 2276 460 77 ND ND<br />
dulcis Chestnut<br />
average<br />
Enchylaena Ruby Fruit ND 65.1 5.7 0.4 ND 210 420 80 3.8 ND<br />
tomentosa Saltbush<br />
Eugenia Dabugay Fruit 197 88.3 0.4 0.9 9.8 17 197 66 ND ND<br />
wilsonii<br />
Eupomatia Native Fruit 345 82.1 1.0 3.9 15.0 17 426 56 0.7 28<br />
laurina Guava (T)<br />
average<br />
Ficus Sandpaper Fruit ND 67.5 0.4 ND ND 16 704 115 ND ND<br />
coronata Fig<br />
Ficus Sandpaper Fruit 548 72.1 4.0 0.8 29.1 74 989 177 0.1 35<br />
opposita Fig<br />
Ficus Wild Fig Fruit 569 66.3 3.0 2.1 36.3 56 532 120 2.7 23<br />
platypoda<br />
(T)<br />
average<br />
Wild Fig Fruit 707 55.5 1.8 1.2 39.5 25 336 69 ND ND<br />
Ficus Cluster Fig Fruit 351 81.9 1.3 0.6 20.0 23 508 72 1.3 47<br />
racemosa<br />
average<br />
Ficus Fig Fruit 380 71.0 0.7 1.5 31.3 890 913 228 0.8 ND<br />
watkinsiana<br />
(T)<br />
average<br />
Fluggea Ragah Fruit 476 75.9 1.4 2.5 25.8 14 228 77 8.9 <strong>40</strong><br />
virosa<br />
(T)<br />
average<br />
Hibiscus Native Carpels ND 86.7 1.4 0.3 ND 4 150 94 1.8 ND<br />
heterophyllus Rosella<br />
Leichhardtia Bush Green 310 76.8 4.2 0.8 15.9 13 398 26 1.6 31<br />
australis Banana Pod (T)<br />
average<br />
Musa Native Fruit ND 75.7 1.7 0.8 ND 3 290 30 0.9 ND<br />
acuminata Banana<br />
Linospadix Walking Fruit 115 90.5 0.3 0.3 6.2 5 90 20 0.3 ND<br />
monostachyus Stick Palm<br />
Nypa Nypa Fruit ND 88.9 1.6 0.1 ND 63 980 37 0.4 ND<br />
fruiticans Palm<br />
24<br />
Source: Miller, J.B., James, J.K. & Maggiore, P.M.A. 1993,<br />
Tables of Composition of Australian Aboriginal Foods. Aboriginal Studies Press, Canberra.
Fruits<br />
Proximate constituents per 100g edible portion, raw unless otherwise indicated.<br />
Taxonomic Common Local Part Energy Water Protein Fat Carbs Na K Ca Fe P<br />
Name Name Name kj g g g g mg mg mg mg mg<br />
Mimusops Tanjong Fruit 825 46.6 2.9 BDL 49.0 172 499 139 ND ND<br />
elengi Tree<br />
average<br />
Morinda Great Fruit 160 86.1 0.8 0.3 12.4 30 176 23 1.1 ND<br />
citrifolia Morinda (T)<br />
average Cheese Fruit<br />
Nauclea Leichhardt Fruit ND 77.3 0.8 1.0 ND 6 363 105 0.6 47<br />
orientalis Tree<br />
average<br />
Opuntia Prickly Pear Fruit ND 82.9 0.8 0.1 ND 70 320 230 0.4 15<br />
stricta<br />
Pandanus sp Pandanus Fruit 1230 14.4 1.1 0.9 73.7 168 482 172 1.5 ND<br />
Passiflora Bush Fruit 421 64.2 4.9 2.7 24.7 2 491 10 8.4 ND<br />
foetida Passionfruit (T)<br />
average<br />
Persoonia Geebung Fruit 231 66.2 3.2 2.3 26.4 47 505 48 3.6 ND<br />
falcate<br />
(T)<br />
average<br />
Persoonia Geebung Fruit 48 70.0 0.8 1.3 28.5 150 280 24 1.4 ND<br />
pinifolia<br />
(T)<br />
average<br />
Planehonia Cocky Fruit 284 77.1 2.7 1.3 19.9 15 389 27 1.2 ND<br />
careya Apple (T)<br />
average<br />
Syzygium Love Apple Fruit 123 88.6 0.1 0.5 6.4 52 110 30 1.1 ND<br />
eucalyptoides<br />
ssp. Bleeseri<br />
Syzygium Bush Apple Fruit 146 87.7 0.6 0.4 9.4 70 90 30 1.5 8<br />
eucalyptoides<br />
ssp.<br />
Eucalypoides<br />
average<br />
Syzygium Bush Apple Fruit 146 89.3 0.6 0.5 10.9 48 85 67 1.2 ND<br />
suborbiculare<br />
(T)<br />
average<br />
Source: Miller, J.B., James, J.K. & Maggiore, P.M.A. 1993,<br />
Tables of Composition of Australian Aboriginal Foods. Aboriginal Studies Press, Canberra.<br />
25
Fruits<br />
Proximate constituents per 100g edible portion, raw unless otherwise indicated.<br />
Taxonomic Common Local Part Energy Water Protein Fat Carbs Na K Ca Fe P<br />
Name Name Name kj g g g g mg mg mg mg mg<br />
Zizyphus Indian<br />
mauritiana Jujube, Fruit ND 77.0 0.8 2.4 ND 8 489 30 0.4 38<br />
Chinese<br />
Apple<br />
Wild Apple, Fruit 609 62.6 1.7 1.2 33.5 154 325 49 ND ND<br />
Apple Fruit<br />
Syzygium sp. Onion Wood Fruit ND 81.7 0.9 0.2 ND 3 86 56 0.6 ND<br />
Podocarpus Brown Fruit 347 87.3 0.2 0.2 21.0* 5 100 19 0.3 ND<br />
elatus Pine,<br />
She Pine<br />
Pouteria Mongo Fruit ND ND ND ND ND ND ND ND ND ND<br />
sericea<br />
Rosa cania Rose Hips Fruit ND 39.7 2.9 0.6 ND 6 746 188 3.3 80<br />
Santalum Quandong Fruit 335 68.5 2.3 0.2 21.0 62 703 53 1.2 ND<br />
acuminatum<br />
(T)<br />
average<br />
Solanum Bush Fruit 570 61.9 3.8 0.6 31.9 52 448 <strong>40</strong> 2.9 ND<br />
centrale Raisin (T)<br />
average<br />
Fresh Fruit<br />
Solanum Bush Fruit 1174 12.5 8.5 3.8 67.3 95 1918 90 11.0 1<strong>40</strong><br />
centrale Raisin (T)<br />
average<br />
dried fruit<br />
Sosanum Bush Fruit 384 75.1 1.6 0.6 21 56 588 86 1.8 ND<br />
chippendalei Tomato<br />
average<br />
Solanum sp. Bush Tomato Fruit ND 81.1 1.1 ND ND 22 462 85 ND ND<br />
Syzygium Johnson<br />
johnsonii Satin Ash ND 89.9 0.5 1.1 ND 26 98 35 0.4 ND<br />
Syzygium Small-Leafed Fruit 325 82.0 0.9 0.4 18.4* 11 250 100 0.9 ND<br />
luehmannii Watergum,<br />
Cherry<br />
Satin-Ash<br />
Source: Miller, J.B., James, J.K. & Maggiore, P.M.A. 1993,<br />
Tables of Composition of Australian Aboriginal Foods. Aboriginal Studies Press, Canberra.<br />
26
Fruits<br />
Proximate constituents per 100g edible portion, raw unless otherwise indicated.<br />
Taxonomic Common Local Part Energy Water Protein Fat Carbs Na K Ca Fe P<br />
Name Name Name kj g g g g mg mg mg mg mg<br />
Solanum Bush Fruit 202 86.0 2.6 1.8 5.7 ND 355 35 0.4 20<br />
ellipticum Potato<br />
Terminalia Nut Tree Fruit 133 61.5 1.1 0.2 6.7* 2 303 15 8.1 ND<br />
grandiflora<br />
Uvaria sp. Custard Fruit 397 75.3 2.3 0.5 21.2 2 203 37 1.0 ND<br />
Finger<br />
Vigna Malaga Fruit 336 78.3 2.4 0.1 18.2 ND ND ND ND ND<br />
lanceolata Bean<br />
Bija Fruit 780 50.5 2.5 0.2 45.6 30 431 63 ND ND<br />
Crow Fruit Fruit ND 80.3 0.2 ND ND 43 505 123 ND ND<br />
Djinpu Fruit 909 48.3 5.8 4.3 <strong>40</strong>.7 14 248 25 ND ND<br />
Durriaman Fruit 554 65.7 5.5 0.8 26.9 12 399 43 ND ND<br />
Galay Fruit 348 77.4 1.2 0.2 20.0 38 287 78 ND ND<br />
Jaraminy Fruit 361 76.4 0.7 0.3 21.1 21 565 123 ND ND<br />
Kawai Fruit 688 57.2 1.6 1.0 39.0 190 197 47 ND ND<br />
Manyiku Fruit ND 71.4 25 0.6 ND 3 275 72 1.8 45<br />
Silky Pear, Fruit 343 78.3 3.5 0.4 16.8 8 388 49 ND ND<br />
Barrkan<br />
Source: Miller, J.B., James, J.K. & Maggiore, P.M.A. 1993,<br />
Tables of Composition of Australian Aboriginal Foods. Aboriginal Studies Press, Canberra.<br />
27
Vegetables
Vegetables<br />
Proximate constituents per 100g edible portion, raw unless otherwise indicated.<br />
Taxonomic Common Local Part Energy Water Protein Fat Carbs Na K Ca Fe P<br />
Name Name Name kj g g g g mg mg mg mg mg<br />
Acacia aneura Mulga Seed 1593 5.2 25.4 7.6 55.0 64 912 183 14.1 ND<br />
average<br />
Acacia Dogwood, Seed, 627 56.8 23.7 3.3 6.4 3 362 137 3.2 ND<br />
coriacea Wiry Wattle, fresh,<br />
Blackheart<br />
green<br />
Tree<br />
Acacia Dogwood Seed, 1507 8.4 23.1 8.4 49.4 35 564 157 7.7 ND<br />
coriacea De-husked (T)<br />
average<br />
& milled<br />
Acacia Ironwood Seed 1493 10.1 28.9 3.5 54.5 126 104 109 ND ND<br />
estrophiolata<br />
Acacia Prickly Seed 1522 8.1 36.6 3.0 49.3 35 850 190 6.0 ND<br />
farnesiana Moses<br />
Acacia Witchetty Seed 1225 4.5 24.0 10.2 27.5 10 870 213 3.8 ND<br />
kempeana Bush<br />
Acacia ligulata Umbrella Seed 1480 4.3 24.0 9.1 57.7 42 762 194 6.8 ND<br />
average Bush (T)<br />
Acacia Colony Seed 1435 8.1 20.1 5.2 63.7 37 705 141 6.6 ND<br />
murrayana Wattle (T)<br />
average<br />
Acacia Desert Seed 1580 7.1 22.2 8.3 56.0 39 856 176 ND ND<br />
pachycarpa Acacia<br />
Acacia Dead Seed 1931 5.4 17.5 20.4 54.9 8 850 <strong>40</strong>0 28.1 ND<br />
tetragonophylla finish<br />
Acacia Gundabluey Seed 1384 6.9 17.5 3.2 67.5 33 766 243 10.4 ND<br />
victoriae<br />
(T)<br />
average<br />
Brachiaria Summer Seed 1501 9.0 9.1 7.3 67.3 31 190 56 ND ND<br />
milliformis Grass<br />
Brachychiton Northern Seed 249 76.5 2.1 2.2 2.9 2 120 260 2.3 ND<br />
diversifilius Kurrajong<br />
average<br />
Brachychiton Red- Seed 1514 10.4 17.6 5.0 42.7 98 1388 125 10.7 490<br />
paradoxum Flowered<br />
average Kurrajong<br />
Brachychiton Kurrajong Seed 1455 5.6 18.1 24.7 14.6 8 567 110 2.1 ND<br />
populineum<br />
Source: Miller, J.B., James, J.K. & Maggiore, P.M.A. 1993,<br />
Tables of Composition of Australian Aboriginal Foods. Aboriginal Studies Press, Canberra.<br />
29
Vegetables<br />
Proximate constituents per 100g edible portion, raw unless otherwise indicated.<br />
Taxonomic Common Local Part Energy Water Protein Fat Carbs Na K Ca Fe P<br />
Name Name Name kj g g g g mg mg mg mg mg<br />
Calandrinia Parakeelya Seed 1769 5.5 14.7 17.1 55.4 23 86 86 ND ND<br />
balonensis<br />
Dysphania Rats Tails Seed 1672 7.8 15.2 2.3 70.6 8 3<strong>40</strong> 263 ND ND<br />
kalpari<br />
average<br />
Eragrostis Woolybutt Seed 1331 8.5 16.2 1.6 65.3 22 186 118 31.0 ND<br />
eriopoda Grass (T)<br />
average<br />
Eucalpytus Blue Seed 1776 7.7 25.9 19.5 38.4 35 81 505 ND ND<br />
gamophylla Mallee<br />
Eucalyptus Bastard Seed 1815 6.7 22.4 24.1 33.9 11 292 73 ND ND<br />
intertexta Coolibah<br />
Eucalyptus Normanton Seed 1801 7.5 24.2 21.1 38.1 18 117 53 ND ND<br />
normantonensis Box<br />
Fimbristylis Fringe Seed 1108 11.4 11.0 19.2 42.9 45 173 39 ND ND<br />
oxystachya Rush<br />
average<br />
Gahnia aspera. Saw Sedge Seed 600 7.4 2.0 6.4 20.6 87 4525 86 ND ND<br />
Gahnia sp. Saw Sedge Seed ND 7.5 3.5 2.9 84.1 BDL 50 30 15.2 20<br />
Grevillea Golden<br />
pteridifolia Grevillea Seed 1246 7.5 21.7 14.7 19.9 164 286 374 4.5 ND<br />
Lepidozamia Burrawang Seeds, ND 3.1 9.3 ND ND 7 8 62 7.0 ND<br />
peroffskyana<br />
Dried,<br />
leached,<br />
roasted<br />
and then<br />
milled<br />
Nelumbo Lotus Seed 545 38.8 8.8 2.7 47.0 7 4<strong>40</strong> 17 8.0 ND<br />
nucifera<br />
(T)<br />
average<br />
Nymphaea Water Seed ND 57.4 3.4 0.1 35.7 <strong>40</strong> 591 27 1.8 81<br />
giantea Lily (T)<br />
average<br />
Nymphaea sp. Water Lily Seed 330 75.5 1.3 0.5 18.1 232 88 0 0.2 ND<br />
Omphalea<br />
queenslandiae Tambor Seed 1991 28.5 11.5 41.7 0.8 6 7<strong>40</strong> 17 2.1 ND<br />
Panicum Native Seed 1504 5.2 13.3 3.5 71.9 27 98 22 ND ND<br />
australiense Millet<br />
average<br />
30<br />
Source: Miller, J.B., James, J.K. & Maggiore, P.M.A. 1993,<br />
Tables of Composition of Australian Aboriginal Foods. Aboriginal Studies Press, Canberra.
Vegetables<br />
Proximate constituents per 100g edible portion, raw unless otherwise indicated.<br />
Taxonomic Common Local Part Energy Water Protein Fat Carbs Na K Ca Fe P<br />
Name Name Name kj g g g g mg mg mg mg mg<br />
Panicum Native Seed 1437 9.2 12.7 4.6 65.5 64 187 63 ND ND<br />
decompositum Millet<br />
average<br />
Pittosporum Willow Seed 1602 8.6 9.7 9.0 69.0 56 39 131 ND ND<br />
phylliraeoides Butterbrush<br />
Poinciana Bird of Seed ND ND 6.5 1.4 ND 46 87 BDL ND ND<br />
pulcherrima Paradise<br />
Portulaca Inland Seed 1<strong>40</strong>5 9.1 19.5 14.1 49.6 70 138 296 ND ND<br />
oleracea Pigweed (T)<br />
average<br />
Kapok Seed 114 ND 6.7 ND ND 16 20 BDL ND ND<br />
Patuta Seed 1470 11.2 26.8 6.4 48.6 84 221 88 ND ND<br />
Rub-on- Seed ND ND ND ND ND 54 1356 322 ND ND<br />
Breast<br />
Eragrostis Woolybutt Seed 536 58.9 7.0 1.7 22.1 13 135 110 45.0 ND<br />
eriopoda Grass Paste<br />
Grevillea Golden Seed 1728 6.2 23.5 25.2 23.2 850 315 105 67.8 ND<br />
pteridifolia Grevillea Wings<br />
Nymphaea Water Seed 479 54.2 2.9 0.5 31.2 61 297 83 2.5 ND<br />
macrosperma Lily Pod (T)<br />
average<br />
Damper Damper 889 25.7 13.3 1.8 37.3 46 175 25 ND ND<br />
‘numa’<br />
Adansonia Boab Seed 1492 9.2 13.9 6.1 67.1 21 1476 184 2.0 396<br />
gregorii<br />
embedded<br />
average<br />
in pulp<br />
Adansonia Boab Pulp 519 61.8 4.6 1.9 29.2 54 1088 127 1.4 ND<br />
gregorii<br />
(=pith)<br />
average<br />
Calvatia sp. Puff Balls Fungus ND 91.2 4.2 0.4 2.6 8 250 3 15.0 110<br />
Lycoperdon Puff Balls Fungus ND 86.9 6.2 0.4 ND BDL 280 BDL 5.0 1<strong>40</strong><br />
& Calvatia<br />
ssp.<br />
Aleurites Candle Kernel 2836 1.4 20.6 61.9 10.7 5 575 158 22.6 860<br />
moluffana Nut treated<br />
average<br />
& cooked<br />
Source: Miller, J.B., James, J.K. & Maggiore, P.M.A. 1993,<br />
Tables of Composition of Australian Aboriginal Foods. Aboriginal Studies Press, Canberra.<br />
31
Vegetables<br />
Proximate constituents per 100g edible portion, raw unless otherwise indicated.<br />
Taxonomic Common Local Part Energy Water Protein Fat Carbs Na K Ca Fe P<br />
Name Name Name kj g g g g mg mg mg mg mg<br />
Araucaria Bunya Kernel 856 43.9 11.0 1.0 39.6 5 229 7 2.1 ND<br />
bidwillii Nut<br />
Beilschmiedia Yellow Kernel 1005 37.1 7.5 0.2 54.4 55 218 32 ND ND<br />
bancrofti Walnut<br />
Brachychiton Kurrajong Nut ND 9.8 20.4 264 43.5 10 1010 210 7.5 630<br />
australis<br />
Hicksbeachia Monkey Nut 666 61.0 3.8 2.8 31.4 7 234 146 2.3 ND<br />
pinnatifolia Nut (T)<br />
average<br />
Lepidozamia Wild Flour Nut 834 46.4 8.7 0.5 41.7 ND 1 60 ND ND<br />
hopei<br />
Macrozamia Cycad Nut 362 57.2 7.3 0.2 14.4 5 291 4 5.6 ND<br />
communis<br />
Pandanus Pandanus Kernel 2<strong>40</strong>3 3.0 25.9 46.8 23.3 344 267 62 6.6 ND<br />
spiralis<br />
(T)<br />
average<br />
Podocarpus Black Pine Nut 187 52.2 2.7 1.7 <strong>40</strong>.9 29 748 178 ND ND<br />
amarus<br />
Santalum Quandong Kernel 2920 2.4 16.0 63.1 18.1 65 388 99 10.6 ND<br />
acuminatum<br />
(T)<br />
average<br />
Sterculia Peanut Nut 1249 <strong>40</strong>.7 12.3 16.4 31.1 22 477 128 2.6 31<br />
quadrifida Tree (T)<br />
average<br />
Stylobasium Nutbush Nut 515 1.3 12.3 2.6 80.4 326 613 55 ND ND<br />
spatulatum<br />
average<br />
Terminalis Indian Nut 2987 4.2 20.0 55.8 ND 18 11<strong>40</strong> 200 6.3 1130<br />
catappa Almond<br />
Balkbalk Nut 663 24.3 18.6 7.4 <strong>40</strong>.6 100 1386 135 ND ND<br />
Sandalwood Nut 2841 3.5 15.3 62.5 16.8 73 611 86 ND ND<br />
Nut<br />
Shooting Kernel ND 87.1 0.7 3.4 6.6 166 558 70 ND ND<br />
Coconut,<br />
Musa<br />
Calandrina Parakeelya Leaves 84 93.0 1.2 0.2 3.5 ND 798 21 0.3 4<br />
balonensis<br />
Carpobrotus Pigface Leaves 52 91.0 0.4 0.1 2.6 382 175 272 0.7 ND<br />
modestus<br />
32<br />
Source: Miller, J.B., James, J.K. & Maggiore, P.M.A. 1993,<br />
Tables of Composition of Australian Aboriginal Foods. Aboriginal Studies Press, Canberra.
Vegetables<br />
Proximate constituents per 100g edible portion, raw unless otherwise indicated.<br />
Taxonomic Common Local Part Energy Water Protein Fat Carbs Na K Ca Fe P<br />
Name Name Name kj g g g g mg mg mg mg mg<br />
Heteropogon Spear Leaves 57 90.0 0.5 0.1 2.8 1 220 7 0.1 ND<br />
triticeus Grass<br />
Leichhardtia Bush Leaves 504 65.2 3.3 2.0 28.5 5 158 16 5.6 ND<br />
australis Banana (T)<br />
average<br />
Tetragonia New Leaves 61 90.9 1.7 0.3 1.3 590 180 38 2.6 ND<br />
tetragonoides Zealand<br />
Spinach<br />
Thespesia Pacific Leaves 598 64.3 3.9 1.1 30.8 20 590 1110 4.1 56<br />
populnea Rosewood<br />
Munyan Leaves ND ND 6.1 ND ND 123 1528 333 ND ND<br />
Leaves<br />
Munyan Leaves ND ND 3.8 ND ND 29 103 29 ND ND<br />
Leaves<br />
Pteridium Bracken Frond 205 80.9 6.4 1.0 3.7 3 255 21 0.8 ND<br />
esculentum Fern Tip<br />
Calamus sp. Wait-a- Bud ND 88.6 2.2 0.9 ND 8 30 90 0.7 46<br />
while<br />
Cochlo- Kapok Flower 243 86.7 1.4 0.8 11.8 1 30 <strong>40</strong> 4.8 3<br />
spermum Tree<br />
fraseri<br />
Eremophila Poverty Flower 377 77.4 2.0 1.5 ND 5 570 178 5.5 ND<br />
latrobei Bush<br />
Grevillea Silky<br />
pteridifolia Oak Flower 602 70.5 1.9 0.20 ND 10 190 48 1.4 ND<br />
Livistona Cabbage Bud & 69 85.7 2.2 0.5 7.6 6 470 20 0.6 ND<br />
australis Tree Heart (T)<br />
average Palm<br />
Nymphaea Water 479 60.8 4.7 0.5 32.5 352 87 ND 0.5 ND<br />
violacea Lily<br />
average<br />
Source: Miller, J.B., James, J.K. & Maggiore, P.M.A. 1993,<br />
Tables of Composition of Australian Aboriginal Foods. Aboriginal Studies Press, Canberra.<br />
33
Vegetables<br />
Proximate constituents per 100g edible portion raw, unless otherwise indicated.<br />
Taxonomic Common Local Part Energy Water Protein Fat Carbs Na K Ca Fe P<br />
Name Name Name kj g g g g mg mg mg mg mg<br />
Arthropodium Vanilla Root 124 87.1 1.4 0.1 6.0 28 119 20 7.8 ND<br />
milleflorum Lily<br />
average<br />
Bowenia Byfield Root ND 72.7 4.1 0.5 ND 90 180 120 0.9 19<br />
serrulata Fern<br />
Bowenia Zamia Root <strong>40</strong>4 69.0 1.6 0.2 23.2 24 251 94 3.0 ND<br />
spectablilis Fern<br />
average<br />
Chiloglottis Dainty-Bird Root 78 91.0 0.9 0.1 3.7 12 94 27 2.7 ND<br />
trapeziformis Orchid<br />
Colocasia<br />
esculenta Taro Root 1231 7.5 19.5 2.9 49.5 95 3741 963 74.9 ND<br />
Curculigo Grass<br />
ensifolia Potato<br />
average Root 300 64.7 2.2 0.3 16.5 205 244 261 50 ND<br />
Geranium sp. Australian<br />
Cranesbill Taproot 99 80.8 0.7 0.2 5.0 18 220 433 ND ND<br />
Ipomoea sp. Mauve<br />
aff. Gracilis Convolvulus Root ND ND 1.4 ND ND 86 113 ND ND ND<br />
Microseris Yam Daisy Root 249 75.6 1.7 0.8 21.0 20 199 25 5.0 ND<br />
scapigera<br />
(T)<br />
average<br />
Stemodia sp. Sweet Root raw 1756 32.9 4.8 1.5 55.3 63 265 63 ND ND<br />
average Panja & boiled<br />
Trachymene Wild<br />
incise Parsnip Root 100 86.2 2.0 0.2 4.8 60 190 70 4.1 ND<br />
Triglochin Water Root 297 79.1 1.4 0.1 17.4 150 191 8 136 ND<br />
procera Ribbon (T)<br />
average<br />
Vigna Pencil Root 295 78.6 2.3 0.2 21.4 8 378 155 15.4 37<br />
lanceolata Yam (T)<br />
average<br />
Bulbine Wild Bulb 251 80.4 2.1 0.3 12.9<br />
bulbosa Onion<br />
average<br />
34<br />
Source: Miller, J.B., James, J.K. & Maggiore, P.M.A. 1993,<br />
Tables of Composition of Australian Aboriginal Foods. Aboriginal Studies Press, Canberra.
Vegetables<br />
Proximate constituents per 100g edible portion, raw unless otherwise indicated.<br />
Taxonomic Common Local Part Energy Water Protein Fat Carbs Na K Ca Fe P<br />
Name Name Name kj g g g g mg mg mg mg mg<br />
Cyperus Native Bulb 883 42.8 3.4 0.9 56.3(T) 45 498 19 3.4 ND<br />
bulbosus Onion raw &<br />
average<br />
cooked<br />
Cyperus Wild Onion Bulb 750 53.3 1.9 0.5 44.4 38 4<strong>40</strong> 14 5.8 56<br />
rotundus<br />
raw &<br />
average<br />
cooked<br />
Cyperus sp. Bush Onion Bulb 630 60.5 2.2 0.4 63.5 195 470 57 ND ND<br />
Average<br />
Nymphaea Water Lily Bulb 563 55.3 2.1 0.3 32.1 <strong>40</strong> 310 <strong>40</strong> 22.2 190<br />
gigantea<br />
average<br />
Tacca Polynesian Bulb 800 46.6 0.1 BDL 9.6 10 20 30 1.9 4<br />
leontope- Arrowroot<br />
taloides<br />
Bush Onion Bulb 1060 31.2 1.7 0.4 63.5 195 470 57 ND ND<br />
Blechum Bungwall Tuber 1376 7.2 3.9 0.2 81.4 <strong>40</strong>9 224 64 ND ND<br />
indicum Fern<br />
Curcuma Native Tuber 271 80.6 1.0 0.3 15.2 13 130 30 2.1 ND<br />
australasica Ginger<br />
Dioscorea Yam Tuber 323 72.4 1.4 0.2 25.2 9 256 15 0.8 ND<br />
alata average<br />
(T)<br />
Dioscorea Cheeky Tuber 357 70.8 2.7 0.2 25.8 6 236 19 3.1 35<br />
bulbifera Yam (T)<br />
average<br />
Dioscorea sp. Yam Tuber 701 53.4 5.1 0.6 37.0 9 225 9 3.9 ND<br />
Dioscorea Yam Tuber 455 72.5 2.3 0.4 24.6 8 550 10 1.1 ND<br />
bulbifera var.<br />
(T)<br />
elongate<br />
average<br />
Dioscorea Long Yam Tuber <strong>40</strong>4 68.3 2.6 0.4 26.2 59 348 63 5.2 35<br />
transversa<br />
(T)<br />
average<br />
Eleocharis Spike Rush Tuber 635 50.8 3.7 0.6 41.4 16 243 27 95.0 ND<br />
dulcis average<br />
(T)<br />
Eustrephus Wombat Tuber ND 89.2 1.8 0.3 ND 47 160 15 15.9 ND<br />
latifolius Berry<br />
Castrodia Potato Orchid, Tuber 331 77.2 2.1 0.2 18.0 9 1<strong>40</strong> 4 1.5 ND<br />
sesamoides Cinnamon<br />
Bells<br />
Source: Miller, J.B., James, J.K. & Maggiore, P.M.A. 1993,<br />
Tables of Composition of Australian Aboriginal Foods. Aboriginal Studies Press, Canberra.<br />
35
Vegetables<br />
Proximate constituents per 100g edible Portion, raw unless otherwise indicated.<br />
Taxonomic Common Local Part Energy Water Protein Fat Carbs Na K Ca Fe P<br />
Name Name Name kj g g g g mg mg mg mg mg<br />
Ipomoea Bush Tuber <strong>40</strong>8 72.5 1.3 0.3 26.9 44 422 81 18.5 14<br />
costata average Potato (T)<br />
Ipomoea Bush Tuber, 567 67.1 2.4 0.4 26.3 49 378 58 2.0 11000<br />
graminea Potato raw & (T)<br />
average<br />
cooked<br />
Ipomoea Yam Tuber 311 79.8 1.3 0.2 17.9 41 431 114 ND ND<br />
sp. Average<br />
Microstemma Flat Tuber 120 87.9 0.6 0.2 10.4 24 235 57 4.9 5<br />
tuberosum Swamp (T)<br />
average Potato<br />
Phaseolus Potato Tuber ND 28.3 6.0 ND ND 972 1028 118 ND ND<br />
adenanthus Bean<br />
Tacca Polynesian Tuber 512 71.3 2.3 1.5 28.4 33 424 55 1.4 ND<br />
leontopetaloides Arrowroot<br />
(T)<br />
average<br />
Bush Potato Tuber 220 80.9 1.7 0.2 11.5 314 148 ND 1.2 ND<br />
Yam Tuber ND ND 3.4 ND ND 28 254 41 ND ND<br />
Yulpin Tuber 466 69.8 2.9 0.1 25.8 95 133 44 ND ND<br />
Castanospermum Black Bean 824 51.4 4.0 1.7 43.2 74 670 101 6.1 ND<br />
australe average Bean<br />
Wild Bean Bean 355 78.0 4.3 1 15.3 23 298 65 ND ND<br />
Cycas Cycad Food 722 29.3 5.8 0.4 38.6 5 66 21 4.6 ND<br />
armstrongii<br />
average<br />
Cycas media Cycad Food 511 67.7 5.1 1.1 24.9 20 919 61 ND ND<br />
average<br />
Cycas argulata Cycad Food 1186 7.6 7.5 0.3 65.7 6 98 35 15.4 ND<br />
average<br />
Portulaca Inland Whole 181 87.0 4.0 0.3 6.4 1 825 105 2.5 24<br />
oleracea Pigweed Plant (T)<br />
average<br />
Cocos nucifera Coconut Flesh 119 80.9 1.1 2.7 BDL 38 144 10 0.2 ND<br />
Cocos nucifera Coconut Milk 1004 84.9 3.7 ND 58.8 10 100 BDL 1.3 28<br />
average<br />
Typha Bullrush Pollen 1657 9.0 11.3 0.8 89.8 50 1130 160 21.3 290<br />
domingensis<br />
Lysiphyllum Bauhinia Nectar 1752 6.1 14.8 13.1 63.5 10 610 212 3.2 ND<br />
carronii<br />
36<br />
Source: Miller, J.B., James, J.K. & Maggiore, P.M.A. 1993,<br />
Tables of Composition of Australian Aboriginal Foods. Aboriginal Studies Press, Canberra.
Notes
38<br />
Index<br />
Common Name Page Common Name Page Common Name Page Common Name Page<br />
Ants 18<br />
Apple: cocky, love,<br />
bush, indian jujube,<br />
wild 25, 25<br />
Asian breadfruit 21<br />
Aspen: white, crater 20<br />
Australian bustard 14<br />
Australian Cranesbill 33<br />
Australian Plague<br />
Locust 18<br />
Awalyuru 22<br />
Balk Balk 32<br />
Banana: bush 24, 33<br />
Bastard Coolibah 30<br />
Bauhinia 36<br />
Bean: malagna,<br />
black, wild 7, 36<br />
Berries: apple, conkerberry,<br />
emu, wombat, native<br />
gooseberry,<br />
wild raspberry, yellow<br />
elderberry, blackberry 22,<br />
23, 35<br />
Bird of Paradise 31<br />
Black Pine 32<br />
Blue Mallee 30<br />
Boab 31<br />
Bogong Moth 18<br />
Brown Pine 26<br />
Bullrush 36<br />
Burrawang 30<br />
Bush Citrus 22<br />
Bush Raisin 26<br />
Bush Tomato 26<br />
Bush Turkey 14<br />
Caper 21, 22<br />
Cashew Fruit 20<br />
Cassowary Gum 20<br />
Cherry: wild, cedar<br />
bay, native, bush 20, 21<br />
Coconut: flesh, milk 36<br />
Coconut Gall 18<br />
Colony Wattle 29<br />
Crocodile 16<br />
Crow Fruit 27<br />
Cucumber 23<br />
Current: tree, bush 21<br />
Custard Finger 27<br />
Cycad 32,36<br />
Dabugay 24<br />
Damper ‘numa’ 31<br />
Dead Finish 29<br />
Desert Acacia 29<br />
Djinpu 27<br />
Dodder Laurel 23<br />
Dogwood 29<br />
Dugong 16<br />
Durriaman 27<br />
Feral Water Buffalo 13<br />
Fern: byfield, zamia,<br />
bracken, bungwall 34, 35<br />
Fig: sandpaper, wild,<br />
cluster 24<br />
Fish 16<br />
Fringe Rush 30<br />
Galay 27<br />
Geebung 25<br />
Ginger:<br />
wild, green, native 20, 35<br />
Golden Grevillea 30, 31<br />
Grapes:<br />
native, wild 20<br />
Great Morinda<br />
Cheesefruit 25<br />
Guava 24<br />
Gundabluey 29<br />
Inland Pigweed 31, 36<br />
Insect Gall 18<br />
Ironwood 29<br />
Jaraminy 27<br />
Johnson Satin Ash 26<br />
Jurdal 23<br />
Kangaroo 13<br />
Kapok: tree 31, 33<br />
Kawai 27<br />
Kurrajong: northern,<br />
red-flowered 29, 32<br />
Lawyer Vine 22<br />
Leichhardt Tree 25<br />
Lerp Scale 18<br />
Lillypilly: scrub cherry 20<br />
Lime 22<br />
Lizards:<br />
dragon, spiny chiton,<br />
goanna, goulds goanna 14<br />
Lotus 30<br />
Magpie Goose 13<br />
Mangrove Snail 15<br />
Mangrove Worm 15<br />
Manyiku 27<br />
Mauve Convolvulus 33<br />
Midjin 21<br />
Mistletoe 20<br />
Mongo 26<br />
Mud Crab 15, 16<br />
Mulga 29<br />
Munyan Leaves 33<br />
Mussel:<br />
mud, freshwater 15<br />
Native Millet 30, 31<br />
New Zealand Spinach 33<br />
Normanton Box 30<br />
Nuts: bunya,<br />
yellow walnut,<br />
monkey, bush, tree,<br />
indian almond,<br />
Peanut tree,<br />
sandalwood,<br />
candle 27, 31, 32<br />
Onion: wood,native,<br />
wild,bush 26, 35<br />
Orange 22<br />
Orchid: dainty bird,<br />
potato 24, 35<br />
Oysters: black lip,<br />
common milky, rock 15<br />
Pacific Rosewood 33<br />
Palm: walking stick,<br />
nypa, cabbage tree,<br />
sand, fine-leafed<br />
fan 24, 33<br />
Pandanus 25, 32<br />
Parakeelya 30, 32<br />
Passionfruit 25<br />
Patuta 31<br />
Pig Face 23, 32<br />
Plum: green, davidson,<br />
wongi, nonda, wild,<br />
burdekin, bush,<br />
billy goat, yellow 21, 22<br />
Polynesian Arrowroot 35<br />
Possum: northern<br />
brushtail 13<br />
Potato: bush, grass,<br />
flat swamp 27, 33, 36<br />
Poverty Bush 33<br />
Prickly Moses 29<br />
Prickly Pear 25<br />
Puff Balls 31<br />
Quandong:<br />
Blue 23, 26, 32<br />
Ragah 24<br />
Rats Tail 30<br />
Rose Hips 26<br />
Rosella 24<br />
Rub-on-Breast 31<br />
Ruby Saltbush 24<br />
Saw Sedge 30<br />
Shellfish: marine,<br />
mud whelk 16<br />
Shooting Coconut 32<br />
Silky Oak 33<br />
Silky Pear 27<br />
Small-Leafed<br />
Water Gum 26<br />
Snail 18<br />
Snake: file,water python,<br />
red-bellied black 14<br />
Spear Grass 33<br />
Spike Rush 35<br />
Stinging Tree:<br />
shiny leaf 23<br />
Sugarbag 18<br />
Summer Grass 29<br />
Tamarind 23<br />
Tambor 30<br />
Tanjong Tree 25<br />
Turtle: northern<br />
snake-neck, flatback,<br />
northern snapping,<br />
Hawksbill 14, 15<br />
Umbrella Bush 29<br />
Vanilla Lily 34<br />
Wait-a-while 33<br />
Walleroo:<br />
Antilopine, common 13<br />
Water Chestnut 24<br />
Water Lily 30, 31, 33<br />
Wild Flour 32<br />
Willow Butterbrush 31<br />
Witchetty Bush 29<br />
Witchetty Grub 18<br />
Woolybutt Grass 30, 31<br />
Yam: daisy, pencil,<br />
cheeky, long 34, 35, 36<br />
Yulpin 36
Additional copies of this book are available from<br />
RENAL RESOURCE CENTRE<br />
37 Darling Point Road<br />
Darling Point NSW 2027<br />
AUSTRALIA<br />
Tel: +61 2 9362 3995<br />
Fax: +61 2 9362 4354<br />
Freecall: 1800 257 189<br />
www.renalresource.com<br />
AMB-033