Web-economic-crisis-health-systems-and-health-web
Web-economic-crisis-health-systems-and-health-web Web-economic-crisis-health-systems-and-health-web
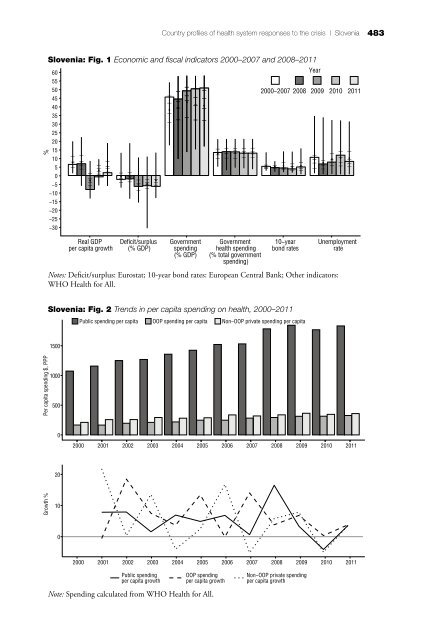
Country profiles of health system responses to the crisis | Slovenia 483 % Slovenia: Fig. 1 Economic and fiscal indicators 2000–2007 and 2008–2011 60 55 50 45 40 35 30 25 20 15 10 5 0 −5 −10 −15 −20 −25 −30 _ _ _ _ ● ● _ _ _ _ _ _ _ _ ● _ ● ● _ _ Real GDP per capita growth _ _ ● ● _ _ _ _ _ _ _ ● ● ● _ _ _ Deficit/surplus (% GDP) _ _ _ _ _ _ _ _ _ _ ● ● _ _ _ ● _ ● _ ● _ _ _ _ _ Government spending (% GDP) _ _ _ _ _ ● ● ● ● ● _ _ _ _ _ Government health spending (% total government spending) _ _ _ _ _ _ _ ● _ ● ● ● ● _ _ _ 10−year bond rates _ _ _ _ _ _ _ _ _ ● ● ● ● ● _ _ _ _ _ Unemployment rate Notes: Deficit/surplus: Eurostat; 10-year bond rates: European Central Bank; Other indicators: WHO Health for All. Year 2000−2007 2008 2009 2010 2011 Slovenia: Fig. 2 Trends in per capita spending on health, 2000–2011 Public spending per capita OOP spending per capita Non−OOP private spending per capita 1500 Per capita spending $, PPP 1000 500 0 2000 2001 2002 2003 2004 2005 2006 2007 2008 2009 2010 2011 20 Growth % 10 0 2000 2001 2002 2003 2004 2005 2006 2007 2008 2009 2010 2011 Public spending per capita growth OOP spending per capita growth Note: Spending calculated from WHO Health for All. Non−OOP private spending per capita growth
484 Economic crisis, health systems and health in Europe: country experience businesses, but in accordance with the Law on Balancing Public Finances, SHI contributions are now levied on short-term and part-time contracts and on freelance writer contracts (2012). Changes to health coverage Population (entitlement) • Entitlement to free statutory coverage restricted by changing the basis for entitlement from the minimum wage to receiving social benefits (2012). The benefits package • Revision of the SHI drug lists (2009). User charges • Co-insurance rates increased from 5% to 10% (transplants, major surgery, treatment abroad, intensive care, radiotherapy, dialysis and other major diagnostic, therapeutic and rehabilitation tasks), 15% to 20% (in vitro fertilization, infertility, sterilization and pregnancy termination; orthopaedic; orthotic, hearing and other aids; outpatient, inpatient and spa services; nonmedical care in hospitals and spas; some services in primary care) and 25% to 30% (all treatment for occupational injury, some drugs) (2009). • Reduction of temporary sickness leave benefits from 100% to 90% (for occupational illness and injury, transplants, blood donation), from 90% to 80% (sickness) and from 80% to 70% (non-work injury and accompanying dependants when ill). • Partly as a result of these reforms, OOP payments rose from 12.5% of total health expenditure in 2008 to 13.7% in 2011. Changes to health service planning, purchasing and delivery Prices of medical goods • SHI reduced drug prices through negotiation with suppliers and reduced the price of dialysis (2009). • Introduction of therapeutic groups for reference pricing (2012). • Provision of information to the public regarding rational use of medicines and of training in rational prescribing for physicians (2009). Salaries and motivation of health sector workers • No inflation-related increases applied to public sector salaries in 2009 and less than inflation rate increase to such salaries applied in 2010. • Allowance for above-average performance abolished (2009).
- Page 466 and 467: Country profiles of health system r
- Page 468 and 469: Country profiles of health system r
- Page 470 and 471: Malta Natasha Azzopardi Muscat Econ
- Page 472 and 473: Country profiles of health system r
- Page 474 and 475: Country profiles of health system r
- Page 476 and 477: Country profiles of health system r
- Page 478 and 479: Montenegro Ratka Knežević Economi
- Page 480 and 481: Country profiles of health system r
- Page 482 and 483: Country profiles of health system r
- Page 484 and 485: Country profiles of health system r
- Page 486 and 487: Norway Anne Karin Lindahl and Jon M
- Page 488 and 489: Country profiles of health system r
- Page 490 and 491: Country profiles of health system r
- Page 492 and 493: Country profiles of health system r
- Page 494 and 495: Country profiles of health system r
- Page 496 and 497: Country profiles of health system r
- Page 498 and 499: Country profiles of health system r
- Page 500 and 501: Country profiles of health system r
- Page 502 and 503: Country profiles of health system r
- Page 504 and 505: The Russian Federation Elena Potapc
- Page 506 and 507: Country profiles of health system r
- Page 508 and 509: Serbia Vukasin Radulovic Economic t
- Page 510 and 511: Country profiles of health system r
- Page 512 and 513: Country profiles of health system r
- Page 514 and 515: Country profiles of health system r
- Page 518 and 519: Country profiles of health system r
- Page 520 and 521: Spain Enrique Bernal-Delgado, Sandr
- Page 522 and 523: Country profiles of health system r
- Page 524 and 525: Country profiles of health system r
- Page 526 and 527: Country profiles of health system r
- Page 528 and 529: Switzerland Alberto Holly and Phili
- Page 530 and 531: Country profiles of health system r
- Page 532 and 533: Tajikistan Ghafur Khodjamurodov Eco
- Page 534 and 535: Country profiles of health system r
- Page 536 and 537: Country profiles of health system r
- Page 538 and 539: Ukraine Valeria Lekhan and Mariia T
- Page 540 and 541: Country profiles of health system r
- Page 542 and 543: Country profiles of health system r
- Page 544 and 545: Country profiles of health system r
- Page 546 and 547: Country profiles of health system r
- Page 548 and 549: Country profiles of health system r
- Page 550: Country profiles of health system r
Country profiles of <strong>health</strong> system responses to the <strong>crisis</strong> | Slovenia<br />
483<br />
%<br />
Slovenia: Fig. 1 Economic <strong>and</strong> fiscal indicators 2000–2007 <strong>and</strong> 2008–2011<br />
60<br />
55<br />
50<br />
45<br />
40<br />
35<br />
30<br />
25<br />
20<br />
15<br />
10<br />
5<br />
0<br />
−5<br />
−10<br />
−15<br />
−20<br />
−25<br />
−30<br />
_ _<br />
_ _<br />
● ●<br />
_ _<br />
_ _<br />
_ _ _<br />
_<br />
●<br />
_<br />
●<br />
●<br />
_ _<br />
Real GDP<br />
per capita growth<br />
_ _<br />
● ●<br />
_<br />
_ _ _ _<br />
_ _<br />
●<br />
● ●<br />
_ _ _<br />
Deficit/surplus<br />
(% GDP)<br />
_ _ _ _ _ _ _ _<br />
_ _<br />
●<br />
●<br />
_ _<br />
_<br />
● _ ●<br />
_<br />
●<br />
_ _ _ _ _<br />
Government<br />
spending<br />
(% GDP)<br />
_ _ _ _ _<br />
● ● ● ● ●<br />
_ _ _ _ _<br />
Government<br />
<strong>health</strong> spending<br />
(% total government<br />
spending)<br />
_ _ _ _ _<br />
_ _ ● _ ●<br />
●<br />
●<br />
●<br />
_ _ _<br />
10−year<br />
bond rates<br />
_ _ _ _<br />
_ _<br />
_ _<br />
_<br />
●<br />
●<br />
●<br />
●<br />
●<br />
_ _ _ _ _<br />
Unemployment<br />
rate<br />
Notes: Deficit/surplus: Eurostat; 10-year bond rates: European Central Bank; Other indicators:<br />
WHO Health for All.<br />
Year<br />
2000−2007 2008 2009 2010 2011<br />
Slovenia: Fig. 2 Trends in per capita spending on <strong>health</strong>, 2000–2011<br />
Public spending per capita OOP spending per capita Non−OOP private spending per capita<br />
1500<br />
Per capita spending $, PPP<br />
1000<br />
500<br />
0<br />
2000 2001 2002 2003 2004 2005 2006 2007 2008 2009 2010 2011<br />
20<br />
Growth %<br />
10<br />
0<br />
2000 2001 2002 2003 2004 2005 2006 2007 2008 2009 2010 2011<br />
Public spending<br />
per capita growth<br />
OOP spending<br />
per capita growth<br />
Note: Spending calculated from WHO Health for All.<br />
Non−OOP private spending<br />
per capita growth


