Web-economic-crisis-health-systems-and-health-web
Web-economic-crisis-health-systems-and-health-web Web-economic-crisis-health-systems-and-health-web
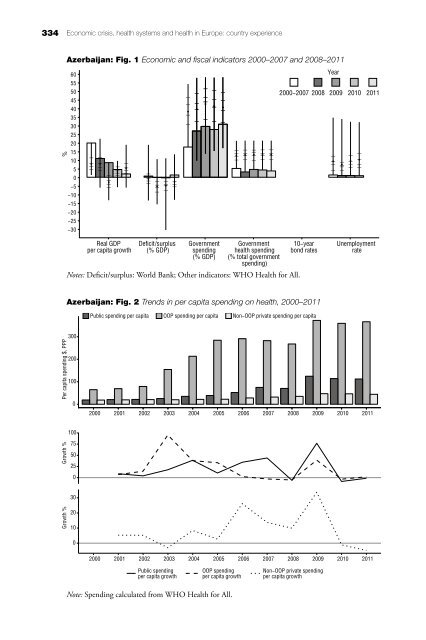
Azerbaijan Fuad Ibrahimov Economic trends • Azerbaijan's real per capita GDP growth slowed consistently between 2008 and 2011; however, the economy did not contract. The government has maintained a balanced budget, although spending levels are among the lowest in Europe. Health expenditure as a share of government expenditure is low compared with other European countries (Azerbaijan: Fig. 1). • OOP payments are the main source of health financing; growth rates for all sources of health financing are volatile, largely because of low expenditure levels (Azerbaijan: Fig. 2). Policy responses Changes to public funding for the health system • No response reported. Changes to health coverage Population (entitlement) • No response reported. The benefits package • No response reported. User charges • No response reported. Changes to health service planning, purchasing and delivery Prices of medical goods • No response reported. Salaries and motivation of health sector workers • Steady annual increases in the salary levels of public sector employees, whose salaries historically have been very low (2007, 2008, 2010, 2011). Payment to providers • No response reported.
334 Economic crisis, health systems and health in Europe: country experience % Azerbaijan: Fig. 1 Economic and fiscal indicators 2000–2007 and 2008–2011 60 55 50 45 40 35 30 25 20 15 10 5 0 −5 −10 −15 −20 −25 −30 _ _ _ _ ● ● _ _ ● ● _ _ _ ● _ _ _ _ _ ● _ ● ● ● _ _ _ _ _ _ _ _ _ _ _ _ _ ● ● _ _ _ ● _ ● _ ● _ _ _ _ _ _ _ _ _ _ ● ● ● ● ● _ _ _ _ _ Year 2000−2007 2008 2009 2010 2011 _ _ _ _ _ ● ● ● ● _ _ _ _ Real GDP per capita growth Deficit/surplus (% GDP) Government spending (% GDP) Government health spending (% total government spending) Notes: Deficit/surplus: World Bank; Other indicators: WHO Health for All. 10−year bond rates Unemployment rate Azerbaijan: Fig. 2 Trends in per capita spending on health, 2000–2011 Public spending per capita OOP spending per capita Non−OOP private spending per capita Per capita spending $, PPP 300 200 100 0 2000 2001 2002 2003 2004 2005 2006 2007 2008 2009 2010 2011 100 Growth % 75 50 25 0 30 Growth % 20 10 0 2000 2001 2002 2003 2004 2005 2006 2007 2008 2009 2010 2011 Public spending per capita growth OOP spending per capita growth Non−OOP private spending per capita growth Note: Spending calculated from WHO Health for All.
- Page 316 and 317: Chapter 9 The impact of the crisis
- Page 318 and 319: Chapter 9 | The impact of the crisi
- Page 320 and 321: Chapter 9 | The impact of the crisi
- Page 322 and 323: Chapter 9 | The impact of the crisi
- Page 324 and 325: Chapter 9 | The impact of the crisi
- Page 326 and 327: Chapter 9 | The impact of the crisi
- Page 328 and 329: Chapter 9 | The impact of the crisi
- Page 330 and 331: Chapter 9 | The impact of the crisi
- Page 332 and 333: Chapter 9 | The impact of the crisi
- Page 334 and 335: Chapter 9 | The impact of the crisi
- Page 336 and 337: Chapter 9 | The impact of the crisi
- Page 338 and 339: Chapter 9 | The impact of the crisi
- Page 340 and 341: Chapter 9 | The impact of the crisi
- Page 342 and 343: Chapter 9 | The impact of the crisi
- Page 344 and 345: Chapter 9 | The impact of the crisi
- Page 346 and 347: Chapter 9 | The impact of the crisi
- Page 348 and 349: Chapter 9 | The impact of the crisi
- Page 350 and 351: Chapter 9 | The impact of the crisi
- Page 352: Chapter 9 | The impact of the crisi
- Page 356 and 357: Albania Genc Burazeri and Enver Ros
- Page 358 and 359: Country profiles of health system r
- Page 360 and 361: Country profiles of health system r
- Page 362 and 363: Austria Thomas Czypionka and Maria
- Page 364 and 365: Country profiles of health system r
- Page 368 and 369: Country profiles of health system r
- Page 370 and 371: Country profiles of health system r
- Page 372 and 373: Country profiles of health system r
- Page 374 and 375: Country profiles of health system r
- Page 376 and 377: Country profiles of health system r
- Page 378 and 379: Country profiles of health system r
- Page 380 and 381: Country profiles of health system r
- Page 382 and 383: Bulgaria Antoniya Dimova and Mina P
- Page 384 and 385: Country profiles of health system r
- Page 386 and 387: Country profiles of health system r
- Page 388 and 389: Country profiles of health system r
- Page 390 and 391: Cyprus Elisavet Constantinou and Ma
- Page 392 and 393: Country profiles of health system r
- Page 394 and 395: Czech Republic Tomáš Roubal and J
- Page 396 and 397: Country profiles of health system r
- Page 398 and 399: Country profiles of health system r
- Page 400 and 401: Country profiles of health system r
- Page 402 and 403: Country profiles of health system r
- Page 404 and 405: Estonia Triin Habicht and Mall Lein
- Page 406 and 407: Country profiles of health system r
- Page 408 and 409: Finland Jan Klavus and Lauri Vuoren
- Page 410 and 411: Country profiles of health system r
- Page 412 and 413: France Karine Chevreul, Karen Berg
- Page 414 and 415: Country profiles of health system r
334 Economic <strong>crisis</strong>, <strong>health</strong> <strong>systems</strong> <strong>and</strong> <strong>health</strong> in Europe: country experience<br />
%<br />
Azerbaijan: Fig. 1 Economic <strong>and</strong> fiscal indicators 2000–2007 <strong>and</strong> 2008–2011<br />
60<br />
55<br />
50<br />
45<br />
40<br />
35<br />
30<br />
25<br />
20<br />
15<br />
10<br />
5<br />
0<br />
−5<br />
−10<br />
−15<br />
−20<br />
−25<br />
−30<br />
_ _<br />
_ _<br />
● ●<br />
_ _<br />
●<br />
●<br />
_ _<br />
_<br />
●<br />
_<br />
_<br />
_ _ _<br />
●<br />
_<br />
●<br />
● ●<br />
_ _ _<br />
_ _ _ _ _ _ _ _<br />
_ _<br />
●<br />
●<br />
_ _<br />
_<br />
● _ ●<br />
_<br />
●<br />
_ _ _ _ _<br />
_ _ _ _ _<br />
● ● ● ● ●<br />
_ _ _ _ _<br />
Year<br />
2000−2007 2008 2009 2010 2011<br />
_ _ _ _ _<br />
●<br />
●<br />
●<br />
●<br />
_ _ _ _<br />
Real GDP<br />
per capita growth<br />
Deficit/surplus<br />
(% GDP)<br />
Government<br />
spending<br />
(% GDP)<br />
Government<br />
<strong>health</strong> spending<br />
(% total government<br />
spending)<br />
Notes: Deficit/surplus: World Bank; Other indicators: WHO Health for All.<br />
10−year<br />
bond rates<br />
Unemployment<br />
rate<br />
Azerbaijan: Fig. 2 Trends in per capita spending on <strong>health</strong>, 2000–2011<br />
Public spending per capita OOP spending per capita Non−OOP private spending per capita<br />
Per capita spending $, PPP<br />
300<br />
200<br />
100<br />
0<br />
2000 2001 2002 2003 2004 2005 2006 2007 2008 2009 2010 2011<br />
100<br />
Growth %<br />
75<br />
50<br />
25<br />
0<br />
30<br />
Growth %<br />
20<br />
10<br />
0<br />
2000 2001 2002 2003 2004 2005 2006 2007 2008 2009 2010 2011<br />
Public spending<br />
per capita growth<br />
OOP spending<br />
per capita growth<br />
Non−OOP private spending<br />
per capita growth<br />
Note: Spending calculated from WHO Health for All.


