Web-economic-crisis-health-systems-and-health-web
Web-economic-crisis-health-systems-and-health-web Web-economic-crisis-health-systems-and-health-web
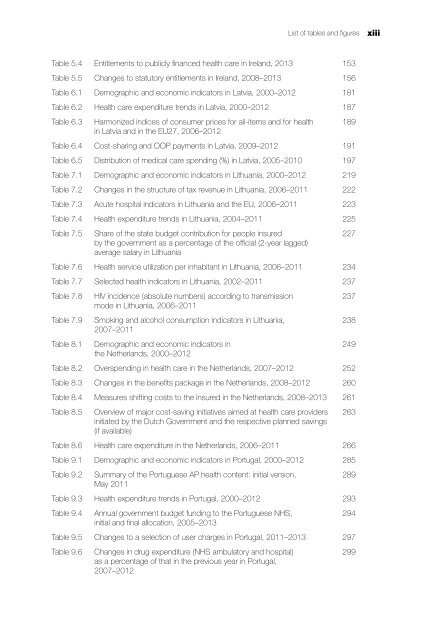
List of tables and figures xiii Table 5.4 Entitlements to publicly financed health care in Ireland, 2013 153 Table 5.5 Changes to statutory entitlements in Ireland, 2008–2013 156 Table 6.1 Demographic and economic indicators in Latvia, 2000–2012 181 Table 6.2 Health care expenditure trends in Latvia, 2000–2012 187 Table 6.3 Harmonized indices of consumer prices for all-items and for health in Latvia and in the EU27, 2006–2012 Table 6.4 Cost-sharing and OOP payments in Latvia, 2009–2012 191 Table 6.5 Distribution of medical care spending (%) in Latvia, 2005–2010 197 Table 7.1 Demographic and economic indicators in Lithuania, 2000–2012 219 Table 7.2 Changes in the structure of tax revenue in Lithuania, 2006–2011 222 Table 7.3 Acute hospital indicators in Lithuania and the EU, 2006–2011 223 Table 7.4 Health expenditure trends in Lithuania, 2004–2011 225 Table 7.5 Share of the state budget contribution for people insured by the government as a percentage of the official (2-year lagged) average salary in Lithuania Table 7.6 Health service utilization per inhabitant in Lithuania, 2006–2011 234 Table 7.7 Selected health indicators in Lithuania, 2002–2011 237 Table 7.8 Table 7.9 Table 8.1 HIV incidence (absolute numbers) according to transmission mode in Lithuania, 2006–2011 Smoking and alcohol consumption indicators in Lithuania, 2007–2011 Demographic and economic indicators in the Netherlands, 2000–2012 Table 8.2 Overspending in health care in the Netherlands, 2007–2012 252 Table 8.3 Changes in the benefits package in the Netherlands, 2008–2012 260 Table 8.4 Measures shifting costs to the insured in the Netherlands, 2008–2013 261 Table 8.5 Overview of major cost-saving initiatives aimed at health care providers initiated by the Dutch Government and the respective planned savings (if available) Table 8.6 Health care expenditure in the Netherlands, 2006–2011 266 Table 9.1 Demographic and economic indicators in Portugal, 2000–2012 285 Table 9.2 Summary of the Portuguese AP health content: initial version, May 2011 Table 9.3 Health expenditure trends in Portugal, 2000–2012 293 Table 9.4 Annual government budget funding to the Portuguese NHS, initial and final allocation, 2005–2013 Table 9.5 Changes to a selection of user charges in Portugal, 2011–2013 297 Table 9.6 Changes in drug expenditure (NHS ambulatory and hospital) as a percentage of that in the previous year in Portugal, 2007–2012 189 227 237 238 249 263 289 294 299
xiv Economic crisis, health systems and health in Europe: country experience Figures Part I: Case studies Fig. 1.1 Relative share of spending by sector as a proportion of total social 13 security spending in Belgium, 1990–2010 Fig. 1.2 Public and private health spending in Belgium in 2007 and 2011 15 as a percentage of total health spending Fig. 1.3 Spending by sector in Belgium in 2007 and 2011 as a 15 percentage of total health spending Fig. 1.4 Self-reported unmet need because health care was too expensive 30 by quintile of equivalized income, Belgium, 2013 Fig. 1.5 Self-reported unmet needs by quintile of equivalized income, 31 Belgium, 2004–2011 Fig. 2.1 Public expenditure on health as a share of total public expenditure (%) 51 in Estonia, 2007–2011 Fig. 2.2 Breakdown of total health expenditure by expenditure 53 source in Estonia, 2007 and 2011 Fig. 2.3 EHIF revenues, expenditures and reserves, 2001–2012 55 Fig. 2.4 Changes in EHIF expenditure by category, 2008–2016 57 Fig. 2.5 Composition of EHIF expenditure by categories, 2007–2012 57 Fig. 2.6 Revenue sources of national public health programmes implemented 59 by the National Institute for Health Development in Estonia , 2008–2013 Fig. 2.7 Health workers' hourly salary by categories in Estonia, 2008–2012 62 Fig. 2.8 OOP share of spending on EHIF-reimbursed medications, 2006–2012 63 Fig. 2.9 Population satisfaction (satisfied or very satisfied) with access to and 65 quality of care in Estonia, 2007–2012 Fig. 2.10 Number of EHIF-reimbursed prescription drugs per insured and 65 average cost per prescription to the EHIF and to the insured in Estonia, 2007–2012 Fig. 2.11 Average life expectancy at birth in Estonia, 2001–2011 67 Fig. 3.1 Household mortgage debt in France as percentage of disposable 78 income, 1991–2007 Fig. 3.2 Percentage of government spending by sector in France, 81 in 2007 and 2011 Fig. 3.3 Percentage of total expenditure on health according to source 83 of revenue in France, in 2007 and 2011 Fig. 3.4 Debt rate of public hospitals in France, 2002–2010 87 Fig. 3.5 Evolution of private health expenditure and net income 89 in France, 1995–2012 Fig. 3.6 Private health expenditure by percentile of health service users 90 in France, 2008–2010 Fig. 4.1 Health expenditure as a percentage of GDP in Greece, 2003–2012 109 Fig. 4.2 Government spending on health by sector in Greece, 2009–2012 113 Fig. 4.3 Instances of new HIV infections by transmission category 129 in Greece, 2008–2012 Fig. 5.1 Public health expenditure (capital plus current) in Ireland, 2000–2013 146
- Page 1 and 2: Economic crisis, health systems and
- Page 3 and 4: The European Observatory on Health
- Page 5 and 6: Keywords: DELIVERY OF HEALTH CARE E
- Page 7 and 8: vi Economic crisis, health systems
- Page 9 and 10: viii Economic crisis, health system
- Page 11 and 12: List of abbreviations ACS Health in
- Page 13: List of tables and figures Tables P
- Page 17 and 18: xvi Economic crisis, health systems
- Page 19 and 20: xviii Economic crisis, health syste
- Page 21 and 22: xx Economic crisis, health systems
- Page 23 and 24: xxii Economic crisis, health system
- Page 25 and 26: xxiv Economic crisis, health system
- Page 27 and 28: xxvi Economic crisis, health system
- Page 29 and 30: Acknowledgements This book represen
- Page 31 and 32: Preface This book maps health polic
- Page 34: Part I Country case studies
- Page 37 and 38: 4 Economic crisis, health systems a
- Page 39 and 40: 6 Economic crisis, health systems a
- Page 41 and 42: 8 Economic crisis, health systems a
- Page 43 and 44: 10 Economic crisis, health systems
- Page 45 and 46: 12 Economic crisis, health systems
- Page 47 and 48: 14 Economic crisis, health systems
- Page 49 and 50: 16 Economic crisis, health systems
- Page 51 and 52: 18 Economic crisis, health systems
- Page 53 and 54: 20 Economic crisis, health systems
- Page 55 and 56: 22 Economic crisis, health systems
- Page 57 and 58: 24 Economic crisis, health systems
- Page 59 and 60: 26 Economic crisis, health systems
- Page 61 and 62: 28 Economic crisis, health systems
- Page 63 and 64: 30 Economic crisis, health systems
List of tables <strong>and</strong> figures<br />
xiii<br />
Table 5.4 Entitlements to publicly financed <strong>health</strong> care in Irel<strong>and</strong>, 2013 153<br />
Table 5.5 Changes to statutory entitlements in Irel<strong>and</strong>, 2008–2013 156<br />
Table 6.1 Demographic <strong>and</strong> <strong>economic</strong> indicators in Latvia, 2000–2012 181<br />
Table 6.2 Health care expenditure trends in Latvia, 2000–2012 187<br />
Table 6.3<br />
Harmonized indices of consumer prices for all-items <strong>and</strong> for <strong>health</strong><br />
in Latvia <strong>and</strong> in the EU27, 2006–2012<br />
Table 6.4 Cost-sharing <strong>and</strong> OOP payments in Latvia, 2009–2012 191<br />
Table 6.5 Distribution of medical care spending (%) in Latvia, 2005–2010 197<br />
Table 7.1 Demographic <strong>and</strong> <strong>economic</strong> indicators in Lithuania, 2000–2012 219<br />
Table 7.2 Changes in the structure of tax revenue in Lithuania, 2006–2011 222<br />
Table 7.3 Acute hospital indicators in Lithuania <strong>and</strong> the EU, 2006–2011 223<br />
Table 7.4 Health expenditure trends in Lithuania, 2004–2011 225<br />
Table 7.5<br />
Share of the state budget contribution for people insured<br />
by the government as a percentage of the official (2-year lagged)<br />
average salary in Lithuania<br />
Table 7.6 Health service utilization per inhabitant in Lithuania, 2006–2011 234<br />
Table 7.7 Selected <strong>health</strong> indicators in Lithuania, 2002–2011 237<br />
Table 7.8<br />
Table 7.9<br />
Table 8.1<br />
HIV incidence (absolute numbers) according to transmission<br />
mode in Lithuania, 2006–2011<br />
Smoking <strong>and</strong> alcohol consumption indicators in Lithuania,<br />
2007–2011<br />
Demographic <strong>and</strong> <strong>economic</strong> indicators in<br />
the Netherl<strong>and</strong>s, 2000–2012<br />
Table 8.2 Overspending in <strong>health</strong> care in the Netherl<strong>and</strong>s, 2007–2012 252<br />
Table 8.3 Changes in the benefits package in the Netherl<strong>and</strong>s, 2008–2012 260<br />
Table 8.4 Measures shifting costs to the insured in the Netherl<strong>and</strong>s, 2008–2013 261<br />
Table 8.5<br />
Overview of major cost-saving initiatives aimed at <strong>health</strong> care providers<br />
initiated by the Dutch Government <strong>and</strong> the respective planned savings<br />
(if available)<br />
Table 8.6 Health care expenditure in the Netherl<strong>and</strong>s, 2006–2011 266<br />
Table 9.1 Demographic <strong>and</strong> <strong>economic</strong> indicators in Portugal, 2000–2012 285<br />
Table 9.2<br />
Summary of the Portuguese AP <strong>health</strong> content: initial version,<br />
May 2011<br />
Table 9.3 Health expenditure trends in Portugal, 2000–2012 293<br />
Table 9.4<br />
Annual government budget funding to the Portuguese NHS,<br />
initial <strong>and</strong> final allocation, 2005–2013<br />
Table 9.5 Changes to a selection of user charges in Portugal, 2011–2013 297<br />
Table 9.6<br />
Changes in drug expenditure (NHS ambulatory <strong>and</strong> hospital)<br />
as a percentage of that in the previous year in Portugal,<br />
2007–2012<br />
189<br />
227<br />
237<br />
238<br />
249<br />
263<br />
289<br />
294<br />
299


