The Alberta Report - COAA Major Projects Benchmarking Summary
The Alberta Report - COAA Major Projects Benchmarking Summary
The Alberta Report - COAA Major Projects Benchmarking Summary

Create successful ePaper yourself
Turn your PDF publications into a flip-book with our unique Google optimized e-Paper software.
<strong>The</strong> <strong>Alberta</strong> <strong>Report</strong><br />
<strong>COAA</strong> <strong>Major</strong> <strong>Projects</strong> <strong>Benchmarking</strong> <strong>Summary</strong><br />
February 2009
Prepared for:<br />
<strong>Alberta</strong> Finance and Enterprise, <strong>Alberta</strong> Energy<br />
Construction Owners Association of <strong>Alberta</strong> (<strong>COAA</strong>)<br />
Sponsored by:<br />
<strong>Alberta</strong> Finance and Enterprise, <strong>Alberta</strong> Energy<br />
Construction Owners Association of <strong>Alberta</strong> (<strong>COAA</strong>)<br />
Under Research Contract: UTA05-782
Table of Contents<br />
List of Tables ....................................................................................................................................... i<br />
List of Figures..................................................................................................................................... ii<br />
Executive <strong>Summary</strong> .......................................................................................................................... iv<br />
1 Introduction .................................................................................................................................. 1<br />
1.1 Background......................................................................................................................... 1<br />
1.2 <strong>COAA</strong> / CII Partnership....................................................................................................... 2<br />
1.3 Research Objectives........................................................................................................... 4<br />
1.4 Scope and Approach .......................................................................................................... 4<br />
2 <strong>COAA</strong> <strong>Major</strong> <strong>Projects</strong> <strong>Benchmarking</strong> System and Data Collection........................................ 7<br />
2.1 Development of <strong>Alberta</strong> <strong>Benchmarking</strong> System ................................................................. 7<br />
2.2 Hierarchical Structure for Project Comparison ................................................................. 10<br />
2.3 Project Key <strong>Report</strong>............................................................................................................ 11<br />
3 <strong>COAA</strong> Project Performance and Productivity Metrics........................................................... 14<br />
3.1 General Metrics................................................................................................................. 14<br />
3.1.1 Project Performance Metrics.................................................................................. 14<br />
3.1.2 Engineering and Construction Productivity Metrics ............................................... 14<br />
3.1.3 Practices ................................................................................................................ 15<br />
3.2 <strong>COAA</strong>-Specific Metrics ..................................................................................................... 15<br />
3.3 Understanding <strong>Benchmarking</strong> <strong>Report</strong>s and Analyses ...................................................... 17<br />
3.3.1 Metrics.................................................................................................................... 17<br />
3.3.2 Explanation of Statistics......................................................................................... 18<br />
4 Data Analysis ............................................................................................................................. 20<br />
4.1 Description of <strong>Alberta</strong> Dataset .......................................................................................... 20<br />
4.2 Selected Descriptive Analyses ......................................................................................... 22<br />
4.3 Selected Inferential Analyses ........................................................................................... 25<br />
4.4 Comparison of <strong>Alberta</strong> and U.S. Project Performance ..................................................... 32<br />
4.5 Engineering Productivity ................................................................................................... 35<br />
4.6 Construction Productivity .................................................................................................. 38<br />
4.7 Analysis of Impact Factors................................................................................................ 44<br />
5 <strong>Major</strong> Findings ........................................................................................................................... 49<br />
5.1 Project Performance ......................................................................................................... 49<br />
5.2 Productivity ....................................................................................................................... 51<br />
5.3 Impact Factors .................................................................................................................. 51<br />
5.4 Project Management......................................................................................................... 52<br />
6 Conclusions and Recommendations ...................................................................................... 53<br />
Appendices ....................................................................................................................................... 55<br />
Appendix A: <strong>Summary</strong> of Correlation between Project Performance and Related Factors of<br />
<strong>Alberta</strong> Based <strong>Projects</strong> ............................................................................................... 56<br />
Appendix B: Performance Metric Formulas and Definitions......................................................... 60<br />
Appendix C: Glossary ...................................................................................................................... 69<br />
References ........................................................................................................................................ 74<br />
i
List of Tables<br />
Table 2-1 Comparison Algorithm of <strong>Alberta</strong> Project Performance Metrics ........................................ 10<br />
Table 2-2 Comparison Algorithm of <strong>Alberta</strong> Engineering and Construction Productivity Metrics ......... 10<br />
Table 2-3 Hierarchical Structure of <strong>Alberta</strong> Project Types.................................................................. 11<br />
Table 3-1 Additional Study-Specific Performance Metrics.................................................................. 16<br />
Table 4-1 Submitted <strong>Projects</strong> by Owners and Contractors at Project Completion and Sanction ....... 21<br />
Table 5-1 <strong>The</strong> Top 5 Factors Affecting Cost, Schedule or Productivity .............................................. 52<br />
Table A-1 Correlations of Project Characteristics with Project Performance...................................... 53<br />
Table A-2 Correlations of Project Characteristics with Project Performance (Cont’d)........................ 54<br />
Table A-3 Correlations of Project Characteristics with Project Performance (Cont’d)........................ 55<br />
Table A-4 Correlations of Project Characteristics with Project Performance (Cont’d)........................ 56<br />
i
List of Figures<br />
Figure 2-1 Development Process of <strong>Alberta</strong> <strong>Benchmarking</strong> System.................................................... 7<br />
Figure 2-2 Number of Submitted Project Data...................................................................................... 9<br />
Figure 2-3 Sample of Project Cost and Schedule Performance Metrics ............................................ 12<br />
Figure 2-4 Sample of Project Engineering Productivity Metrics.......................................................... 13<br />
Figure 2-5 Sample of Project Construction Productivity Metrics......................................................... 13<br />
Figure 3-1 Example of Performance Metrics....................................................................................... 17<br />
Figure 3-2 Example of Practice Metrics .............................................................................................. 17<br />
Figure 3-3 Box and Whisker Diagram ................................................................................................. 18<br />
Figure 4-1 Number of Submitted <strong>Projects</strong> by Project Nature and Delivery System............................ 21<br />
Figure 4-2 Number of <strong>Projects</strong> Submitted at Sanction and Completion by Total Project Cost Category<br />
($CDN in 2007) .................................................................................................................. 22<br />
Figure 4-3 Construction Indirect / Direct Work hours (%) ................................................................... 23<br />
Figure 4-4 Construction Indirect Cost / Total Project Cost (%)........................................................... 23<br />
Figure 4-5 Modularization by Project Nature....................................................................................... 24<br />
Figure 4-6 Project Cost Growth by Project Delivery System .............................................................. 25<br />
Figure 4-7 Project Schedule Growth by Project Delivery System....................................................... 25<br />
Figure 4-8 Effect of % Engineering Completed before Construction Started ..................................... 26<br />
Figure 4-9 Actual / Estimated Number of Peak Construction Workforce............................................ 27<br />
Figure 4-10 Construction Indirect Work-hours/ Direct Work hours (%) .............................................. 28<br />
Figure 4-11 Construction Indirect Cost Growth by Project Size ($) .................................................... 28<br />
Figure 4-12 Project Risk Assessment vs. Project Cost Growth .......................................................... 29<br />
Figure 4-13 Constructability vs. Project Schedule Growth.................................................................. 30<br />
Figure 4-14 Planning for Startup vs. Startup Phase Cost Growth ...................................................... 31<br />
Figure 4-15 Workface Planning vs. Construction Schedule Growth................................................... 31<br />
Figure 4-16 Project Size ($M CDN, in 2007)....................................................................................... 32<br />
Figure 4-17 Contingency Budget (%).................................................................................................. 33<br />
Figure 4-18 Project Cost Growth......................................................................................................... 34<br />
Figure 4-19 Project Schedule Growth ................................................................................................. 34<br />
Figure 4-20 Development and Scope Change Cost Factor ................................................................ 35<br />
Figure 4-21 Comparison of Project Size ($M CDN, in 2007) for Engineering Productivity Dataset ... 36<br />
Figure 4-22 Comparison of Concrete Engineering Productivity (WH/ Cubic Meter)........................... 37<br />
Figure 4-23 Comparison of Structural Steel Engineering Productivity (WH/ Metric Ton) ................... 37<br />
ii
Figure 4-24 Comparison of Piping Engineering Productivity (WH/ Linear Meter)............................... 38<br />
Figure 4-25 Comparison of Project Size ($M CDN, in 2007) for Construction Productivity................ 39<br />
Figure 4-26 Comparison of Total Concrete Construction Productivity (WH/ m 3 )................................ 40<br />
Figure 4-27 Comparison of Total Structural Steel Construction Productivity (WH/ Metric Ton) ......... 40<br />
Figure 4-28 Comparison of Instrumentation- Devices Construction Productivity (WH/ Count) .......... 41<br />
Figure 4-29 Comparison of Insulation- Piping Construction Productivity (WH/ Linear Meter)............ 42<br />
Figure 4-30 Construction Productivity Project Level Index vs. Project Size ($M CDN, in 2007) ........ 42<br />
Figure 4-31 Actual / Estimated Construction Productivity Rate by Work Discipline ........................... 43<br />
Figure 4-32 Actual / Estimated Total Installed Unit Cost (TIUC) by Work Discipline.......................... 44<br />
Figure 4-33 Factors Impacting Project Cost........................................................................................ 46<br />
Figure 4-34 Impact of Factors vs. Cost Growth.................................................................................... 46<br />
Figure 4-35 Factors Impacting Project Schedule................................................................................ 47<br />
Figure 4-36 Impact of Factors vs. Schedule Growth ............................................................................ 47<br />
Figure 4-37 Factors Impacting Construction Productivity (Field Productivity) .................................... 48<br />
Figure 4-38 Impact of Factors vs. Project Construction Productivity (CPM)......................................... 49<br />
Figure 5-1 Project Change Cost Factor vs. Project Cost Growth ......................................................... 51<br />
iii
Executive <strong>Summary</strong><br />
<strong>The</strong> Construction Owners Association of <strong>Alberta</strong> (<strong>COAA</strong>) as the principal industry association for<br />
heavy industrial construction in <strong>Alberta</strong> provides leadership to enable our owner members to be<br />
successful in their drive for safe, effective and productive project execution. <strong>The</strong> heavy industrial<br />
construction sector represents a significant portion of the GDP in <strong>Alberta</strong> with announced major<br />
projects in excess of $100B. In 2008, the Oil Sands sector in particular was forecasting significant<br />
capital expenditures of $10B per year in 2009, rising to $15B by 2015. This level of construction<br />
activity has strained the industries’ ability to execute the work effectively and has led to significant<br />
concerns about low productivity along with cost and schedule overruns. With these concerns in mind<br />
the <strong>COAA</strong> embarked on a benchmarking initiative in 2003, engaging the Construction Industry<br />
Institute (CII) at the University of Texas in Austin to develop a benchmarking system which would<br />
assess project performance considering the unique characteristics of <strong>Alberta</strong> major projects. <strong>The</strong> CII<br />
has extensive experience benchmarking projects in the United States and globally, permitting<br />
comparisons between <strong>Alberta</strong> projects and similar projects in the CII database. This report<br />
summarizes the results of the first series of project assessments completed in October 2008.<br />
A total of 78 <strong>Alberta</strong> projects were initiated in the benchmarking system since December 2005 and of<br />
these 37 completed the data input required for benchmarking analysis at the cut off for this report in<br />
August 2008. Twenty-seven of the 37 projects in this study were related to the Oil Sands sector with<br />
only natural gas processing (4) and pipeline (2) sectors submitting more than one project. About half<br />
of the projects were grass roots with additions (38%) and modernizations (11%) making up the<br />
balance. Execution strategies varied with almost half of the projects using parallel primes; designbuild<br />
was the second most frequent strategy at 32% of the projects. Project sizes varied from
<strong>The</strong> average cost growth for <strong>Alberta</strong> projects was 19% and average schedule growth was 17%. Cost<br />
growth was generally lower as the % engineering completed increased and more effective Project<br />
Risk Assessment also reduced project cost growth. Constructability assessments lead to reduced<br />
schedule growth but had no impact on cost growth. Indirect costs averaged about 21% of total<br />
project costs and indirect cost growth increased as the project size increased. As for other project<br />
best practices, Planning for Start-up reduced the cost growth in start-up but there was no detectable<br />
correlation between Workface Planning and construction schedule growth, although there were only<br />
7 data points in this assessment.<br />
A number of comparisons were made between <strong>Alberta</strong> and comparable U.S. projects. Although the<br />
comparison is for similar industrial projects, no adjustment has been made to account for the<br />
differences in project size, the prevailing economy while the projects were built and other potentially<br />
significant project drivers. <strong>The</strong> median project size in the <strong>Alberta</strong> dataset is $186M vs. $40M for the<br />
U.S. dataset. Project cost growth was much higher in <strong>Alberta</strong> (19%) vs. the U.S. (3%) and <strong>Alberta</strong><br />
project cost growth had much wider range (-27% to 69%). Development and scope changes were<br />
similar between <strong>Alberta</strong> and the U.S..<br />
Engineering productivity is measured as the ratio of direct engineering hours per installed quantity in<br />
the field (e.g., for structural steel, hours per ton of steel; lower is better). In a similar way,<br />
construction productivity is measured as the ratio of field direct work hours per installed quantity (e.g.,<br />
for structural steel, hours per ton of steel; again, lower is better). All comparisons noted below<br />
between the <strong>Alberta</strong> and U.S. data sets are based on weighted averages (i.e., larger projects count<br />
more in the average productivity than smaller projects).<br />
Engineering productivity for concrete was better in <strong>Alberta</strong> vs. the U.S. (3.5 vs. 6.3); structural steel<br />
engineering productivity was worse in <strong>Alberta</strong> vs. the U.S. (12.6 vs. 5.9) while piping engineering<br />
productivity is comparable (1.28 vs. 1.23).<br />
Construction productivity for concrete is worse in <strong>Alberta</strong> vs. the U.S. (13.1 vs. 9.8) and<br />
instrumentation devices productivity is much worse in <strong>Alberta</strong> (21.4 vs. 8.3), although the nonweighted<br />
average between the two was comparable, so further research into this comparison is<br />
warranted. Construction productivity for structural steel was comparable between the two datasets<br />
(about 38) while insulation productivity was better (1.4 vs. 2.2) in <strong>Alberta</strong>.<br />
To sum up the results to date, productivity is better in <strong>Alberta</strong> for some disciplines but worse (or<br />
much worse) for others, so the productivity picture is mixed. Average wage rates in <strong>Alberta</strong> are<br />
v
higher than the U.S., particularly when compared to the U.S. Gulf Coast where many of the heavy<br />
industrial projects occur, so improved productivity in <strong>Alberta</strong> will enhance competitive advantage.<br />
Furthermore, indirect costs are higher in <strong>Alberta</strong>. All this helps explain the significantly higher cost<br />
growth in <strong>Alberta</strong> vs. the U.S. data. <strong>The</strong> <strong>COAA</strong> and its members have developed and are<br />
implementing a number of initiatives such as Work Face Planning and Re-Work Reduction that will<br />
help improve project productivity. <strong>The</strong> reduced pace of project development in <strong>Alberta</strong> in the near<br />
term should also contribute to improved project execution.<br />
Companies that submitted data are given customized reports which show the comparison of their<br />
projects against the <strong>Alberta</strong> and U.S. datasets. This will help determine strengths and weaknesses<br />
and should lead to better project execution in future, which in the end is the goal of all benchmarking<br />
work. <strong>The</strong> <strong>COAA</strong> is considering extending the benchmarking initiative for another 2 years to allow<br />
submission of additional projects which will strengthen the data analysis and improve our insight into<br />
causes of and potential solutions to poor project performance.<br />
<strong>The</strong> <strong>COAA</strong> would like to thank the <strong>Benchmarking</strong> Committee and in particular the current and past<br />
committee co-chairs, Steve Revay of Revay and Associates, Larry Sondrol of Suncor and Donald<br />
Mousseau of Husky Energy Inc. for their outstanding efforts. <strong>The</strong> <strong>COAA</strong> is also indebted to CII for<br />
their expertise and efforts and to the Government of <strong>Alberta</strong> who helped fund this study.<br />
vi
1 Introduction<br />
<strong>The</strong> oil sands industry plays a crucial role in Canada’s global economic position and the delivery of<br />
energy to the world. In fact, Canada’s oil reserves are second in the world behind Saudi Arabia<br />
(OSDG, 2008). Of these reserves, 97 percent are oil sands. Commercial production of the oil sands<br />
began over 40 years ago and current output is expected to triple by 2020 (ibid.). <strong>The</strong> advances that<br />
have been made in surface mining and in-situ production technologies have been driving the rapid<br />
pace of development of the oil sands reserves. Over the past 11 years, a total of $102 Billion (CDN)<br />
was spent on construction and operation capital necessary to develop these resources. Some have<br />
projected that through 2012, an additional $205 Billion (CDN) could be invested given favorable<br />
economic conditions.<br />
<strong>The</strong> realities of the oil sands resource and the Canadian energy industry place tremendous demands<br />
on companies engaged in the efficient and effective execution of capital projects. This report<br />
chronicles the efforts made by owners, contractors, and other stakeholders in their delivery of capital<br />
projects in the heavy industry sector in <strong>Alberta</strong>. Using estimated and completed capital projects as<br />
its basis, the report examines project performance from cost, schedule, change, rework, safety, and<br />
productivity standpoints. It recognizes the uniqueness of heavy industrial projects in <strong>Alberta</strong>,<br />
projects often characterized by their remote locations and challenges posed by severe weather. <strong>The</strong><br />
story of their development is a compelling one.<br />
<strong>The</strong> Construction Industry Institute (CII) was selected by <strong>COAA</strong> to explore the performance and<br />
productivity concerning the execution of capital projects in <strong>Alberta</strong>. This selection was premised on<br />
the extensive experience of CII in researching and benchmarking industrial facilities in the United<br />
States and around the world. Extending CII’s reach into <strong>Alberta</strong> permitted tremendous<br />
understanding of the performance of these projects, especially when compared with similar projects<br />
in the United States. <strong>The</strong> results obtained through this study are both surprising and expected.<br />
Using quantitative methods, the report dispels common myths regarding project execution in <strong>Alberta</strong><br />
while establishing a solid footing for the future study of additional projects.<br />
1.1 Background<br />
<strong>Benchmarking</strong> has long been used to improve the process of manufacturing. It is the continuous and<br />
systematic process of measuring one’s own performance against the results of recognized leaders<br />
for the purpose of finding best practices that lead to superior performance when implemented. In the<br />
capital projects industry, benchmarking is primarily used at the project level to help participants<br />
1
identify gaps in their work processes which lead to compromised performance. For a given company,<br />
benchmarking provides sets of external comparisons to its peer group that can be used to establish<br />
improvement goals and objectively understand what “best in class” performance means.<br />
<strong>The</strong> execution of capital projects in <strong>Alberta</strong> is truly unique. It is one of few geographic areas that has<br />
such a great prevalence of capital projects. At last estimate, over 240,000 people were engaged in<br />
the development of the oil sands resources in <strong>Alberta</strong> (OSDG, 2008). In fact, construction comprised<br />
9.0% of <strong>Alberta</strong>’s gross domestic product (GDP) in 2007 (AFE, 2008). Spending on the Athabasca<br />
Oil Sands resource in particular rose to $37.7 Billion (CDN) in 2007 (ibid.). However, this dramatic<br />
amount of growth has also brought its challenges. Increasing pressures on capital projects have<br />
been created due to significant worldwide cost escalations and labour shortages. This has led to the<br />
creation of many perceptions regarding the potential loss of productivity or excessive indirect costs,<br />
for example.<br />
<strong>The</strong> purpose of this study was to quantitatively assess the performance of capital projects in <strong>Alberta</strong>.<br />
<strong>The</strong> combined resources of <strong>COAA</strong>, CII, and <strong>Alberta</strong> Finance and Enterprise were directed to<br />
objectively measure the performance of actual projects planned and executed in <strong>Alberta</strong> within the<br />
past seven or eight years. While it was not possible to obtain measures of every aspect of project<br />
performance, this study does provide data necessary to gain new insights to the results of <strong>Alberta</strong>’s<br />
heavy industry sector projects. It directly addresses many common perceptions regarding<br />
engineering and construction productivity and it provides a baseline of project data that can be used<br />
to help improve the work processes used by companies developing projects in <strong>Alberta</strong>.<br />
1.2 <strong>COAA</strong> / CII Partnership<br />
As the principal industry association for capital projects in <strong>Alberta</strong>, the Construction Owners<br />
Association of <strong>Alberta</strong> (<strong>COAA</strong>) strives to provide leadership to enable owner members to be<br />
successful in their drive for safe, effective and productive project execution. Principal members of<br />
<strong>COAA</strong> include the users of construction services in capital expansion plans. Indeed, <strong>COAA</strong><br />
represents a broad cross-section of owners' interests which are associated with many sectors of the<br />
<strong>Alberta</strong> construction community. <strong>COAA</strong> also includes Associate Members which provide<br />
construction services and other activities. <strong>COAA</strong>’s mission is to assist its members in achieving<br />
excellence in the execution of capital projects by:<br />
• Creating and promoting Best Practices in the construction industry<br />
• Serving as a voice for owners to stakeholders that can make a difference<br />
2
• Providing a forum for dialogue and debate among owners, contractors, labour providers and<br />
government<br />
• Bringing new ideas to the construction industry and to government leaders<br />
Headquartered at the University of Texas at Austin, CII is a consortium of leading owners,<br />
engineering and construction contractors, and suppliers that have come together to improve the cost<br />
effectiveness of capital projects. As the major public benchmarking resource in the capital projects<br />
industry, CII has over 15 years experience in benchmarking capital project delivery and best<br />
practices. CII was formed in 1983 by 28 organizations based on recommendations from an intensive<br />
five year study of the engineering and construction industry, known as the Construction Industry Cost<br />
Effectiveness (CICE) project. Today, there are 117 members around the world engaged in capital<br />
projects. Over the past 25 years, CII has partnered industry practitioners with academia to study the<br />
capital projects industry to create a vast array of knowledge. In fact, CII research products have<br />
been widely disseminated throughout the industry through publications, conferences and workshops<br />
and have led to the creation of a number of best practices.<br />
CII started its <strong>Benchmarking</strong> and Metrics (BM&M) program in 1993 with an initial purpose to validate<br />
the benefit of best practices and to support CII research. Today, CII’s BM&M program employs 10<br />
staff members to advance project performance through benchmarking research. Over the years, an<br />
online benchmarking system known as Project Central has been developed to allow benchmarking<br />
participants known as <strong>Benchmarking</strong> Associates (BA’s) to enter project data and get real-time<br />
feedback 24 hours per day. BA training is provided three times a year to ensure understanding of<br />
CII metrics and compliance with standard data definitions. As of 2008, over 800 BAs have been<br />
trained and a total of 1,738 projects representing over $81 Billion (USD) have been collected from<br />
leading construction owners and contractors around the world.<br />
Building on the collective expertise of <strong>COAA</strong> and CII, a research contract was established in 2005<br />
between the two organizations for the purpose of benchmarking capital projects in <strong>Alberta</strong>. It was<br />
funded by <strong>COAA</strong> with assistance from <strong>Alberta</strong> Finance and Enterprise, a component of the provincial<br />
government of <strong>Alberta</strong>. Besides this research report, the contract established a comprehensive<br />
benchmarking system comprised of a customized questionnaire, a dedicated database, and a suite<br />
of individualized reports for each company submitting project data. <strong>The</strong> relationship between <strong>COAA</strong><br />
and CII has been very productive and has yielded many discoveries regarding <strong>Alberta</strong>’s heavy<br />
industry sector capital projects, many of which are presented here.<br />
3
1.3 Research Objectives<br />
<strong>The</strong> purpose of the research was to develop a benchmarking system to assess the performance of<br />
<strong>Alberta</strong> major projects considering factors unique to their execution, to permit analysis of this<br />
performance over time, and to include measures of engineering and field productivity. In particular,<br />
specific research objectives included:<br />
1) Identification of <strong>Alberta</strong> metric requirements<br />
2) Development of a customized benchmarking questionnaire based upon the CII questionnaire,<br />
but tailored to the characteristics and environment of <strong>Alberta</strong> projects<br />
3) Establishment of a set of benchmarks for <strong>Alberta</strong> projects using the customized<br />
questionnaire<br />
4) Documentation of <strong>Alberta</strong> project performance against the <strong>Alberta</strong> benchmarks<br />
5) Identification and documentation of factors and practices impacting project performance<br />
As the research evolved from 2005 to 2008, <strong>COAA</strong>’s benchmarking committee worked directly with<br />
CII benchmarking and metrics staff members to continually refine the research program, its<br />
questionnaire and its information technology (IT) tools. For example, besides including additional<br />
data definitions for <strong>Alberta</strong> projects, specific <strong>COAA</strong> best practices such as Workface Planning were<br />
added to the research’s customized questionnaire. Taken together, these efforts have produced a<br />
premier benchmarking research program for <strong>Alberta</strong> projects.<br />
1.4 Scope and Approach<br />
This research program used the principal components of CII’s benchmarking research program as its<br />
foundation. CII’s existing large project questionnaire for heavy industry sector projects was used as<br />
a basis for the <strong>COAA</strong> questionnaire. A series of development meetings was held in 2005, 2006, and<br />
2007 between <strong>COAA</strong>’s benchmarking committee and CII benchmarking and metrics staff to create<br />
and prioritize new metrics specific to <strong>Alberta</strong> capital projects. This led to the programming of a<br />
customized web-based data collection instrument and key report.<br />
Throughout the study period, and into 2008, CII conducted seven training sessions for <strong>COAA</strong><br />
participants in this study. <strong>The</strong>se individuals, known as <strong>COAA</strong> <strong>Benchmarking</strong> Associates (BA’s), were<br />
given access to the online system and key reports. Using the knowledge gained in training, these<br />
BA’s collected project-specific data and entered them into the online system. Subsequently, they<br />
worked with CII staff to validate their data to ensure conformance to accepted definitions. Finally,<br />
4
the BA’s used the information contained within the key reports to communicate knowledge gained<br />
about their projects to their individual firms in order to improve key work processes.<br />
<strong>The</strong> final aspect of this research program was the creation of this report, entitled the “<strong>Alberta</strong> <strong>Report</strong>”.<br />
This report is intended to examine all the projects collected through this research to identify common<br />
factors or new findings concerning the execution of capital projects in <strong>Alberta</strong>. It is also the means of<br />
communication regarding the entirety of this research. Consequently, this report describes not only<br />
the interesting findings of this research, but also the system used to collect, analyze, and<br />
disseminate this information. <strong>The</strong> contents of this report have been distilled to provide commentary<br />
only on the most critical aspects and results of this research effort. Certainly, other queries<br />
regarding the collected project data were investigated, but only the most statistically significant are<br />
presented here.<br />
This research was intended to provide the first step in the dedicated study of heavy industry sector<br />
capital projects in <strong>Alberta</strong>. Future steps are planned. Principally, this report provides quantitative<br />
assessments of <strong>Alberta</strong> oil sands projects. It can be used to:<br />
1) Aid understanding of generalized, current perspectives of project performance in <strong>Alberta</strong><br />
2) Aid understanding of the benefits obtained through best practice use in the management of<br />
capital projects<br />
3) Aid understanding of the drivers for improved capital project performance, especially in the<br />
areas of planning, estimating, and productivity<br />
4) Plan for improvements to work processes to execute capital projects more effectively<br />
Importantly, this report should not be used to estimate any current or future projects. Results should<br />
not be extrapolated to projects beyond those studied as, by definition, every project is both<br />
temporary and unique. Results contained herein pertain only to those projects submitted for analysis;<br />
projects which were executed by particular individuals in particular periods of time. Continued<br />
benchmarking is recommended to maximize the benefits received.<br />
Acknowledgement<br />
Funding for this research was provided by both the Government of <strong>Alberta</strong> and <strong>COAA</strong>. In addition,<br />
this study would not have been possible without the endless support from the <strong>COAA</strong> <strong>Alberta</strong> <strong>Major</strong><br />
<strong>Projects</strong> <strong>Benchmarking</strong> Committee. <strong>The</strong> individuals who collected and submitted their project data<br />
through this study are greatly appreciated, though their names are not listed due to confidentiality<br />
5
policies which are in effect. Members of the <strong>COAA</strong> <strong>Alberta</strong> <strong>Major</strong> <strong>Projects</strong> <strong>Benchmarking</strong> Committee<br />
are listed next.<br />
<strong>The</strong> <strong>COAA</strong> <strong>Alberta</strong> <strong>Major</strong> <strong>Projects</strong> <strong>Benchmarking</strong> Committee<br />
Steve Revay*, Revay and Associates Limited<br />
Larry Sondrol*, Suncor Energy Inc.<br />
Donald Mousseau**, Husky Energy Inc.<br />
Patricia Armitage, <strong>Alberta</strong> Finance and Enterprise<br />
Aamer Ahmed, Shell Canada Limited<br />
Billy Bai, Ledcor<br />
Bob Montgomery, Colt Engineering<br />
Dale Elmer, Flint Energy<br />
Dave Williams – Bantrel<br />
Douglas Shako, Flint Energy<br />
Ed Catolico, WorleyParsons Ltd.<br />
Mahendra Bhatia – Suncor Energy Inc.<br />
Mel Otteson, Imperial Oil Resources Ltd.<br />
Greg Sillak, BA Energy<br />
Greg Taylor, Nexen Inc.<br />
Hans Raj, Colt Engineering<br />
Jared Wharton, EPCOR<br />
Johnnas Jagonos, Flint Energy<br />
Jennifer Koivuneva, Jacobs<br />
Korey Jackson, Stantec<br />
Lea Chambers, Golder Associates Ltd.<br />
Lubo Iliev, Petro-Canada<br />
Renee Roberge, Flint Energy<br />
Rheal Guenette, Shell Canada Limited<br />
Richard Haack, Shell Canada Limited<br />
Stephan Chudleigh, Flint Energy<br />
Tim Silbernagel, Bantrel<br />
Umesh Krishnappa, Suncor Energy Inc.<br />
Vladimir Deriabine, Petro-Canada<br />
Warren Rogers, Flint Energy<br />
Include past members and denote them as such<br />
*current chairs<br />
**past chairs<br />
6
2 <strong>COAA</strong> <strong>Major</strong> <strong>Projects</strong> <strong>Benchmarking</strong> System and Data Collection<br />
<strong>Benchmarking</strong> has been recognized as a core component of continuous improvement programs in<br />
the capital projects industry. Implementing specific benchmarking approaches on <strong>Alberta</strong>-based<br />
projects will provide the participating companies with a systematic process to measure project<br />
performance, enable external comparisons with peers’ projects, and establish project objectives.<br />
Moreover, a comprehensive benchmarking system can identify areas for work process improvement.<br />
This was the basis for the development of the <strong>Alberta</strong> <strong>Benchmarking</strong> System.<br />
2.1 Development of <strong>Alberta</strong> <strong>Benchmarking</strong> System<br />
This research comprises the first round of benchmarking heavy industry sector projects in <strong>Alberta</strong>.<br />
Accordingly, a significant amount of time and effort was spent by <strong>COAA</strong>’s benchmarking committee<br />
and CII benchmarking program staff to develop the <strong>Alberta</strong> benchmarking system. <strong>The</strong> development<br />
process of this system can be seen in Figure 2-1.<br />
c<br />
Figure 2-1 Development Process of <strong>Alberta</strong> <strong>Benchmarking</strong> System<br />
Principally, the development of a benchmarking system includes the following aspects: development<br />
of metrics and a survey instrument, development of a data collection and reporting system, and<br />
validation of submitted data. Each is discussed next.<br />
7
a) Development of Metrics<br />
This study applies most of the project performance, best practice, and engineering and construction<br />
productivity metrics developed by CII’s <strong>Benchmarking</strong> and Metrics (BM&M) program. Definition of<br />
these metrics can be seen in Appendix B. This study also incorporates many additional metrics<br />
focused on specific areas of interest concerning projects executed in <strong>Alberta</strong>. <strong>The</strong>se additional<br />
metrics were developed through meetings with <strong>COAA</strong>’s benchmarking committee, industry experts,<br />
and CII’s BM&M staff. Development activities for all additional metrics are described in section 3.4.<br />
b) Development of Survey Instrument<br />
Once the metrics were defined, CII’s existing Large Project Questionnaire was modified to include<br />
additional metrics for projects executed in <strong>Alberta</strong>. Primarily, this was accomplished through input<br />
obtained from the <strong>COAA</strong> benchmarking committee. In addition, the questionnaire was refined using<br />
the feedback and input from 180 industry representatives who attended <strong>COAA</strong> benchmarking<br />
training over three years. To ensure the reliability and consistency of questionnaire responses, all<br />
questions were reviewed and validated by an expert in survey design at the University of Texas at<br />
Austin. It should be mentioned that the questionnaire was developed with both owner and contractor<br />
data in mind. <strong>The</strong> final questionnaire was subsequently programmed by CII staff from 2005 to 2007<br />
and can be downloaded through <strong>COAA</strong>’s website. Notably, the questionnaire requires each project<br />
to report data concerning general project information, budget, schedule, change orders, rework,<br />
safety, practice use, productivity, and factors known to impact project performance.<br />
c) Data Collection System<br />
CII has developed a robust web-based data collection system over the last eight years. This<br />
development activity has resulted in a mature, online system that is recognized as a cost-effective<br />
tool that companies can use to benchmark a large number of projects. This system also supports<br />
the collaboration of data entry among multiple project participants and allows benchmarking at two<br />
milestones: at project sanction (i.e., Approval for Expenditure (AFE)) and after project completion<br />
(see definitions of terms in Appendix B). <strong>Benchmarking</strong> at AFE uses project estimates, while<br />
benchmarking after completion relies upon both estimates and actual data. In addition, the <strong>Alberta</strong><br />
benchmarking system supports both imperial and metric systems of measurement. Here, the system<br />
is capable of converting concrete quantities between cubic yards and cubic meters, and wire and<br />
cable quantities between linear feet and linear meters, for example. This feature supports projects<br />
using a hybrid quantity unit system which is advantageous to large projects managed by multiple<br />
companies working in different unit environments.<br />
8
d) Data Collection and Validation<br />
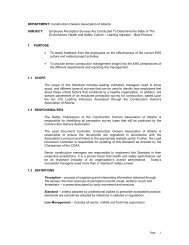
Figure 2-2 contains a history of <strong>COAA</strong> project data collection beginning in November 2005. Data<br />
collection was planned to complete in October 2008 for the first round. As can be seen in the Figure,<br />
a total of 78 projects were created by 19 <strong>COAA</strong> member companies through the end of 2008. <strong>The</strong>se<br />
19 firms include ten owner companies and nine contractors. However, only 37 projects containing<br />
complete project data were submitted before the deadline in October 2008. For this reason, only<br />
these projects were validated for inclusion in this study.<br />
100<br />
Number of Project Data in <strong>COAA</strong> DB by Month (last updated Oct. 24th, 08)<br />
Number of Project Data<br />
90<br />
80<br />
70<br />
60<br />
50<br />
40<br />
30<br />
20<br />
10<br />
0<br />
Nov-05<br />
3<br />
9<br />
Dec-05<br />
Jan-06<br />
Training # 1<br />
Nov. 05<br />
Feb-06<br />
Mar-06<br />
Apr-06<br />
May-06<br />
55<br />
53<br />
51<br />
47<br />
36<br />
38<br />
37<br />
30<br />
23<br />
13 15 18 21 25 2931 11<br />
12<br />
9<br />
13<br />
10<br />
7<br />
2 2 3 6 1 2<br />
0<br />
3 0 2 0 1 1<br />
2 1<br />
Jun-06<br />
Jul-06<br />
Aug-06<br />
Sep-06<br />
Oct-06<br />
Nov-06<br />
Dec-06<br />
Training #2<br />
Oct. 06<br />
Jan-07<br />
Feb-07<br />
Number of projects created in database<br />
Total number of submitted projects<br />
Number of projects submitted by months<br />
Mar-07<br />
Apr-07<br />
May-07<br />
Jun-07<br />
Jul-07<br />
Aug-07<br />
Sep-07<br />
Oct-07<br />
Nov-07<br />
Dec-07<br />
Training #3<br />
Nov. 07<br />
Jan-08<br />
Feb-08<br />
Mar-08<br />
Apr-08<br />
May-08<br />
Training #4<br />
May 08<br />
75<br />
Jun-08<br />
Jul-08<br />
Aug-08<br />
Sep-08<br />
37<br />
7<br />
78<br />
Oct-08<br />
Nov-08<br />
Dec-08<br />
Round 1<br />
Data Cut Off :<br />
Aug. 1st, 08<br />
Figure 2-2 Number of Submitted Project Data<br />
To ensure the quality and integrity of data included in the <strong>Alberta</strong> database, a comprehensive data<br />
validation process was established by the research team. This process consists of two phases.<br />
First, <strong>COAA</strong> benchmarking associates (BA) validate their project data through internal comparisons<br />
and submit these data only once they have been verified. Secondly, the <strong>COAA</strong> Account Manager at<br />
CII examined the submitted data using comparisons with additional <strong>Alberta</strong> projects, primarily to<br />
identify outliers, thereby generating a series of questions to the responsible BA.<br />
9
2.2 Hierarchical Structure for Project Comparison<br />
To provide meaningful benchmarking results, comparisons are made amongst projects that are as<br />
similar as possible using five different project characteristics. <strong>The</strong>se characteristics are used in a<br />
hierarchical structure and programmed as a comparison algorithm, the logic of which can be seen in<br />
Tables 2-1 and 2-2. <strong>The</strong> <strong>COAA</strong> and CII development teams collaboratively created these algorithms<br />
in order to mine the database based upon: 1) project cost category, 2) project nature, 3) project type<br />
level 2, 4) project type level 1, and 5) respondent types. In order to achieve reasonable<br />
benchmarking by project size ($CDN), time adjustments of project costs are required. <strong>The</strong> year<br />
during the middle of the project was used to normalize project cost dollar values to July 2007.<br />
Table 2-1 Comparison Algorithm of <strong>Alberta</strong> Project Performance Metrics<br />
Loop #<br />
# 1 – no slices found,<br />
go to 2<br />
#2 – no slices found,<br />
go to 3<br />
#3– no slices found,<br />
go to 4<br />
4: Stop! Data Slice<br />
found with n=10!!<br />
Respondent<br />
Type<br />
Owner<br />
Owner<br />
Owner<br />
Level 1 Level 2 Nature<br />
Upstream<br />
Upstream<br />
Upstream<br />
Oil Sands<br />
SAGD<br />
Oil Sands<br />
SAGD<br />
Oil Sands<br />
SAGD<br />
Grassroots<br />
Cost<br />
Category<br />
$100-250MM<br />
Grassroots ALL<br />
ALL ALL<br />
Owner Upstream ALL ALL ALL<br />
#5 Owner ALL ALL ALL ALL<br />
#6 ALL ALL ALL ALL ALL<br />
Table 2-2 Comparison Algorithm of <strong>Alberta</strong> Engineering and Construction Productivity Metrics<br />
Loop #<br />
# 1 – no slices found,<br />
go to 2<br />
#2 – no slices found,<br />
go to 3<br />
#3– no slices found,<br />
go to 4<br />
4: Stop! Data Slice<br />
found with n=10!!<br />
Respondent<br />
Type<br />
Owner<br />
Owner<br />
Owner<br />
Level 1 Level 2 Nature<br />
Upstream<br />
Upstream<br />
Upstream<br />
Oil Sands<br />
SAGD<br />
Oil Sands<br />
SAGD<br />
Oil Sands<br />
SAGD<br />
Grassroots<br />
Cost<br />
Category<br />
$100-250MM<br />
Grassroots ALL<br />
ALL ALL<br />
Owner Upstream ALL ALL ALL<br />
#5 Owner ALL ALL ALL ALL<br />
#6- Second Round with<br />
All Response Type<br />
ALL<br />
Upstream<br />
#7 ALL Upstream<br />
#8 ALL Upstream<br />
Oil Sands<br />
SAGD<br />
Oil Sands<br />
SAGD<br />
Oil Sands<br />
SAGD<br />
Grassroots $100-250MM<br />
Grassroots ALL<br />
ALL ALL<br />
#9 ALL Upstream ALL ALL ALL<br />
#10 ALL ALL ALL ALL ALL<br />
10
<strong>The</strong> hierarchical structure of <strong>Alberta</strong> project type (level 1 and level 2) can be seen in Table 2-3.<br />
<strong>Alberta</strong> projects were divided to four types (level 1) which includes upstream and downstream oil and<br />
gas, natural gas, and pipeline projects. This was done for data comparison and analysis purposes.<br />
Level 1 projects are also further broken down to a second level (level 2). For example, upstream oil<br />
and gas is divided into oil sands Steam Assisted Gravity Drainage (SAGD) and oil sands mining.<br />
After metric values are calculated for each project, metrics are compared with the closest specific<br />
data slice according to the previously-developed algorithms (e.g., $100M- $250M project size,<br />
grassroots, oil sands SAGD, upstream, heavy industry, and contractor). This can be seen in ‘loop 1’<br />
of Table 2-1. Additionally, if the comparable dataset has less than 10 projects or data from less than<br />
3 companies, the comparison was moved to the next loop (and so on) until enough data are<br />
available.<br />
Table 2-3 Hierarchical Structure of <strong>Alberta</strong> Project Types<br />
Level 1<br />
Upstream<br />
Level 2<br />
Oil Sands SAGD<br />
Level 3<br />
Cogeneration<br />
Central Plant Processing Facilities<br />
(Oil Exploration/<br />
Pad and Gathering<br />
Production)<br />
Oil Sands Mining<br />
Oil Sands Mining/ Extraction<br />
Central Plant Processing Facilities<br />
Naptha Hydrotreater Unit<br />
Oil Sands Upgrading<br />
Downstream<br />
Hydrogen Plant<br />
Oil Refining<br />
Utilities and Offsite<br />
Natural Gas Natural Gas Processing<br />
Process Pipeline<br />
Pipeline Pipeline SAGD<br />
Pipeline (Gas Distribution)<br />
2.3 Project Key <strong>Report</strong><br />
For each participating company in this research, a standardized report was created that contained all<br />
metric values that could be calculated based on questionnaire responses for a given project. This<br />
standardized report is known as the ‘project key report’ which was generated to provide comparisons<br />
of selected project performance with other similar projects in the <strong>Alberta</strong> benchmarking database<br />
following the procedures discussed previously. <strong>The</strong> key report presents metric scores, database<br />
means, performance quartiles, and sample size of the comparable dataset. <strong>The</strong> key report was<br />
customized for <strong>Alberta</strong> based projects based on a series of discussions with the <strong>COAA</strong><br />
<strong>Benchmarking</strong> committee. A sample of the report can be seen in Figure 2-3, while a complete<br />
sample report can be downloaded at the <strong>COAA</strong> website. Generally, metrics scores are presented in<br />
11
quartiles with the first quartile (1Q) being preferred. However, some metrics scores are not<br />
presented using quartiles, but rather, are presented as a continuum of observed project performance.<br />
In the case of Figure 2-3, schedule metrics are qualified as the percent of projects spending more<br />
time.<br />
Figure 2-3 Sample of Project Cost and Schedule Performance Metrics<br />
<strong>The</strong> key report also contains comparisons for both engineering and construction productivity. A<br />
sample of engineering productivity metrics can be seen in Figure 2-4. In this figure, a calculation of<br />
unit rate is provided that divides the total design work hours by its corresponding issued for<br />
construction (IFC) quantity. Again, comparisons for each metric are provided with the database<br />
mean and all comparable projects are organized into quartiles (e.g., with n=12, three projects would<br />
reside in each quartile). While the quartiles appear to be a uniform width from a unit rate perspective,<br />
this rarely happens in practice. Rather, project metrics may be clustered or spread out for each<br />
observed quartile.<br />
Figure 2-5 provides a sample of the key report for construction productivity. In this figure,<br />
calculations and comparisons for each metric are provided in much the same way as previously<br />
discussed. In general, additional detail is provided for construction productivity when compared with<br />
engineering productivity for the same disciplines. In addition, the construction productivity section<br />
12
also provides for the ability to compare estimates of construction productivity generated at sanction<br />
with actual data from completed projects.<br />
Figure 2-4 Sample of Project Engineering Productivity Metrics<br />
Structural Steel<br />
Metric<br />
Wk-Hrs<br />
Installed<br />
Quantity<br />
(MT)<br />
Unit Rate<br />
(Wk-Hrs/MT)<br />
Database<br />
Mean<br />
n<br />
Structural Steel 15,304 637 24.03 23.74 12*<br />
Pipe Racks & Utility Bridge 5,391 289 18.64 28.58 19*<br />
Miscellaneous Steel 11,882 173 68.57 51.14 11*<br />
: Total Structural Steel<br />
Productivity Rate<br />
32,577 1,099 29.64 14<br />
Est.<br />
Wk-Hrs<br />
Est.<br />
Quantity<br />
(MT)<br />
Est.<br />
Unit Rate<br />
(Wk-Hrs/ MT)<br />
: Total Estimated Structural<br />
Steel Productivity Rate 29,000 1,000 29.00<br />
30.80<br />
n<br />
14<br />
: Total Installed Unit Cost<br />
Actual<br />
($/MT)<br />
Estimated<br />
($/MT)<br />
Actual DB Mean<br />
($/MT)<br />
3,200 3,000 3,100 14<br />
n<br />
Figure 2-5 Sample of Project Construction Productivity Metrics<br />
13
3 <strong>COAA</strong> Project Performance and Productivity Metrics<br />
This section introduces the metrics used in this research. It provides an explanation of interpretation of<br />
the project key report. In addition, this section also provides an overview of statistical terms used in<br />
conducting the analyses for this report. As discussed previously, the <strong>COAA</strong> benchmarking system<br />
adopted most of the proven CII project performance and practice metrics, plus some specific metrics<br />
created for the unique factors found on projects in <strong>Alberta</strong>.<br />
3.1 General Metrics<br />
<strong>The</strong> category of general metrics pertains to those metrics used by CII’s benchmarking and metrics<br />
(BM&M) program for many years. <strong>The</strong> use of these metrics was necessary to ensure the<br />
compatibility of comparisons between project data collected in <strong>Alberta</strong> and by CII in the U.S. and in<br />
other countries around the world. <strong>The</strong>re are three sub-categories of general metrics. <strong>The</strong>se are<br />
discussed next.<br />
3.1.1 Project Performance Metrics<br />
<strong>The</strong> CII BM&M program measures five aspects of project performance, notably: 1) cost, 2) schedule, 3)<br />
safety, 4) change, and 5) field rework. Project cost and schedule performance metrics evaluate the<br />
amount of variation from planned cost and schedule estimates at sanction. <strong>The</strong>se performance metrics<br />
are further decomposed to address five primary phases of capital project execution. Known as phase<br />
cost and schedule factors, these metrics portray the proportion of total project time and money<br />
expended during each phase of the project. Safety, change, and rework are measured in terms of<br />
overall project performance at project completion. <strong>The</strong> definitions of these metrics are described in<br />
detail in Appendix B. <strong>The</strong> only aspect of project performance metrics that differs between the CII and<br />
<strong>COAA</strong> system concerns safety metrics. For this research, the safety metrics commonly used in<br />
Canada were included.<br />
3.1.2 Engineering and Construction Productivity Metrics<br />
<strong>The</strong> productivity metrics used in this research are based on the engineering and construction<br />
productivity measurements used by CII’s BM&M program. Metrics are defined as ratios of work<br />
hours (WH) to quantities. For most, these metrics are easy to understand and are consistent with<br />
most estimating and cost accounting systems. For these metrics, a lower productivity rate is<br />
generally preferred.<br />
14
Engineering productivity metrics are defined as actual engineering work hours per Issued for<br />
Construction (IFC) quantity, which is the number of actual direct work hours required to design a<br />
particular unit of work. This calculation can be seen in Equation 1. Engineering productivity metrics<br />
were captured for significant work activities for the following design disciplines: 1) concrete, 2)<br />
structural steel, 3) equipment, 4) piping, 5) electrical, and 6) instrumentation. A definition of direct<br />
labour for all engineering productivity metrics can be seen in the questionnaire and in Appendix B.<br />
Engineering Productivity<br />
Input Actual Design Work Hours<br />
= =<br />
[Equation 1]<br />
Output IFC Quantity<br />
Construction productivity metrics are defined as actual direct work hours required to install a unit<br />
quantity. This calculation can be seen in Equation 2. In this research, construction productivity rates<br />
were captured for significant work activities for the following disciplines: 1) concrete, 2) structural steel,<br />
3) equipment, 4) piping, 5) electrical, 6) instrumentation, 7) insulation and 8) scaffolding. Additionally,<br />
in this research, both estimated and actual quantity and work hours are captured for construction<br />
activities.<br />
Construction Productivity<br />
Input Actual Installed Direct Work Hours<br />
= =<br />
[Equation 2]<br />
Output Installed Quantity<br />
3.1.3 Practices<br />
This study also assessed the use of 14 project best practices during the execution of a capital project<br />
including: Front End Planning, Project Risk Assessment, Team Building, Alignment during Front End<br />
Planning, Constructability, Design for Maintainability, Material Management, Project Change<br />
Management, Zero Accident Techniques, Quality Management, Automation/Integration (AI)<br />
Technology, Planning for Startup, Prefabrication/ Preassembly/ Modularization and Workface<br />
Planning. Excluding Workface Planning, all these best practices were adopted from the original CII<br />
benchmarking questionnaire. A complete list of these 14 Best Practices and definitions for each are<br />
provided in Appendix B.<br />
3.2 <strong>COAA</strong>-Specific Metrics<br />
This research included additional <strong>COAA</strong>-specific metrics to quantify <strong>Alberta</strong> project performance and<br />
productivity. <strong>The</strong>se metrics are listed in Table 3-1. Many of these additional metrics relate to indirect<br />
15
and direct construction costs, mechanical and equipment costs, scaffolding work hours, the use of<br />
offsite modules, as well as various workforce metrics. <strong>The</strong> additional metrics were developed to<br />
evaluate suspected major causes of cost overruns and schedule delays common to large projects<br />
(Flyvberg 2003; <strong>COAA</strong> 2005). In addition, for projects in <strong>Alberta</strong>, metrics regarding estimated<br />
construction productivity, estimated total installed unit cost (TIUC), and metrics related to actual<br />
versus estimated productivity and TIUC were captured in the construction productivity section. A list<br />
of all metrics developed specifically for projects in <strong>Alberta</strong> is provided in Appendix B.<br />
Table 3-1 Additional Study-Specific Performance Metrics<br />
Metrics<br />
Related to<br />
Project Cost<br />
Metrics<br />
Related to<br />
Workforce<br />
Metrics<br />
Related to<br />
Construction<br />
Productivity<br />
Direct Construction Cost<br />
= Direct Construction Costs<br />
Total Construction Cost<br />
Indirect Construction Cost<br />
= Indirect Construction Costs<br />
Total Construction Cost<br />
Indirect/ Direct<br />
= Indirect Construction Costs<br />
Direct Construction Costs<br />
<strong>Major</strong> Equipment<br />
= <strong>Major</strong> Equipment Cost<br />
Total Project Cost<br />
Mechanical & Process Equipment = Mech. and Process Equipment Costs<br />
Total Project Cost<br />
Direct-Indirect Workhours<br />
= Total Construction Indirect Work-Hours<br />
Total Construction Direct Work-hours<br />
%Offsite Construction WH = Offsite Construction WH of Modules x 100<br />
Total Construction Hours<br />
%Overtime Work-hours = Overtime Craft Work-hours x 100<br />
Total Construction Field Work-hours<br />
Peak Construction Workforce = Actual Peak Workforce<br />
Planned Peak Workforce<br />
Mode of Travel to Worksite<br />
% Workers Living in Camps and Living Out Allowance<br />
Scaffolding WH Factor<br />
= Scaffolding WH<br />
Total Direct WH<br />
Scaffolding Cost Factor<br />
= Total Scaffolding Cost<br />
Total Direct Cost<br />
Modules Installation : Pipe Rack, Process Equipment, and Building Modules<br />
Total Installed Unit Cost ($/ Unit Quantity)<br />
Productivity Estimate Accuracy = Estimated Productivity Rate<br />
Actual Productivity Rate<br />
Cost Estimate Accuracy<br />
= Estimated Total Installed Unit Cost<br />
Actual Total Installed Unit Cost<br />
Practices<br />
Workface Planning<br />
16
3.3 Understanding <strong>Benchmarking</strong> <strong>Report</strong>s and Analyses<br />
<strong>The</strong> project key report provides the feedback to a company regarding how their selected project(s)<br />
performed. It compares the project against the most comparable set of projects available for each<br />
individual metric. Importantly, each participating company can use their key report(s) to identify<br />
performance gaps in order to set objectives on future projects and to initiate improvements to key<br />
work processes.<br />
3.3.1 Metrics<br />
<strong>COAA</strong> Project performance metrics consist of cost, schedule, safety, change, field rework,<br />
engineering and construction productivity, and estimating performance (actual / estimated<br />
productivity rate and total installed unit cost). A lower score generally indicates better performance.<br />
For each individual metric, a typical comparison is provided in Figure 3-1. This figure shows that the<br />
sample project overran the budget by 3.6%, while the comparable dataset has 35 projects with an<br />
average cost growth of -4.0% (i.e., actual cost was 4% less than initially predicted). Overall, this<br />
project ranks in the third quartile on cost growth when compared with its peer projects. First quartile<br />
metrics are considered ‘best in class’.<br />
Figure 3-1 Example of Performance Metrics<br />
Practice metrics were scored using a ten point scale, with a higher number (i.e., 10) indicating better<br />
implementation of the selected practice. As can be seen in Figure 3-2, this sample project received<br />
a score of 8.929 for the use of Front End Planning (FEP). In comparison with 36 similar projects, this<br />
project ranks in the second quartile, which indicates that the project implemented FEP relatively well.<br />
Figure 3-2 Example of Practice Metrics<br />
17
3.3.2 Explanation of Statistics<br />
In addition to descriptive analyses previously presented and available in project key reports, this<br />
research also employed various statistical techniques to analyze projects residing in both <strong>COAA</strong> and<br />
CII databases. Primarily, box and whisker plots, pie charts and tabular descriptions were used to<br />
portray descriptive statistics for both databases. Where inferential statistics were used, methods of<br />
correlation including regression with trend lines and statistical tests of significance were incorporated<br />
in this research. Where used, box and whisker plots also incorporate a variety of test statistics<br />
including the standard T-test or Analysis of Variance (ANOVA) techniques, depending on the number<br />
of comparison groups and distribution of sample variances (Agresti and Finlay 1999). Figure 3-3<br />
provides an example of a Box and Whisker plot and associated terminology.<br />
Mean refers to the arithmetic average of a set of values, which is the sum of the variable value<br />
divided by the number of samples.<br />
Median is the number separating the higher half of a sample from the lower half.<br />
equivalent to the second quartile (Q2).<br />
Median is<br />
Sample Box and W hisker Diagram<br />
OutlierSymbol<br />
Third Quartile<br />
(Q 3)<br />
Last Obs ervation below<br />
(Q3 + 1.5IQR)<br />
Median<br />
Mean<br />
First Quartile<br />
(Q1)<br />
Las t Observation above<br />
(Q1 - 1.5IQR)<br />
Figure 3-3 Box and Whisker Diagram<br />
First Quartile (Q1) is also called as the 25 th percentile or lower quartile which refers to the threshold<br />
below which 25% of the sample have observed value(s).<br />
18
Third Quartile (Q3) indicates the 75 th percentile and delineates the highest 25% of data.<br />
Interquartile Range (IQR) refers to the range between the first quartile and the third quartile.<br />
Correlation (r) measures the strength of the linear relationship between variables (metrics) ranging<br />
from -1 to 1. However, a strong correlation does not prove that a causal relationship exists between<br />
observed variables. <strong>The</strong> magnitude close to -1 and to +1 merely indicates that a strong negative or<br />
positive relationship is observed between the two variables (i.e., when the relationship between them<br />
follows a straight line on a scatter plot). Notably, a correlation close to 0 indicates virtually no linear<br />
relationship. In this study, r0.5 is considered to have a high degree of<br />
correlation.<br />
Trend Line is based on the subjective evaluation of the best fit for the data and should not be used<br />
for the purpose of extrapolation. In the case where no evident trends exist, trend lines were omitted.<br />
<strong>The</strong> Coefficient of Determination (R 2 ) is the most frequently quoted measure representing the<br />
goodness of linear fit of the least square regression line. R 2 can be interpreted as the percentage of<br />
variation of the response variable explained by the regression line with the independent variable as<br />
the only explanatory variable. <strong>The</strong> better fit the line possesses, the closer R 2 should be to 1.<br />
Significant Value (p) is defined as the probability of making a decision to reject the null hypothesis<br />
when the null hypothesis is actually true. Usually, social science research accepts any probability<br />
value below 0.05 (or alpha level = 0.05) as being statistically meaningful. Consequently, any<br />
probability value below 0.05 is regarded as indicative of genuine effect (Field, 2005).<br />
19
4 Data Analysis<br />
This chapter presents selected results of significant analyses discovered by the research team.<br />
Instead of examining each project, this chapter describes how the databases of CII and <strong>COAA</strong><br />
projects were used to evaluate different hypotheses regarding the performance of projects in <strong>Alberta</strong>.<br />
<strong>The</strong> first three sub-sections provide a perspective of the database through the use of descriptive<br />
statistics. Subsequent sub-sections provide selected inferential analyses surrounding factors known<br />
and suspected to affect project performance. Notably, the fourth sub-section compares the project<br />
performance of <strong>Alberta</strong> and U.S. projects. <strong>The</strong> fifth and sixth sub-sections present analysis results<br />
for the observed engineering and construction productivity (respectively) in <strong>Alberta</strong> in comparison<br />
with U.S. projects. Finally, the results of factors impacting project cost, schedule and construction<br />
productivity are presented in the last sub-section.<br />
4.1 Description of <strong>Alberta</strong> Dataset<br />
<strong>The</strong> first round of data collection was completed over a period of 36 months. During this time, 78<br />
<strong>Alberta</strong>-based projects were established in the <strong>Alberta</strong> benchmarking system, though not all were<br />
finalized and submitted. By the end of October 2008, a total of 37 projects were submitted, validated<br />
and analyzed in this research. 28 projects were submitted by owners and 9 projects were submitted<br />
by contractors at either project sanction or completion. Table 4-1 and Figure 4-1 contain further<br />
descriptions of the dataset by type, nature, and delivery system. As can be seen in these exhibits,<br />
the majority of submitted projects are oil sands SAGD and upgrading facilities. Most submitted<br />
projects are grassroots facilities using parallel prime and design-bid-build (DBB) delivery systems.<br />
Importantly, all submitted projects used cost reimbursable contracts for their construction phases.<br />
<strong>The</strong>se terms, along with others used in this study, are presented in a glossary in Appendix C. It<br />
should be noted that due to the limited number of projects in the first round of this research, the<br />
lowest level of analysis that can be presented contains 10 or more projects in accordance with<br />
guidelines established by CII and <strong>COAA</strong>. <strong>The</strong>se provisions assure statistical significance and<br />
confidentiality and conform to published policies of the <strong>COAA</strong> <strong>Benchmarking</strong> Committee.<br />
20
Table 4-1 Submitted <strong>Projects</strong> by Owners and Contractors at Project Completion and Sanction<br />
Submitted at<br />
Project Types # <strong>Projects</strong> Completion<br />
Sanction<br />
Owner Contractor Owner Contractor<br />
Oil Sands Upgrading 12 3 1 6 2<br />
Oil Sands SAGD 12 8 3 1 -<br />
Natural Gas Processing 4 1 3 - -<br />
Oil Sands Mining/Extraction 3 1 - 2 -<br />
Pipeline 2 2 - - -<br />
Cogeneration 1 1 - - -<br />
Oil Refining 1 1 - - -<br />
Electrical (Generating) 1 - - 1 -<br />
Gas Distribution 1 1 - - -<br />
Total 37 18 7 10 2<br />
Modernization<br />
4 (11%)<br />
Traditional<br />
D-B-B<br />
3 (8%)<br />
CM at Risk<br />
5 (14%)<br />
Grass Roots<br />
19 (51%)<br />
Addition<br />
14 (38%)<br />
Parallel Primes<br />
17 (46%)<br />
Design-Build<br />
12 (32%)<br />
# of <strong>Projects</strong> (%of Total)<br />
# of <strong>Projects</strong> (%of Total)<br />
Figure 4-1 Number of Submitted <strong>Projects</strong> by Project Nature and Delivery System<br />
In this research, the total project cost is defined as the total installed cost for owners, whereas<br />
contractors reported total cost of their work scope. <strong>The</strong> distribution of all submitted projects at either<br />
sanction or completion and total project cost ($CDN) in 2007 can be seen in Figure 4-2. While all<br />
projects were normalized to July 2007, all submitted projects were also completed after 2003. Time<br />
adjustments were accomplished by using the historical index values contained in RS Means in order<br />
to produce valid comparison bases. <strong>The</strong> total number of projects shown in Figure 4-2 is 35,<br />
reflecting the fact that 2 projects did not provide project cost information. As a common practice in<br />
<strong>Alberta</strong>, most mega projects were split into several smaller projects (sub projects) and managed as a<br />
portfolio. Among the 37 submitted projects, half of these are considered as sub projects.<br />
Consequently, all are treated as individual projects for purposes of data analysis and comparison in<br />
the following sections.<br />
21
Number of Submitted <strong>Projects</strong> at Sanction& Completion<br />
Number of <strong>Projects</strong><br />
10<br />
9<br />
8<br />
7<br />
6<br />
5<br />
4<br />
3<br />
2<br />
1<br />
0<br />
1<br />
$1B<br />
Total<br />
11<br />
24<br />
Figure 4-2 Number of <strong>Projects</strong> Submitted at Sanction and Completion by Total Project Cost<br />
Category ($CDN in 2007)<br />
4.2 Selected Descriptive Analyses<br />
<strong>The</strong> analyses in this sub-section were conducted to provide an appreciation of the baseline metric<br />
values for the projects submitted by both owners and contractors. For these analyses, the<br />
distribution of metrics mostly related to project characteristics and performance and is presented with<br />
mean, median, range and quartile statistics using box and whisker diagrams.<br />
• Construction Indirect Cost and Work-Hours<br />
Figure 4-3 contains the distribution of construction indirect work hours for 20 projects as a proportion<br />
of direct work hours (i.e., the n value below the graph indicates the number of projects reporting this<br />
particular data). On average, the amount of indirect construction work hours for <strong>Alberta</strong>-based<br />
projects is about 34% of direct construction work hours. Moreover, the average indirect construction<br />
cost is 20.71% of total project cost. This can be seen in Figure 4-4.<br />
22
Construction Indirect/ Direct Work-Hours (%)<br />
70<br />
60<br />
50<br />
40<br />
30<br />
20<br />
10<br />
0<br />
(N=20)<br />
34.09%<br />
Figure 4-3 Construction Indirect / Direct Work hours (%)<br />
Construction Indirect Cost/ Total Project Cost (%)<br />
50<br />
40<br />
30<br />
20<br />
10<br />
0<br />
20.71%<br />
(N=20)<br />
Figure 4-4 Construction Indirect Cost / Total Project Cost (%)<br />
• % Modularization 1<br />
Figure 4-5 contains a comparison of the percentage of project cost spent using modularization by<br />
project nature. Here, the dataset includes 17 grass roots projects and 13 addition projects with<br />
modularization data (there was insufficient data to report for modernization projects). On average,<br />
grassroots projects spent 19.4% of their total project cost on modularization, compared to 12.3%<br />
spent on addition projects. This difference, however, is not statistically significant (t = 1.517, p>0.05).<br />
1 % Modularization is a percentage value that describes the level of modularization (offsite construction), and<br />
defined as a ratio of the cost of all modules divided by total installed cost.<br />
23
Modularization/Total Proejct Cost(%)<br />
50<br />
40<br />
30<br />
20<br />
10<br />
0<br />
19.41<br />
Grass Roots<br />
(N=17)<br />
12.31<br />
Addition<br />
(N=13)<br />
Figure 4-5 Modularization by Project Nature<br />
• Project Delivery Systems<br />
Figures 4-6 and 4-7 compare the effectiveness of parallel primes and all other project delivery<br />
methods combined by cost and schedule growth, respectively. <strong>The</strong> research found that 46% of the<br />
projects in the <strong>Alberta</strong> benchmarking database used a parallel primes project delivery method. Other<br />
project delivery methods included traditional design/bid/build (D/B/B), design/build (D/B), multiple<br />
design-build and construction management (CM). <strong>The</strong>se methods were combined due to insufficient<br />
numbers of projects in each of these categories. Nonetheless, these results show a slight advantage<br />
to the use of parallel primes over other delivery methods with respect to schedule, but not with<br />
respect to project cost. In addition, parallel primes projects had slightly lower average project<br />
schedule growth (0.15) in comparison with all other project delivery methods (0.19) and,<br />
simultaneously, higher project cost growth (0.23 vs. 0.13). <strong>The</strong>se differences are not statistically<br />
significant (t = -0.378, p>0.05) for project schedule growth, nor are they significant for project cost<br />
growth (t = 0.756, p>0.05). <strong>The</strong>se results are presented here merely for the reader’s enhanced<br />
understanding of the project data used for this report.<br />
24
1.2<br />
1.0<br />
Project Cost Growth<br />
0.8<br />
0.6<br />
0.4<br />
0.2<br />
0.0<br />
0.23<br />
0.13<br />
-0.2<br />
-0.4<br />
Parallel Primes<br />
(N=14)<br />
Other<br />
(N=10)<br />
Figure 4-6 Project Cost Growth by Project Delivery System<br />
1.00<br />
Project Schedule Growth<br />
0.75<br />
0.50<br />
0.25<br />
0.15<br />
0.19<br />
0.00<br />
Parallel Primes<br />
(N=14)<br />
Other<br />
(N=10)<br />
Figure 4-7 Project Schedule Growth by Project Delivery System<br />
4.3 Selected Inferential Analyses<br />
Inferential analyses were used to explore the relationships amongst project characteristics and the<br />
implementation of best practices on project performance. This sub-section provides samples of<br />
analyses used to determine if any trends or relationships exist between variables for the purpose of<br />
identifying the potential root causes that may help explain the performance of <strong>Alberta</strong>-based projects.<br />
Importantly, it should be noted that the trends or relationships presented in this sub-section should<br />
25
not be used to predict, or forecast the performance of any current or future project. Regression and<br />
trend lines shown here are considered explanatory only for the projects being analyzed.<br />
• Percent Engineering Completed before Construction Started<br />
<strong>The</strong> relationship between percent engineering completed before construction started and<br />
construction phase cost growth can be seen in Figure 4-8. Note that a complete list of project<br />
metrics is included in Appendix B. Given the expert opinions of members of the <strong>COAA</strong><br />
<strong>Benchmarking</strong> Committee, the relationship displayed in Figure 4-8 uses a cubic polynomial pattern<br />
due to the fact that as more design is completed before construction begins, the project tends to<br />
have less construction phase cost growth. This trend holds true until, at a certain point, the cost<br />
growth curve flattens and subsequently increases. Thus, an optimum value is found at approximately<br />
60% engineering complete. This result is consistent with other studies completed by CII and other<br />
industry forums. <strong>The</strong> results are also statistically significant, meaning that a strong relationship<br />
exists between the percentage of engineering completed prior to construction start and construction<br />
phase cost growth (R 2 = 0.63, p = 0.016). Likewise, the results also demonstrate a statistically<br />
significant correlation with r = -0.723, p = 0.003. Due to limited number of data, predictability is not<br />
inferred, nor concluded, in this research.<br />
1.00<br />
Construction Phase Cost Growth<br />
0.75<br />
0.50<br />
0.25<br />
0.00<br />
-0.25<br />
-0.50<br />
-0.75<br />
0<br />
10 20 30 40 50 60 70 80 90<br />
% Design completed before construction started<br />
100<br />
Figure 4-8 Effect of % Engineering Completed before Construction Started<br />
26
• Peak Construction Workforce<br />
Analyses were conducted to examine how a change in construction workforce peak numbers affects<br />
project performance. This can be seen in Figure 4-9. <strong>The</strong> results indicate that the projects which<br />
estimated their actual peak workforce numbers with greater precision experienced higher levels of<br />
project cost and schedule performance. In fact, the relationship between the ratio of actual to<br />
estimated peak workforce and project cost growth is statistically strong (r = 0.787, p =0.001). <strong>The</strong><br />
regression model also indicates a statistically strong high R-square (R 2 = 0.62, p< 0.001). A medium<br />
to strong relationship was also identified between project schedule growth and the ratio of actual to<br />
estimated peak construction workforce (r = 0.486, p = 0.011).<br />
1.2<br />
1.0<br />
Project Cost Growth<br />
0.8<br />
0.6<br />
0.4<br />
0.2<br />
0.0<br />
-0.2<br />
-0.4<br />
0.0<br />
0.5<br />
1.0<br />
1.5<br />
2.0<br />
2.5<br />
3.0<br />
Actual/ Estimated Peak Construction Workforce<br />
Figure 4-9 Actual / Estimated Number of Peak Construction Workforce<br />
• Construction Indirect Work-Hours/ Direct Work hours (%)<br />
<strong>The</strong> relationship between construction indirect work hours and project schedule factor can be seen in<br />
Figure 4-10. This figure indicates that projects with high ratios of construction indirect work hours tend<br />
to have better project schedule performance. Here, the lower schedule factor may mean that better<br />
schedule performance may be obtained by isolating the schedule impact of change orders. <strong>The</strong><br />
analysis shows that the relationship between these metrics can be characterized as medium to strong<br />
and statistically significant (r= -0.446, p=0.05). <strong>The</strong> linear regression model is also statistically<br />
significant, yet presents a low R-square value (R 2 = 0.20, p= 0.05).<br />
27
2.00<br />
1.75<br />
Project Schedule Factor<br />
1.50<br />
1.25<br />
1.00<br />
0.75<br />
0.50<br />
0.25<br />
0.00<br />
0<br />
10<br />
20<br />
30<br />
40<br />
50<br />
60<br />
70<br />
80<br />
90<br />
100<br />
Construction Indirect WH/Direct WH (%)<br />
Figure 4-10 Construction Indirect Work-hours/ Direct Work hours (%)<br />
• Project Size ($)<br />
Figure 4-11 contains the analysis of how project size ($ CDN, in 2007) affects construction indirect<br />
cost growth. Construction indirect cost growth is calculated as actual indirect cost divided by<br />
estimated indirect cost. <strong>The</strong> results indicate that larger projects tend to have higher levels of<br />
construction indirect cost growth, based on their own estimates. <strong>The</strong>se results are statistically strong<br />
(r= 0.599, p=0.011) and indicate that a relationship does exist between project size and construction<br />
indirect cost growth. <strong>The</strong> regression model also possesses a medium R-square (R 2 = 0.36, p= 0.011)<br />
value.<br />
1.50<br />
Construction Indirect Cost Growth<br />
1.25<br />
1.00<br />
0.75<br />
0.50<br />
0.25<br />
0.00<br />
-0.25<br />
-0.50<br />
0<br />
200 400 600 800 1000<br />
Adjusted Total Project Cost ($M CDN, in 2007)<br />
1200<br />
Figure 4-11 Construction Indirect Cost Growth by Project Size ($)<br />
28
• Project Risk Assessment (PRA)<br />
<strong>The</strong> effects of Project Risk Assessment (PRA) on project performance are well known and were<br />
investigated for this study. As defined by CII, PRA is the process needed to identify, assess and<br />
manage risk. In PRA, the project team evaluates risk exposure for potential project impacts in order<br />
to provide focus for mitigation strategies. <strong>The</strong> analysis of <strong>COAA</strong> data indicate that high levels of<br />
implementation success of PRA are accompanied by better project cost performance as can be seen<br />
in Figure 4-12.<br />
For this practice, the statistical relationship is medium-strong and statistically<br />
significant (r = -0.436, p = 0.048). However, for PRA as implemented on <strong>Alberta</strong> projects, the<br />
regression model exhibits low R-square values (R 2 = 0.19, p= 0.048).<br />
1.2<br />
1.0<br />
Project Cost Growth<br />
0.8<br />
0.6<br />
0.4<br />
0.2<br />
0.0<br />
-0.2<br />
-0.4<br />
-0.6<br />
0<br />
1<br />
2<br />
3<br />
4<br />
5<br />
6<br />
7<br />
8<br />
9<br />
10<br />
Project Risk Assessment<br />
Figure 4-12 Project Risk Assessment vs. Project Cost Growth<br />
• Constructability<br />
Constructability is defined as the effective and timely integration of construction knowledge and<br />
experience into the conceptual planning, design, construction, and field operations of a project to<br />
achieve the overall project objectives.<br />
As can be seen in Figure 4-13, increased use of<br />
constructability on <strong>Alberta</strong> project leads to better project schedule performance (i.e., lower project<br />
schedule growth). This relationship is statistically significant (r = -0.528, p = 0.008), (R 2 = 0.28, p =<br />
0.008). Interestingly, the effect of constructability on cost performance is not significant for the<br />
<strong>COAA</strong> dataset.<br />
<strong>The</strong>se results are consistent with previous analyses developed using CII’s<br />
benchmarking and metrics database.<br />
29
1.25<br />
Project Schedule Growth<br />
1.00<br />
0.75<br />
0.50<br />
0.25<br />
0.00<br />
-0.25<br />
-0.50<br />
0<br />
1<br />
2<br />
3<br />
4 5 6<br />
Constructability<br />
7<br />
8<br />
9<br />
10<br />
Figure 4-13 Constructability vs. Project Schedule Growth<br />
• Analysis of Other Best Practices<br />
Analyses of other best practices were also conducted. Two are included here: planning for startup<br />
and workface planning. Other evaluations of additional surveyed best practices are not presented<br />
here due to limited space and the fact that they are summarized in a table which can be found in<br />
Appendix A.<br />
Planning for startup is defined as the effective facilitation of the activities that occur between<br />
mechanical completion (i.e., plant construction completion) and the commencement of commercial<br />
operations. As can be seen in Figure 4-14, the analysis conducted by this research indicates that<br />
improved use of planning for startup methods tends to improve the cost performance of the startup<br />
phase. However, this conclusion is made with caution due to the small sample size involved.<br />
Finally, the <strong>COAA</strong> best practice of workface planning was also assessed. Workface planning is<br />
defined by <strong>COAA</strong> as the process of organizing and delivering all elements necessary, before work is<br />
started, to enable craft persons to perform quality work in a safe, effective and efficient manner. <strong>The</strong><br />
relationship between workface planning and construction phase schedule performance can be seen<br />
in Figure 4-15. However, no regression line is plotted due to the limited number of projects reported<br />
in this first round. Nonetheless, the figure is shown here as it is believed that workface planning<br />
does help improve jobsite productivity by assuring that the required resources, tools, equipment and<br />
material are made available to craft workers in a timely fashion. More data will be needed for a more<br />
30
comprehensive evaluation of this specific best practice. However, even then, as discussed by<br />
Kellogg et al (1981), the optimization of jobsite performance may be limited in comparison with the<br />
planning and engineering.<br />
3<br />
Startup Phase Cost Growth<br />
2<br />
1<br />
0<br />
-1<br />
-2<br />
5<br />
6<br />
7<br />
8<br />
Planning for Startup<br />
9<br />
10<br />
Figure 4-14 Planning for Startup vs. Startup Phase Cost Growth<br />
0.8<br />
Construction Schedule Growth<br />
0.6<br />
0.4<br />
0.2<br />
0.0<br />
-0.2<br />
-0.4<br />
0<br />
1<br />
2<br />
3<br />
4<br />
5<br />
6<br />
7<br />
8<br />
9<br />
10<br />
Workface Planning Index<br />
Figure 4-15 Workface Planning vs. Construction Schedule Growth<br />
31
4.4 Comparison of <strong>Alberta</strong> and U.S. Project Performance<br />
A primary focus for this research effort was to obtain comparisons of project performance in <strong>Alberta</strong> with<br />
projects executed in the United States using the CII <strong>Benchmarking</strong> and Metrics (BM&M) database. To<br />
accomplish this objective, U.S. projects are limited to projects with an adjusted total installed cost<br />
greater than $5 million (CDN), normalized to 2007. In this study, we consider U.S. EMR projects to<br />
include oil exploration / production, oil upgrading / refining, natural gas, pipeline, chemical manufacturing,<br />
power generation, and mining. In the following analyses, the symbol ♦ is used to indicate arithmetic<br />
mean and the symbol is used to indicate the median of a particular group.<br />
<strong>Alberta</strong>-based projects are unique projects. <strong>The</strong>re are significant differences when comparing them<br />
to U.S.-based projects. Principally, most of the <strong>COAA</strong> projects are larger than their U.S.<br />
counterparts in terms of cost. <strong>The</strong>y are also located in remote locations and are subjected to<br />
extreme (northern climate) weather conditions. Often, work camps are built and transportation for<br />
large numbers of workers becomes necessary. However, the analyses presented in this sub-section<br />
are not intended to quantify these differences, but rather, examine differences in project size,<br />
contingency, and cost, schedule, and change performance.<br />
• Comparison of Project Size ($) for two Datasets<br />
Figure 4-16 provides the distribution of <strong>Alberta</strong>-based and U.S.-based projects included in this study<br />
in terms of project cost. Notably, the average size and range of the 353 included U.S. projects are<br />
Adjusted Project Cost ($M, in 2007)<br />
1200<br />
1000<br />
800<br />
600<br />
400<br />
200<br />
0<br />
367.83<br />
185.82<br />
<strong>Alberta</strong><br />
(N=23)<br />
84.83<br />
40.43<br />
U.S.<br />
(N=353)<br />
Figure 4-16 Project Size ($M CDN, in 2007)<br />
32
notably smaller when compared with <strong>Alberta</strong>-based projects.<br />
Based on past research and<br />
benchmarking experience, this difference is a significant factor in quantifying performance and<br />
should be considered in understanding the analyses presented here.<br />
• Comparison of Contingency Budget (%)<br />
As can be seen in Figure 4-17, the amount of contingency for <strong>Alberta</strong> and U.S.-based projects are<br />
quite comparable.<br />
Project data shows a slightly higher average contingency rate (8.04%) for<br />
<strong>Alberta</strong>-based projects when compared to U.S.-based projects (7.77%). However, the difference is<br />
not statistically different (t= 0.33, p= 0.742).<br />
Total Contingency Budget/ Total Project Cost (%)<br />
20<br />
18<br />
16<br />
14<br />
12<br />
10<br />
8<br />
6<br />
4<br />
2<br />
0<br />
8.04%<br />
<strong>Alberta</strong><br />
7.77%<br />
U.S.<br />
(N=17)<br />
(N=52)<br />
Figure 4-17 Contingency Budget (%)<br />
• Comparison of Project Cost and Schedule Performance<br />
Figures 4-18 and 4-19 compare the project cost growth and project schedule growth of projects<br />
executed in <strong>Alberta</strong> and in the U.S. Results show significantly higher average cost growth and<br />
schedule growth for the <strong>Alberta</strong> projects. <strong>The</strong>se projects also demonstrate that a much wider range<br />
of performance exists as well. On average, <strong>Alberta</strong>-based projects experienced 19% project cost<br />
growth and 17% project schedule growth, while U.S. projects experienced 3% and 6% cost and<br />
schedule growth, respectively. <strong>The</strong> test of mean difference between these two groups also indicates<br />
that the average cost and schedule growth of <strong>Alberta</strong> project is statistically significant (t = 3.89, p =<br />
0.000 for cost and t = 3.838, p = 0.000 for schedule). Additionally, these figures show that the<br />
33
<strong>Alberta</strong>-based projects possess a much wider range of performance (i.e., -27% to 69% for cost<br />
growth and -15% to 35% for schedule growth) when compared to projects executed in the U.S.<br />
1.2<br />
1.0<br />
Project Cost Growth<br />
0.8<br />
0.6<br />
0.4<br />
0.2<br />
0.0<br />
0.19<br />
0.03<br />
-0.2<br />
-0.4<br />
<strong>Alberta</strong><br />
(N=24)<br />
U.S.<br />
(N=352)<br />
Figure 4-18 Project Cost Growth<br />
1.25<br />
1.00<br />
Project Schedule Growth<br />
0.75<br />
0.50<br />
0.25<br />
0.00<br />
0.17<br />
0.06<br />
-0.25<br />
-0.50<br />
<strong>Alberta</strong><br />
(N=24)<br />
U.S.<br />
(N=338)<br />
Figure 4-19 Project Schedule Growth<br />
• Comparison of Change Cost Factor<br />
Figure 4-20 contains an analysis of the comparison of development change cost factor and scope<br />
change cost factor for the selected <strong>Alberta</strong> and U.S. projects. In this analysis, the <strong>Alberta</strong>-based<br />
projects have a slightly higher average development change cost factor (0.06) when compared to<br />
U.S.-based projects (0.04). In contrast, the average scope change cost factor for projects in <strong>Alberta</strong><br />
34
is slightly lower than that of U.S. projects. However, these differences are not considered to be<br />
statistically significant (p > 0.05). Finally, an analysis of total field rework cost (defined as a ratio of<br />
total direct cost of field rework to actual construction phase cost) indicated that <strong>Alberta</strong> projects are<br />
also in line with U.S.-based projects.<br />
0.4<br />
0.3<br />
Change Cost Factor<br />
0.2<br />
0.1<br />
0.0<br />
0.06<br />
0.04<br />
0.02<br />
0.04<br />
-0.1<br />
-0.2<br />
<strong>Alberta</strong><br />
U.S.<br />
<strong>Alberta</strong><br />
U.S.<br />
Development_Change<br />
Scope_Change<br />
(N=11) (N=14) (N=13) (N=14)<br />
Figure 4-20 Development and Scope Change Cost Factor<br />
4.5 Engineering Productivity<br />
Twenty-three of the 37 <strong>Alberta</strong>-based projects submitted for this research provided measures of<br />
engineering productivity. Of these 23 projects, their average project cost was $367 Million (CDN),<br />
normalized to July 2007. As can be seen in Figure 4-21, the CII BM&M database was able to return<br />
57 EMR projects that also contained engineering productivity data. <strong>The</strong>se projects reported an<br />
average cost of $90 Million (CDN), also normalized to July 2007. As previously described, this<br />
differential in average project cost may impact the direct measures of engineering productivity<br />
reported here. Also, in order to ensure appropriate comparisons, the unit of measure of both U.S.<br />
and <strong>Alberta</strong> projects used to calculate engineering productivity is the metric system (e.g., linear<br />
meter, metric ton) and data have been converted to meet this standard. In general, engineering<br />
productivity metrics use direct engineering work hours in metrics comparing them with specific<br />
issued for construction (IFC) quantities for specific disciplines. <strong>The</strong>se are discussed next.<br />
35
Adjusted Project Cost ($M, in 2007)<br />
1200<br />
1000<br />
800<br />
600<br />
400<br />
200<br />
0<br />
367.83<br />
185.82<br />
<strong>Alberta</strong><br />
U.S.<br />
90.40<br />
30.88<br />
(N=23)<br />
(N=57)<br />
Figure 4-21 Comparison of Project Size ($M CDN, in 2007) for Engineering Productivity<br />
Dataset<br />
• Comparison between <strong>Alberta</strong> versus U.S. <strong>Projects</strong> by Engineering Disciplines<br />
Selected disciplines of engineering productivity are presented in this section. Comparisons between<br />
<strong>Alberta</strong>-based and U.S.-based projects are presented by using both arithmetic mean value (indicated<br />
by the symbol ♦), and weighted mean value (represented by the symbol ⊗). Here, the weighted<br />
mean is calculated as an aggregated productivity rate and is weighted by project size. Essentially,<br />
this mean creates one large, imaginary project where total work hours and total quantities are<br />
assimilated. Previous analysis by CII indicates that this approach is valid and that large projects<br />
typically experience better productivity rates (due to larger quantities) when compared with smaller<br />
projects possessing smaller quantities and lower levels of repetitive work and economies of scale.<br />
• Concrete Engineering Productivity 2<br />
As can be seen in Figure 4-22, the results of engineering productivity metrics for <strong>Alberta</strong>-based<br />
projects and U.S.-based projects are mixed. <strong>Alberta</strong>-based projects have comparable concrete<br />
engineering productivity in line with U.S.-based projects when considering mean values. In fact, after<br />
considering project size, the weighted average concrete engineering productivity rate of <strong>Alberta</strong><br />
projects is actually better than that of U.S. projects.<br />
2 Total Concrete include slabs, foundations, and concrete structures.<br />
36
Total Concrete- Eng. Prod. Rate (WH/CM)<br />
20<br />
15<br />
10<br />
5<br />
0<br />
5.92<br />
⊗ 3.53<br />
<strong>Alberta</strong><br />
(N=17)<br />
⊗ 6.26<br />
4.52<br />
U.S.<br />
(N=31)<br />
Figure 4-22 Comparison of Concrete Engineering Productivity (WH/ Cubic Meter)<br />
• Total Structural Steel Engineering Productivity 3<br />
Figure 4-23 indicates that U.S.-based EMR projects perform the engineering of structural steel with<br />
higher levels of productivity when compared with <strong>Alberta</strong>-based projects (10.96 WH / ton versus<br />
23.08 WH / ton). <strong>The</strong> weighted average productivity rate of U.S. projects is also better (5.86 WH /<br />
ton versus 12.64 WH / ton). This difference of average structural steel engineering productivity<br />
rates is statistically different (t = 2.501, p = 0.02). No cause of this difference is indicated.<br />
Steel- Eng. Prod. Rate (WH/Metric Ton)<br />
70<br />
60<br />
50<br />
40<br />
30<br />
20<br />
10<br />
0<br />
23.08<br />
⊗ 12.64<br />
<strong>Alberta</strong><br />
(N=19)<br />
10.96<br />
⊗ 5.86<br />
U.S.<br />
(N=56)<br />
Figure 4-23 Comparison of Structural Steel Engineering Productivity (WH/ Metric Ton)<br />
3 Total of structural steel include structural steel, pipe racks & utility bridges, and miscellaneous steel.<br />
37
• Piping Engineering Productivity 4<br />
As can be seen in Figure 4-24, <strong>Alberta</strong>-based projects demonstrate higher levels of piping<br />
engineering productivity when compared with U.S.-based projects. This holds true for comparisions<br />
of small bore pipe, large bore pipe, and all pipe sizes combined. <strong>The</strong>se results are consistent using<br />
both measures of average and weighted productivity as can be seen in the figure. It should be noted<br />
that the difference portrayed here in the average piping engineering productivity rates is statistically<br />
significant only for large bore pipe (t = -2.663, p = 0.012), yet this difference is negligible when<br />
examining only the projects which reported only total piping data (i.e., no reporting of bore size).<br />
Again, no cause of the differential reported here is indicated.<br />
8<br />
Piping- Eng. Prod. Rate (WH/LM)<br />
7<br />
6<br />
5<br />
4<br />
3<br />
2<br />
1<br />
0<br />
2.58<br />
2.08<br />
⊗ 1.97<br />
⊗ 1.70<br />
2.03 1.60<br />
⊗<br />
1.00<br />
0.88<br />
1.28 ⊗ 1.23<br />
⊗ 0.78 ⊗ 0.47<br />
<strong>Alberta</strong> U.S. <strong>Alberta</strong> U.S. <strong>Alberta</strong> U.S.<br />
SmallBore(
time adjustment to July 2007. While the project sizes differ, the comparisons which follow are<br />
considered to be valid because of how this study defined construction productivity as the ratio of field<br />
direct work hours (WH) per applicable installed quantity.<br />
1800<br />
Adjusted Project Cost ($M, in 2007)<br />
1600<br />
1400<br />
1200<br />
1000<br />
800<br />
600<br />
400<br />
200<br />
0<br />
459.68<br />
285.49<br />
122.08<br />
81.13<br />
<strong>Alberta</strong><br />
(N=33)<br />
U.S.<br />
(N=29)<br />
Figure 4-25 Comparison of Project Size ($M CDN, in 2007) for Construction Productivity<br />
• Comparison Between <strong>Alberta</strong> and U.S. <strong>Projects</strong> by Work Disciplines<br />
Construction productivity for selected disciplines are presented in this sub-section. As was done with<br />
measures of engineering productivity, the arithmetic mean is represented by the symbol (♦), and the<br />
weighted mean (i.e., a hypothetical single large project) is represented by the symbol (⊗) for<br />
purposes of comparisons of construction productivity rates between <strong>Alberta</strong> and U.S.-based projects.<br />
• Concrete Construction Productivity 5<br />
Figure 4-26 provides an assessment of concrete construction productivity. As can be seen in the<br />
figure, U.S.-based projects place concrete more efficiently than do <strong>Alberta</strong> projects (U.S. average<br />
total concrete productivity rate is 14.44 WH/m 3 , compared to 19.39 WH/m 3 for <strong>Alberta</strong> projects). <strong>The</strong><br />
results are also considered to be consistent even given the differences in the size of the projects<br />
used for this analysis. Notably, the weighted average productivity rates of U.S.-based projects is<br />
9.72 WH/m 3 , compared to 13.10 WH/m 3 for <strong>Alberta</strong>-based projects, although this difference is not<br />
considered to be statistically significant.<br />
5 Total Concrete includes slabs, foundations, and concrete structures.<br />
39
Total Concrete Productivity Rate (WH/ CM)<br />
60<br />
50<br />
40<br />
30<br />
20<br />
10<br />
0<br />
19.39<br />
⊗ 13.10<br />
<strong>Alberta</strong><br />
(N=12)<br />
14.44<br />
⊗ 9.72<br />
U.S.<br />
(N=32)<br />
Figure 4-26 Comparison of Total Concrete Construction Productivity (WH/ m 3 )<br />
• Total Structural Steel Construction Productivity<br />
As can be seen in Figure 4-27, U.S.-based projects are more productive in erecting structural steel<br />
than <strong>Alberta</strong> projects are (53.95 WH/MT versus 42.41 WH/MT). This difference is not statistically<br />
significant. However, the weighted average productivity rate of <strong>Alberta</strong>-based projects is slightly<br />
better than that of U.S.-based projects by 1.06% when considering project size.<br />
Total Steel Prod. Rate (WH/Metric Ton)<br />
180<br />
160<br />
140<br />
120<br />
100<br />
80<br />
60<br />
40<br />
20<br />
0<br />
53.95<br />
⊗ 37.96<br />
<strong>Alberta</strong><br />
(N=21)<br />
42.41<br />
⊗ 38.37<br />
U.S.<br />
(N=32)<br />
Figure 4-27 Comparison of Total Structural Steel Construction Productivity (WH/ Metric Ton)<br />
40
• Instrumentation – Devices Construction Productivity<br />
Figure 4-28 provides an assessment of the productivity of installation of instrumentation – devices.<br />
Project data reported for this study revealed that the arithmetic mean of instrumentation – devices<br />
productivity rate of <strong>Alberta</strong>-based projects is comparable to that of U.S.-based projects (13.37<br />
WH/Count versus 13.53 WH/Count, respectively). However, the weighted average productivity rate<br />
of U.S.-based projects is significantly better (i.e., 158% better) than that of their <strong>Alberta</strong>-based<br />
counterparts. This is primarily due to the discrepancies that exist for instrumentation – devices<br />
productivity rates between small projects and large projects.<br />
Instrumentation- Devices Con. Prod. Rate (WH/ Count)<br />
50<br />
40<br />
30<br />
20<br />
10<br />
0<br />
⊗<br />
21.40<br />
13.37<br />
<strong>Alberta</strong><br />
(N=9)<br />
13.53<br />
⊗ 8.28<br />
U.S.<br />
(N=22)<br />
Figure 4-28 Comparison of Instrumentation- Devices Construction Productivity (WH/ Count)<br />
• Insulation – Piping Construction Productivity<br />
As can be seen in Figure 4-29, the average (i.e., arithmetic mean) piping insulation productivity rate<br />
of <strong>Alberta</strong>-based projects is comparable to that of U.S.-based projects (i.e., 1.90 WH/LM versus 1.93<br />
WH/LM, respectively). However, when the weighted mean calculation is used, the <strong>Alberta</strong>-based<br />
projects outperformed their U.S.-based counterparts by 35.6%. One hypothesis for this observed<br />
difference is that <strong>Alberta</strong>-based projects likely have much more piping insulation, on average, and<br />
that the metrics used for this study are possibly indicating the benefits of repetition for this particular<br />
construction activity.<br />
41
Insulation- Piping Con. Prod. Rate (WH/LM)<br />
8<br />
7<br />
6<br />
5<br />
4<br />
3<br />
2<br />
1<br />
0<br />
1.90<br />
⊗<br />
1.41<br />
<strong>Alberta</strong><br />
(N=16)<br />
2.19<br />
⊗ 1.93<br />
U.S.<br />
(N=15)<br />
Figure 4-29 Comparison of Insulation- Piping Construction Productivity (WH/ Linear Meter)<br />
• Construction Productivity Project Level Index (CPM Index)<br />
Recently, CII has produced a method for examining construction productivity at the project level by<br />
weighting and combining the productivity rates for various disciplines for each observed project. This<br />
method, known currently as the Construction Productivity Method (CPM) Index, provides a macroview<br />
of project performance. As a relative productivity performance measure, the CPM Index ranges<br />
from -3 to 3, with -3 indicating the poorest observed productivity performance. Here, one unit<br />
difference in the CPM index is equivalent to a 100% observed difference in productivity.<br />
Construction Prod. Project Level Index<br />
3<br />
2<br />
1<br />
0<br />
-1<br />
-2<br />
-3<br />
0<br />
200 400 600 800 1000 1200<br />
Adjusted Total Project Cost ($M CDN, in 2007)<br />
Figure 4-30 Construction Productivity Project Level Index vs. Project Size ($M CDN, in 2007)<br />
42
<strong>The</strong> project-level CPM index is critical to the examination of factors affecting construction productivity<br />
because, most of the time, these factors affect all disciplines and not individual disciplines. As can<br />
be seen in Figure 4-30, the project data for <strong>Alberta</strong>-based projects indicates that large projects had<br />
better overall construction productivity than small projects did. <strong>The</strong> analysis provides for a<br />
statistically significant, medium strength correlation (r = -0.374, p = 0.008), although the linear<br />
regression line is not statistically significant (R 2 = 0.13, p = 0.115) and should not be used for<br />
estimating or forecasting purposes. However, the idea that larger projects have better construction<br />
productivity is made with caution since the CPM index includes only measures direct construction<br />
productivity. Indeed, larger projects tend to have larger installed quantities and higher amounts of<br />
repetitive work and these factors may impact overall construction productivity figures. Notably, these<br />
results are consistent with previous analyses conducted by CII.<br />
This research explored other aspects of construction productivity as well. One example involves the<br />
analysis of the effect work schedule (days on and off) has on construction productivity. This study<br />
concluded that a work schedule of 10 days on and 4 days off was more productive than a work<br />
schedule of 5 days on and 2 days off. In fact, an 11% difference was observed using the CPM Index,<br />
although strong statistical significance was not present due to low numbers of project observations.<br />
• Actual / Estimated Construction Productivity Rate by Work Discipline<br />
Figure 4-31 provides an assessment of the accuracy of field productivity estimates for three crafts.<br />
This research discovered that <strong>Alberta</strong>-based projects significantly underestimate construction<br />
productivity. Observed data demonstrate that piping, structural steel, and concrete actual rates<br />
exceeded their estimated rates by 4%, 22% and 45% (respectively), on average.<br />
3.0<br />
Actual/ Estimated Productivity Rate<br />
2.5<br />
2.0<br />
1.5<br />
1.0<br />
0.5<br />
0.0<br />
1.45<br />
1.22<br />
1.04<br />
Total_Concrete<br />
Total_Steel<br />
Total_Piping<br />
(N=8) (N=17) (N=10)<br />
Figure 4-31 Actual / Estimated Construction Productivity Rate by Work Discipline<br />
43
• Actual / Estimated Total Installed Unit Cost (TIUC) 6 by Work Discipline<br />
To give some context to Figure 4-31, Figure 4-32 provides an assessment of the accuracy of unit<br />
cost estimates by craft. Due to the fact that labour accounts for about 30% of total installed unit cost<br />
(TIUC), a moderating effect exists on field productivity when other factors are considered. In fact,<br />
underestimates of 2%, 11%, and 10% were observed for piping, structural steel, and concrete,<br />
respectively. Consequently, construction labour productivity rates must be estimated with caution.<br />
Actual/ Est. Total Installed Unit Cost<br />
2.5<br />
2.0<br />
1.5<br />
1.0<br />
0.5<br />
0.0<br />
1.10 1.11<br />
1.02<br />
Total_Concrete<br />
Total_Steel<br />
Total_Piping<br />
(N=9) (N=15) (N=8)<br />
Figure 4-32 Actual / Estimated Total Installed Unit Cost (TIUC) by Work Discipline<br />
4.7 Analysis of Impact Factors<br />
Working with CII, the <strong>COAA</strong> <strong>Benchmarking</strong> Committee developed a list of 18 potential factors known<br />
to impact project cost, schedule, and engineering and construction productivity. This sub-section<br />
contains analyses of these impact factors and their relationship to cost, schedule, and overall<br />
construction productivity performance. Importantly, these analyses rely upon the subjective<br />
knowledge of industry professionals working on the <strong>Alberta</strong>-based projects contributing data for this<br />
study. Beyond the 12 impact factors routinely used by CII, the <strong>COAA</strong> <strong>Benchmarking</strong> Committee<br />
added an additional 6 factors, specifically for <strong>Alberta</strong>-based projects:<br />
6 Total installed unit cost (TIUC) is defined as the burdened cost of direct labour, bulk material, final asset equipment, and<br />
civil and sitework equipment by pro rata share including overhead and profit from both direct hire and subcontract. Burden<br />
cost of direct labour includes insurance, welfare and other fund and charges associated to labour by regulations.<br />
44
1) Quality of Field-Level Supervision<br />
2) Amount of Scheduled Overtime<br />
3) Amount of Unplanned Overtime<br />
4) Engineering Labour Skill<br />
5) Percentage of Engineering Completed Prior to Project Sanction<br />
6) Percentage of Engineering Completed Prior to Construction Start<br />
For this study, the industry professionals contributing data for each project were requested to assess<br />
whether each of these factors adversely or positively affected project performance (beyond which<br />
was planned for) using a scale ranging from “highly negative”, to “highly positive”.<br />
<strong>The</strong> results in this sub-section show the combined, relative impact of factors affecting project cost,<br />
schedule and construction productivity. In Figures 4-33, 4-35, and 4-37, each factor is ranked using<br />
the average degree of impact as reported on all projects as indicated by the symbol ( ). In these<br />
figures, the whisker line spreading out from the average indicates the dispersion of impact rating by<br />
using one standard deviation (S.D.) in both directions (i.e., -1 to +1). Notably, the factors with less<br />
than 10 responses were not reported. Consequently, some figures contain more comparisons of<br />
impact factors than others.<br />
As can be seen in Figure 4-33, the factor having the most impact on project cost (when compared to<br />
that which was planned) was the amount of unplanned overtime. This was followed closely by the<br />
percent of engineering completed prior to construction, business market conditions, craft labour skill,<br />
and coordination of plant shut down. <strong>The</strong>se are the top four impact factors on project cost and<br />
demonstrate an average impact of -0.889, -0.722, -0.565, and -0.500, respectively.<br />
Figure 4-34 provides a perspective of the impact of 16 factors on project cost growth. <strong>The</strong><br />
cumulative impact is significant and a very strong correlation exists (i.e., R 2 = 0.56). As a result, this<br />
research found that the 16 factors seen in Figure 4-33 had a large, negative impact on the cost<br />
performance of the <strong>Alberta</strong>-based projects. In all cases, these impacts (on average) were worse<br />
than the projects had planned for.<br />
45
Figure 4-33 Factors Impacting Project Cost<br />
Hi Positive<br />
Impact<br />
Hi Negative<br />
Impact<br />
Sum Degree Impact of Top 16 Factors vs. Cost Growth<br />
Sum Degree of<br />
Impact<br />
10<br />
8<br />
6<br />
4<br />
2<br />
0<br />
-1.2 -1 -0.8 -0.6 -0.4 -0.2-2<br />
0 0.2 0.4 0.6 0.8 1 1.2<br />
-4<br />
-6<br />
-8<br />
-10<br />
Poor Cost<br />
Performance<br />
Figure 4-34 Impact of Factors vs. Cost Growth<br />
Project<br />
Cost Growth<br />
As can be seen in Figure 4-35, the factor having the most impact on project schedule (when<br />
compared to that which was planned) was the percentage of engineering completed prior to<br />
construction start. This was followed closely by business market conditions, craft labour skill, quality<br />
of field-level supervision and weather conditions. <strong>The</strong> top five impact factors on project schedule<br />
demonstrate an average impact of -0.667, -0.611, -0.565, -0.525, and -0.524, respectively.<br />
46
Figure 4-36 provides a perspective of the impact of the top 18 factors on project schedule growth. In<br />
this case, no regression line has been plotted as no significant correlation exists. Nonetheless, the<br />
figure provides some evidence that the surveyed project factors do provide an impact to the<br />
schedule performance of the project. In all but one factor (on average) the impact was worse than<br />
the projects had planned for.<br />
Figure 4-35 Factors Impacting Project Schedule<br />
Sum Degree Impact of Top 18 Factors vs. Project Schedule Growth<br />
Hi Positive<br />
Impact<br />
Hi<br />
Negative<br />
Impact<br />
Sum Degree of<br />
Impact<br />
10<br />
8<br />
6<br />
4<br />
2<br />
0<br />
-1.2 -1 -0.8 -0.6 -0.4 -0.2-2<br />
0 0.2 0.4 0.6 0.8 1 1.2<br />
-4<br />
-6<br />
-8<br />
-10<br />
Poor Cost<br />
Performance<br />
Project<br />
Schedule<br />
Growth<br />
Figure 4-36 Impact of Factors vs. Schedule Growth<br />
47
As can be seen in Figure 4-37, the greatest impact factor on construction productivity (when<br />
compared to plan) was the percentage of engineering completed prior to construction start. This was<br />
followed by the amount of unplanned overtime, business market conditions, the quality of field-level<br />
supervision, and craft labour skill. <strong>The</strong> top five impact factors on construction productivity<br />
demonstrate an average of -0.833, -0.778, -0.765, -0.476 and -0.455, respectively.<br />
Figure 4-38 provides a perspective of the impact of the top 17 factors on construction productivity.<br />
Notably, a medium-strength correlation exists (i.e., R 2 = 0.27) between the CPM Index of<br />
construction productivity and the cumulative impact factors observed for each project. Indeed, this<br />
research found that the 17 factors seen in Figure 4-37 had an overall, negative impact on the<br />
construction productivity performance of the <strong>Alberta</strong>-based projects. In all cases, these impacts (on<br />
average) were worse than that which the projects had planned for.<br />
Figure 4-37 Factors Impacting Construction Productivity (Field Productivity)<br />
48
Sum Degree Impact of Top 17 Factors vs. Project Construction<br />
Productivity (CPM)<br />
Hi Positive<br />
Impact<br />
Hi Negative<br />
Impact<br />
Sum Degree of<br />
Impact<br />
10<br />
8<br />
6<br />
4<br />
2<br />
0<br />
-3 -2.5 -2 -1.5 -1 -0.5-2<br />
0 0.5 1 1.5 2 2.5 3<br />
-4<br />
-6<br />
-8<br />
-10<br />
CPM<br />
Unproductive Direct<br />
Construction Productivity<br />
Figure 4-38 Impact of Factors vs. Project Construction Productivity (CPM)<br />
5 <strong>Major</strong> Findings<br />
Through the participation of <strong>COAA</strong> members in this research, a number of major findings were made<br />
concerning the performance of major capital projects in <strong>Alberta</strong>’s heavy industry sector. However,<br />
this is only seen as a ‘first step’ on the journey of continuous improvement for many <strong>COAA</strong> members.<br />
Because the <strong>COAA</strong> benchmarking system enables each member to identify gaps in their project<br />
execution performance relative to that of their peers, the system may empower them to modify work<br />
processes or implement best practices. This type of introspection, development, and deployment is<br />
critical. Without it, industry-wide improvement is not possible.<br />
This report contains selected perspectives of observed data across multiple <strong>COAA</strong> member<br />
companies and their unique projects. Taken collectively, there are a number of significant findings<br />
amongst the projects analyzed for this research. <strong>The</strong>se are discussed next.<br />
5.1 Project Performance<br />
<strong>Alberta</strong>-based projects demonstrated significant issues with cost and schedule performance as<br />
evidenced by cost growth and schedule growth metrics used in this study. Compared to similar U.S.-<br />
based projects, these metrics were 533% and 183% higher, respectively. <strong>The</strong>se overruns are<br />
49
eyond unpredictable – they are alarming. Due to the fact that these two metrics compare actual<br />
and planned costs and durations, the estimation of anticipated costs and schedules is seemingly an<br />
issue and potentially at the heart of the capital project performance which was observed in <strong>Alberta</strong>.<br />
Several factors may be at work:<br />
1) <strong>Alberta</strong>-based projects have comparatively high proportions of indirect (to direct) cost. This<br />
study found, on average, that indirects account for 20.71% of total project cost. <strong>The</strong>se costs<br />
may be due to factors such as large projects in remote jobsites and executed in harsh<br />
climates. However, the estimation and management of indirects deserves close attention.<br />
2) This research revealed that the actual peak construction workforce was highly correlated<br />
with project cost growth. Yet, the research also discovered that, in many cases, construction<br />
productivity was not highly differential to that experienced on U.S.-based projects. Again,<br />
the proportion of indirect labor is an issue. While this study did note that higher amounts of<br />
construction indirect labor hours results in better schedule performance, a renewed effort to<br />
accurately estimate peak workforce, indirect cost, construction productivity, and unit cost is<br />
suggested. Additional benchmarking data can be useful for this purpose.<br />
3) A number of <strong>Alberta</strong>-based projects submitted for this study began construction with less<br />
than 30% engineering complete. CII has conducted many previous studies that show that<br />
the most appropriate time to start construction is when more than 60% of engineering is<br />
complete. This dichotomy reveals itself in metrics related to construction phase growth and<br />
construction productivity, amongst others. Mobilizing to the field too soon is often<br />
accompanied by negative cost growth and construction productivity rates.<br />
4) <strong>Alberta</strong>-based project management teams frequently fail to recognize that project cost<br />
growth is driven by, and managed through, scope and project development changes. As<br />
can be seen in Figure 5-1, U.S.-based projects report virtually all variance in actual project<br />
costs as change. This is visually represented as the near-overlay of the U.S. trend line with<br />
a line of unity between cost growth and change cost factor. Such is not the case with the<br />
<strong>Alberta</strong> project data set, which consistently experience cost growths which far exceed their<br />
associated change cost factors.<br />
50
1.4<br />
1.2<br />
Location<br />
<strong>Alberta</strong><br />
U.S.<br />
Project Cost Growth<br />
1.0<br />
0.8<br />
0.6<br />
0.4<br />
0.2<br />
0.0<br />
-0.2<br />
-0.4<br />
-0.4<br />
-0.2<br />
0.0<br />
0.2<br />
0.4<br />
0.6<br />
0.8<br />
1.0<br />
1.2<br />
1.4<br />
Project Change Cost Factor<br />
Figure 5-1 Project Change Cost Factor vs. Project Cost Growth<br />
5.2 Productivity<br />
Despite the wide range of observed capital project performance in <strong>Alberta</strong>, this research found that<br />
engineering productivity as well as construction rework and productivity were comparable to similar<br />
U.S.-based projects in some disciplines. However, construction productivity in some disciplines was<br />
much worse than U.S. projects. <strong>The</strong>se points are especially applicable when considered and<br />
measured at the discipline level for both engineering and construction labour productivity. However,<br />
it should be noted that this research measured productivity as a ratio of direct work hours to issued<br />
for construction (IFC) quantities for engineering and to installed quantities for construction.<br />
5.3 Impact Factors<br />
An array of factors exist that impact the performance of capital projects. Using the subjective<br />
evaluation of experienced project professionals, this research was able to categorize the primary<br />
factors impacting the cost, schedule, and construction productivity of <strong>Alberta</strong>-based projects.<br />
Surprisingly, there was a fair amount of consistency with the objective findings of this research. <strong>The</strong><br />
top five ranked factors are listed in Table 5-1 according to their impact on cost, schedule, and<br />
construction productivity performance. In many cases, the top five factors were contrary to popular<br />
opinion (as surveyed) as they dealt with both managerial and site-related issues.<br />
51
Table 5-1 <strong>The</strong> Top 5 Factors Affecting Cost, Schedule or Productivity<br />
Rank Cost Schedule Productivity<br />
1 Amount of Unplanned<br />
Overtime<br />
2 % Engineering completion<br />
prior to Construction Start<br />
% Engineering completion<br />
prior to Construction Start<br />
Business Market<br />
Conditions<br />
% Engineering completion<br />
prior to Construction Start<br />
Amount of Unplanned<br />
Overtime<br />
3 Business Market Conditions Craft Labour Skill Business Market Conditions<br />
4 Craft Labour Skill Quality of Field Level<br />
Supervision<br />
5 Coordination with Plant<br />
Shutdown<br />
Weather Conditions<br />
Quality of Field Level<br />
Supervision<br />
Craft Labour Skill<br />
5.4 Project Management<br />
Project management best practices make a huge difference in the performance of capital projects.<br />
Better implementation of Project Risk Assessment is shown to significantly reduce project cost<br />
growth. Constructability reviews can reduce project schedule growth as much as 50%. Not<br />
surprisingly, planning for startup improves startup phase cost performance. While insufficient data<br />
were available to examine the effects of workface planning on project performance, it is believed that<br />
its influence may be limited in an environment where effective project management is lacking. <strong>The</strong><br />
dedicated implementation of proven project management practices such as front-end planning,<br />
constructability reviews, and project risk assessment during a project’s earliest phases will maximize<br />
the project’s potential to achieve high levels of performance.<br />
52
6 Conclusions and Recommendations<br />
In recent years, numerous global forces have been at work dramatically altering the worldwide<br />
marketplace for energy. <strong>The</strong>se forces have also led to a significant increase in the amount of<br />
investment and project activity in <strong>Alberta</strong> surrounding its oil sands resources. Owner companies<br />
holding leases in the oil sands accelerated their development of capital projects needed for<br />
increased production during the study period. This acceleration of the pace of development may be<br />
explanatory to the findings and results of this study. To be sure, the increased pace and amount of<br />
capital projects in <strong>Alberta</strong> resulted in many effects observed in this research. <strong>The</strong>se effects were<br />
further compounded by extremes experienced in <strong>Alberta</strong> related to such things as labour availability,<br />
harsh weather conditions, and remote project locations, amongst others. Yet, the benefit of this<br />
research is that it was able to objectively quantify the performance of observed projects and the<br />
impact of certain factors submitted for this study.<br />
<strong>The</strong> research began with an overarching focus on engineering and construction productivity. <strong>The</strong><br />
implied belief was that productivity in <strong>Alberta</strong> was a prime component in the observed performance<br />
of its capital projects. <strong>The</strong> definitions of productivity adopted by <strong>COAA</strong>’s benchmarking committee<br />
were those used for many years by CII. Notably, these primarily measured direct productivity, that is,<br />
the ratio of work hours to installed quantities. By definition, they did not include indirect labour or<br />
costs. Because the <strong>COAA</strong> productivity definitions were common to CII, comparisons to U.S.<br />
productivity data were possible. For the projects included in this study, actual direct productivity for<br />
both engineering and construction was very similar to that observed in the United States. However,<br />
the observed project performance between <strong>Alberta</strong> and U.S. projects was differential in favor of the<br />
latter.<br />
Further investigation revealed that <strong>Alberta</strong> projects typically overestimate their direct productivity.<br />
For example, on average, actual construction productivity was 45% and 22% worse than estimated<br />
for concrete and steel craft workers, respectively. This overestimation is compounded by much<br />
higher amounts of indirect labour and cost required for <strong>Alberta</strong> projects when compared to U.S.<br />
projects. On average, 25% of hours worked were for indirect labour and almost half of the projects<br />
submitted experienced construction indirect costs more than 25% higher than estimated. Taken<br />
together, the underestimation of total labour required yielded significant resource peaks much higher<br />
than estimated which showed strong correlations with upward project cost growth. <strong>The</strong> analysis of<br />
this trend indicates that projects experiencing labour (direct and indirect) peaks of 50% more than<br />
estimated experienced project cost growth approaching 40%.<br />
53
It is worth mentioning that all the projects reported for this research that were executed in <strong>Alberta</strong><br />
used cost reimbursable contracts for their construction phase. This may have an impact on some of<br />
the project performance metrics reported here. Importantly, the <strong>Alberta</strong>-based projects presented<br />
here consistently demonstrate that large projects often experience much higher amounts of<br />
construction indirect cost growth when compared with their smaller counterparts. Given the<br />
anticipated number of planned projects exceeding $1 Billion (CDN) of total installed cost, the proper<br />
estimation and control of both direct and indirect costs is paramount. Future projects should not<br />
experience a range of project cost growth from -25% to 69% if the learnings from this report are<br />
applied effectively. Predictability in estimating and project management is needed. Here,<br />
management best practices such as project risk assessment, planning for startup, and<br />
constructability reviews are already showing significant abilities to impact project performance.<br />
Proper application of best practices would alleviate situations where 19% average cost growth was<br />
addressed using only 8% contingency (on average), for example. Indeed, improvement is needed in<br />
management-related aspects of planning, estimating, and controlling work. This is not just a<br />
contractor issue; owners routinely gave full funding authorization to projects with as little as 10%<br />
engineering complete. A thorough evaluation of management policies and procedures is<br />
recommended.<br />
<strong>The</strong> path forward is bright. While a focus on improved engineering and construction productivity is<br />
always warranted, quicker improvement is possible through increased focus on application of better<br />
project management practices. For owners, adherence to effective planning through asset<br />
development processes (ADP’s) tailored to <strong>Alberta</strong> projects may be helpful. For contractors, revised<br />
emphasis on effective project execution plans (PEP’s) may be needed. Intensive implementation of<br />
industry best practices and stern adherence to basic project management practices is recommended.<br />
Fortunately, the lessons of the past few years have created an improved awareness and added<br />
experience to the abilities of <strong>Alberta</strong>-based companies and personnel to manage the unique projects<br />
found in <strong>Alberta</strong>. Regardless, the only way to truly and objectively know whether or not project<br />
execution is improving is through continued measurement. Continued use of benchmarking products<br />
in current and additional aspects will generate improved intelligence concerning <strong>Alberta</strong>-based<br />
projects. <strong>The</strong>re is ample reason to suspect that tomorrow’s projects will be much better than those<br />
executed today.<br />
54
Appendices<br />
55
Appendix A: <strong>Summary</strong> of Correlation between Project Performance and Related Factors of <strong>Alberta</strong> Based <strong>Projects</strong><br />
Table A- 1 Correlations of Project Characteristics with Project Performance<br />
Project Characteristics<br />
Total Project Cost<br />
($M CDN)<br />
Total Project<br />
Duration (weeks)<br />
Construction<br />
Duration (weeks)<br />
% Contingency<br />
Budget<br />
% Eng. completed<br />
before con.<br />
started<br />
Performance Metric 1 N r N r N r N r N r<br />
COST<br />
Project Cost Growth 23 0.468 22 0.017 21 0.714 17 -0.591 19 -0.551<br />
Project Budget Factor 23 0.499 22 0.362 21 0.522 17 -0.456 19 -0.248<br />
Construction Phase Cost Growth 18 -0.004 17 0.280 16 0.496 16 -0.470 14 -0.723*<br />
Construction Indirect Cost Growth 17 0.599* 16 0.487 15 0.751 15 -0.429 14 -0.679<br />
Startup Cost Growth 9 -0.162 10 -0.211 10 0.070 10 -0.177 8 -0.190<br />
SCHEDULE<br />
Project Schedule Growth 21 0.031 23 0.122 22 0.096 17 0.029 21 -0.117<br />
Project Schedule Factor 21 -0.056 23 -0.169 22 -0.233 17 0.285 21 -0.105<br />
Construction Phase Schedule Growth 20 -0.059 22 0.201 22 0.195 17 -0.254 20 0.016<br />
Startup Schedule Growth 17 -0.166 18 -0.129 18 -0.067 14 -0.120 16 -0.005<br />
CHANGES<br />
Total Change Cost Factor 14 0.055 15 0.429 15 0.499 12 -0.360 15 0.358<br />
Development Change Cost Factor 10 0.142 11 0.471 11 0.677 11 -0.556 10 -0.655<br />
Scope Change Cost Factor 12 0.148 13 0.497 13 0.460 10 -0.081 12 -0.469<br />
REWORK<br />
Field Rework Cost Factor 8 -0.174 8 0.411 8 0.083 8 0.394 8 0.418<br />
SAFETY<br />
Lost time Frequency (LTF) © © 8 -0.260 8 -0.482 © © © ©<br />
Lost Time Severity (LTS) 17 0.733 17 0.481 17 0.481 14 -0.447 15 -0.227<br />
PRODUCTIVITY<br />
Engineering Productivity (EPM Index) 20 0.329 22 0.203 20 0.518 15 -0.652 19 -0.401<br />
Construction Productivity (CPM Index) 20 -0.364* 19 -0.161 19 -0.128 15 0.143 17 -0.226<br />
1 Metric and phase definitions are provided in Appendix A.<br />
© indicate small sample size (N
Table A- 2 Correlations of Project Characteristics with Project Performance (cont’d)<br />
Performance Metrics<br />
%<br />
Modularization<br />
*<br />
% Offsite<br />
Work-hours<br />
Project Characteristics<br />
% Construction<br />
Indirect/Direct<br />
WH*<br />
%<br />
Construction<br />
Ind./ Dir. Cost*<br />
Actual/ Est.<br />
Peak<br />
Workforce<br />
% Scaffolding/<br />
Direct WH<br />
N r N r N r N r N r N r<br />
COST<br />
Project Cost Growth 22 -0.236 22 -0.119 19 -0.379 17 -0.033 20 0.787* 18 0.362<br />
Project Budget Factor 22 -0.114 22 -0.003 19 -0.353 17 -0.203 20 0.598 18 0.252<br />
Construction Phase Cost Growth 1 17 -0.211 17 -0.244 15 -0.307 17 -0.013 15 0.773 15 0.188<br />
Construction Indirect Cost Growth 16 -0.282 16 -0.413 14 -0.010 17 0.095 14 0.596 15 0.705<br />
Startup Cost Growth 10 -0.542 10 -0.271 10 0.537 8 -0.201 10 0.347 9 0.348<br />
SCHEDULE<br />
Project Schedule Growth 22 -0.362 22 -0.583 19 -0.194 15 0.055 21 0.543 17 -0.097<br />
Project Schedule Factor 22 0.081 22 -0.004 19 -0.446* 15 -0.109 21 0.314 17 -0.030<br />
Construction Phase Schedule Growth 21 -0.647 21 -0.337 19 0.067 14 0.144 21 0.486 17 0.020<br />
Startup Schedule Growth 18 -0.210 18 -0.425 18 -0.110 11 -0.206 19 0.402 16 -0.050<br />
CHANGES<br />
Total Change Cost Factor 16 -0.326 16 -0.386 16 0.511 10 0.356 16 -0.200 15 -0.261<br />
Development Change Cost Factor 11 -0.343 11 -0.530 11 -0.244 10 0.044 11 0.809 10 0.326<br />
Scope Change Cost Factor 13 -0.279 13 -0.184 13 0.063 8 0.588 13 -0.003 12 0.445<br />
REWORK<br />
Field Rework Cost Factor 11 0.242 11 0.406 10 -0.013 9 -0.121 10 -0.158 11 -0.347<br />
SAFETY<br />
Lost time Frequency (LTF) 8 0.629 8 0.672 8 -0.382 © © 8 -0.387 © ©<br />
Lost Time Severity (LTS) 18 -0.112 18 0.091 18 -0.327 13 0.512 19 0.520 17 0.171<br />
PRODUCTIVITY<br />
Engineering Productivity (EPM Index) 22 -0.201 22 -0.168 17 0.029 13 0.345 19 0.282 15 0.643<br />
Construction Productivity (CPM Index) 20 -0.387 20 -0.119 19 0.178 14 -0.093 20 -0.078 18 0.059<br />
57
Table A- 3 Correlations of Practices with Project Performance<br />
Practices<br />
Performance Metrics<br />
FEP PDRI PRA<br />
Team<br />
Building<br />
Alignment<br />
Design for<br />
Maintainability<br />
Constructability<br />
Material<br />
Mgmt.<br />
N r N r N r N r N r N r N r N r<br />
COST<br />
Project Cost Growth 21 0.560 17 0.119 21 -0.436* 22 0.197 21 0.308 15 -0.314 22 -0.036 22 -0.394<br />
Project Budget Factor 21 0.510 17 -0.165 5 0.252 22 0.151 21 0.265 15 0.075 22 0.066 22 -0.376<br />
Construction Phase Cost Growth 16 0.532 12 0.281 5 0.170 17 0.098 17 0.118 14 -0.437 17 -0.284 17 -0.240<br />
Construction Indirect Cost Growth 15 0.731 11 -0.444 15 -0.205 16 0.192 16 0.431 13 -0.078 16 -0.091 16 0.116<br />
Startup Cost Growth 10 0.544 © © © © 10 -0.517 10 -0.411 9 -0.625 10 -0.375 10 -0.351<br />
SCHEDULE<br />
Project Schedule Growth 23 0.224 19 -0.134 7 0.083 23 -0.200 22 -0.321 17 -0.230 24 -0.528* 24 -0.635<br />
Project Schedule Factor 23 -0.097 19 -0.229 7 0.431 23 -0.195 22 -0.368 17 -0.079 24 -0.296 24 -0.534<br />
Construction Phase Schedule Growth 22 0.333 18 0.062 7 -0.166 22 -0.215 21 -0.268 16 -0.487 23 -0.474 23 -0.523<br />
Startup Schedule Growth 19 0.142 15 0.152 6 0.179 18 -0.207 18 -0.411 14 -0.204 19 -0.715 19 -0.299<br />
CHANGES<br />
Total Change Cost Factor 16 0.126 12 0.249 16 0.158 15 0.025 15 0.202 11 0.284 16 0.091 16 0.338<br />
Development Change Cost Factor 11 0.285 © © 11 -0.775 11 0.002 11 0.163 9 -0.670 11 -0.379 11 -0.477<br />
Scope Change Cost Factor 13 0.432 9 -0.441 13 0.032 13 -0.077 13 0.365 8 -0.402 13 -0.108 13 0.050<br />
REWORK<br />
Field Rework Cost Factor 9 -0.390 © © 9 0.415 8 0.636 8 0.282 © © 9 0.351 9 0.181<br />
SAFETY<br />
Lost time Frequency (LTF) 8 -0.815 © © 8 0.610 8 0.565 8 0.316 © © 8 0.461 8 -0.077<br />
Lost Time Severity (LTS) 18 0.300 14 -0.505 18 -0.322 17 0.111 17 0.247 13 -0.203 18 0.217 18 -0.654<br />
PRODUCTIVITY<br />
Engineering Productivity (EPM Index) 22 0.569 18 0.022 22 -0.221 22 0.221 21 0.292 16 -0.049 22 -0.197 22 0.046<br />
Construction Productivity (CPM Index) 19 0.316 16 0.132 19 -0.221 19 -0.540 18 -0.397 13 -0.768 20 -0.312 20 0.000<br />
58
Table A- 4 Correlations of Practices with Project Performance (cont’d)<br />
Performance Metrics<br />
Change Mgmt.<br />
Zero Accident<br />
Tech.<br />
Practices<br />
Quality Mgmt. A/I Technology<br />
Planning for<br />
Startup<br />
PPMOF<br />
Workface<br />
Planning<br />
N r N r N r N r N r N r N r<br />
COST<br />
Project Cost Growth 22 -0.050 19 0.460 21 0.001 20 -0.617 20 0.808 19 0.278<br />
© ©<br />
Project Budget Factor 22 -0.165 19 0.282 21 0.050 20 -0.481 20 -0.731 19 0.364 © ©<br />
Construction Phase Cost Growth 17 -0.033 15 0.427 17 -0.386 15 -0.584 15 -0.750 14 0.086 © ©<br />
Construction Indirect Cost Growth 16 0.364 14 0.559 16 -0.288 14 -0.619 14 -0.515 13 0.345 © ©<br />
Startup Cost Growth 10 -0.559 10 0.533 10 -0.094 10 -0.588 10 -0.450* 9 -0.253 © ©<br />
SCHEDULE<br />
Project Schedule Growth 24 -0.182 21 0.107 23 -0.171 21 -0.358 22 -0.431 21 0.331<br />
© ©<br />
Project Schedule Factor 24 -0.291 21 -0.202 23 -0.171 21 -0.012 22 -0.365 21 0.055 © ©<br />
Construction Phase Schedule Growth 23 -0.340 21 0.288 22 -0.209 20 -0.508 22 -0.429 21 0.053 © ©*<br />
Startup Schedule Growth 19 -0.060 19 0.206 19 -0.408 18 -0.311 19 -0.087 18 0.213 © ©<br />
CHANGES<br />
Total Change Cost Factor 16 0.305 16 0.213 16 0.174 15 -0.399 16 0.356 15 0.266<br />
© ©<br />
Development Change Cost Factor* 11 0.075 11 0.325 11 0.161 11 -0.437 11 -0.544 10 -0.322 © ©<br />
Scope Change Cost Factor* 13 0.177 13 0.462 13 -0.227 13 -0.362 13 -0.270 12 0.376 © ©<br />
REWORK<br />
Field Rework Cost Factor 9 0.088 9 -0.594 9 0.425 8 0.717 9 0.518 9 0.368<br />
SAFETY<br />
Lost time Frequency (LTF) 8 -0.204 8 -0.003 8 0.247 8 0.759 8 0.034<br />
© ©<br />
© © © ©<br />
Lost Time Severity (LTS) 18 -0.350 18 0.045 18 0.412 17 -0.237 18 -0.748 17 0.407 © ©<br />
PRODUCTIVITY<br />
Engineering Productivity (EPM Index) 22 -0.058 18 0.525 21 -0.458 21 -0.543 20 -0.178 19 -0.062<br />
© ©<br />
Construction Productivity (CPM Index) 20 -0.170 19 0.077 19 -0.201 18 -0.368 19 -0.023 18 -0.166 © ©<br />
59
Appendix B: Performance Metric Formulas and Definitions<br />
Performance Metric Category: COST<br />
Formula:<br />
Metric: Project Cost Growth<br />
Actual Total Project Cost - Initial Predicted Project Cost<br />
Initial Predicted Project Cost<br />
Metric: Delta Cost Growth<br />
Formula:<br />
| Cost Growth |<br />
Metric: Project Budget Factor<br />
Formula:<br />
Actual Total Project Cost<br />
Initial Predicted Project Cost +Approved Changes<br />
Metric: Delta Budget Factor<br />
Formula:<br />
| 1- Budget Factor |<br />
Metric: Phase Cost Factor<br />
Metric: Phase Cost Growth<br />
Definition of Terms<br />
Actual Total Project Cost:<br />
• Owners –<br />
o<br />
o<br />
All actual project cost from front end<br />
planning through startup<br />
Exclude land costs but include in-house<br />
salaries, overhead, travel, etc.<br />
• Contractors – Total cost of the final scope of work.<br />
Initial Predicted Project Cost:<br />
• Owners – Budget at the time of Project Sanction.<br />
• Contractors – Cost estimate used as the basis of<br />
contract award.<br />
Formula:<br />
Formula:<br />
Actual Phase Cost<br />
Actual Total Project Cost<br />
Actual Phase Cost – Initial Predicted Phase Cost<br />
Initial Predicted Phase Cost<br />
Actual Phase Cost:<br />
• All costs associated with the project phase in<br />
question.<br />
• See the Project Phase Table in Appendix C for phase<br />
definitions.<br />
Initial Predicted Phase Cost:<br />
• Owners – Budget at the time of Project Sanction.<br />
• Contractors – Budget at the time of contract award.<br />
• See the Project Phase Table in Appendix C for phase<br />
definitions.<br />
Approved Changes:<br />
• Estimated cost of owner-authorized changes.<br />
60
Performance Metric Category: SCHEDULE<br />
Metric: Project Schedule Growth<br />
Formula:<br />
Actual Total Proj. Duration - Initial Predicted Proj. Duration<br />
Initial Predicted Proj. Duration<br />
Metric: Delta Schedule Growth<br />
Formula:<br />
| Schedule Growth |<br />
Metric: Project Schedule Factor<br />
Formula:<br />
Actual Total Project Duration<br />
Initial Predicted Project Duration + Approved Changes<br />
Metric: Delta Schedule Factor<br />
Formula:<br />
| 1- Schedule Factor |<br />
Metric: Phase Duration Factor<br />
Formula:<br />
Actual Phase Duration<br />
Actual Overall Project Duration<br />
Metric: Total Project Duration<br />
Actual Total Project Duration (weeks)<br />
Metric: Phase Schedule Growth<br />
Formula:<br />
Actual Phase Duration – Initial Predicted Phase Duration<br />
Initial Predicted Phase Duration<br />
Definition of Terms<br />
Actual Total Project Duration:<br />
(Detailed Engineering through Start-up)<br />
• Owners – Duration from beginning of detailed<br />
engineering to turnover to user.<br />
• Contractors - Total duration for the final scope<br />
of work from mobilization to completion.<br />
Actual Overall Project Duration:<br />
(Front End Planning through Start-up)<br />
• Unlike Actual Total Duration, Actual Overall<br />
Duration also includes time consumed for the<br />
Front End Planning Phase.<br />
Actual Phase Duration:<br />
• Actual total duration of the project phase in question.<br />
See the Project Phase Table in Appendix C for phase<br />
definitions.<br />
Initial Predicted Project Duration:<br />
• Owners – Predicted duration at the time of Project<br />
Sanction.<br />
• Contractors - <strong>The</strong> contractor's duration estimate at<br />
the time of contract award.<br />
Approved Changes<br />
• Estimated duration of owner-authorized changes.<br />
61
Performance Metric Category: SAFETY<br />
Metric: Lost Time Frequency (LTF)<br />
Formula:<br />
Total Number of Lost Time cases x 200,000<br />
Total Site Work-Hours<br />
Metric: Medical Aid Frequency (MAF)<br />
Metric: First Aid Frequency (FAF)<br />
Metric: Total Recordable Injury Frequency<br />
(TRIF)<br />
Formula:<br />
Formula:<br />
Formula:<br />
Total Number of Medical Aid Cases x 200,000<br />
Total Site Work-Hours<br />
Total Number of First Aid Cases x 200,000<br />
Total Site Work-Hours<br />
Total Number of Recordable Cases x 200,000<br />
Total Site Work-Hours<br />
Metric: Total Injury Frequency (TIF)<br />
Formula:<br />
Total number of all injury or illness cases x 200,000<br />
Total Site Work-Hours<br />
Metric: Restricted Work Frequency (RWF)<br />
Formula:<br />
Total Number of Restricted Work Cases x 200,000<br />
Total Site Work-Hours<br />
Metric: Lost Time Severity Rate (LTSR)<br />
Formula:<br />
Total Number of Lost Time Workdays x 200,000<br />
Total Site Work-Hours<br />
Metric: Total Severity Rate (TSR)<br />
Formula:<br />
Total Number of Recordable Lost Time Cases<br />
and all Restricted Work Cases x 200,000<br />
Total Site Work-Hours<br />
62
Performance Metric Category: SAFETY (cont’d.)<br />
Definition of Terms<br />
• Lost Time Days: Equals the number of scheduled work days away from work as a result of an<br />
occupational injury or illness, disabling injury or illness which prevents a worker from reporting to<br />
work on next regularly scheduled.<br />
• Medical Aid Case: Any occupational injury or illness requiring medical treatment administered by a<br />
physician, not including first aid treatment<br />
• First Aid Case: Any one time treatment which does not require medical care or further medical aid<br />
e.g. minor scratches, cuts, burns, splinters.<br />
• Recordable Case: A work event or exposure that is the discernable cause of an injury or illness or<br />
of a significant aggravation to a pre-existing condition. A recordable case requires medical aid,<br />
restricted work in relation to either medical aid or lost time, or fatality.<br />
• Total number of all injury or illness cases: Equals the number of lost time (LT) cases, medical aid<br />
(MA) cases, first aid (FA) cases and the number of restricted work cases for lost time (RWLT),<br />
medical aid (RWMA) and first aid (RWFA).<br />
• Total Number of Restricted Work Cases: Equals the number of restricted work lost time cases,<br />
restricted work medical aid cases and restricted work first aid cases.<br />
• Lost Time Case: Lost Time cases are the result of an occupational injury or illness including any<br />
disabling injury which prevents a worker from reporting to work on his/her next regularly scheduled.<br />
• Restricted Work Case: Includes restricted work lost time cases, restricted work medical aid cases<br />
and restricted work first aid cases.<br />
• Restricted Work Days: Equals the number of scheduled work days that the worker was unable to<br />
work their regular duties as a result of an injury or illness as defined in restricted work.<br />
• Total Number of Recordable Lost Time Cases and all Restricted Work Cases: Includes the<br />
number of lost workdays plus the number of restricted work days for all lost time, medical aid and<br />
first aids.<br />
63
Performance Metric Category: CHANGES<br />
Metric: Scope Change Cost Factor<br />
Metric: Project Development Change Cost Factor<br />
Formula:<br />
Formula:<br />
Total Cost of Scope Changes<br />
Actual Total Project Cost<br />
Total Cost of Project Development Changes<br />
Actual Total Project Cost<br />
Definition of Terms<br />
• Total Cost of Scope Changes: Total cost impact<br />
of scope and project development changes.<br />
• Total Cost of Project Development Changes:<br />
Total cost impact of project development<br />
changes.<br />
Actual Total Project Cost:<br />
• Owners –<br />
o All actual project cost from front end planning<br />
through startup<br />
o Exclude land costs but include in-house<br />
salaries, overhead, travel, etc.<br />
• Contractors – Total cost of the final scope of work.<br />
Performance Metric Category: REWORK<br />
Metric: Total Field Rework Factor<br />
Formula:<br />
Total Direct Cost of Field Rework<br />
Actual Construction Phase Cost<br />
Definition of Terms<br />
• Total Direct Cost of Field Rework: Total direct<br />
cost of field rework regardless of initiating cause.<br />
• Actual Construction Phase Cost: All costs associated<br />
with the construction phase. See the Project Phase<br />
Table in Appendix C for construction phase definition.<br />
64
Construction Productivity and Total Installed Unit Cost (TIUC)<br />
Metrics Categories and Breakouts<br />
Concrete<br />
- Total Concrete<br />
o Slabs (CM)<br />
• On-Grade (CM)<br />
• Elevated Slabs/On Deck (CM)<br />
• Area Paving (CM)<br />
o Foundations (CM)<br />
• < 4 CM<br />
• 4 – 15 CM<br />
• 15 –38 CM<br />
• ≥ 38 CM<br />
o Concrete Structures (CM)<br />
Structural Steel<br />
- Total Structural Steel (MT)<br />
o Structural Steel (MT)<br />
o Pipe Racks & Utility Bridges (MT)<br />
o Miscellaneous Steel (MT)<br />
Instrumentation<br />
- Loops (Count)<br />
- Devices (Count)<br />
Piping<br />
- Small Bore (2-1/2” & Smaller) (LM)<br />
o Carbon Steel (LM)<br />
o Stainless Steel (LM)<br />
o Chrome (LM)<br />
o Other Alloys (LM)<br />
o Non Metallic (LM)<br />
- Inside Battery Limits (ISBL) (LM)<br />
Large Bore (3” & Larger) (LM)<br />
o Carbon Steel (LM)<br />
o Stainless Steel (LM)<br />
o Chrome (LM)<br />
o Other Alloys (LM)<br />
o Non Metallic (LM)<br />
- Outside Battery Limits (OSBL) (LM)<br />
Large Bore (3” & Larger) (LM)<br />
o Carbon Steel (LM)<br />
o Stainless Steel (LM)<br />
o Chrome (LM)<br />
o Other Alloys (LM)<br />
o Non Metallic (LM)<br />
- Heat Tracing Tubing (LM)<br />
Electrical<br />
- Total Electrical Equipment (Each)<br />
o Panels and Small Devices (Each)<br />
o Electrical Equipment below 1kV (Each)<br />
o Electrical Equipment over 1kV (Each)<br />
- Conduit (LM)<br />
o Exposed or Above Ground Conduit (LM)<br />
o Underground, Duct Bank or Embedded Conduit (LM)<br />
- Cable Tray (LM)<br />
- Wire and Cable (LM)<br />
o Control Cable (LM)<br />
o Power and Control Cable below 1kV (LM)<br />
o Power Cable above 1kV (LM)<br />
- Transmission Line (LM)<br />
o High Voltage above 25kV (LM)<br />
- Other Electrical Metrics<br />
o Lighting (Each)<br />
o Grounding (LM)<br />
o Electrical Heat Tracing (LM)<br />
Equipment<br />
- Pressure Vessels (Field Fab.& Erected) (Each), (MT)<br />
- Atmospheric Tanks (Shop Fabricated) (Each), (MT)<br />
- Atmospheric Tanks (Field Fabricated) (Each), (MT)<br />
- Heat Transfer Equipment (Each), (MT)<br />
- Boiler & Fired Heaters (Each), (MT)<br />
- Rotating Equipment (Each), (HP)<br />
- Material Handling Equipment (Each), (MT)<br />
- Power Generation Equipment (Each), (kW)<br />
- Other Process Equipment (Each), (MT)<br />
- Modules & Pre-assembled Skids (Each), (MT)<br />
Insulation<br />
- Equipment<br />
o Insulation Equipment (SM)<br />
- Piping<br />
o Insulation Piping (ELM)<br />
Module Installation<br />
- Pipe Racks (MT)<br />
- Process Equipment Modules (MT)<br />
- Building (SM)<br />
Scaffolding<br />
- Scaffolding Work-Hours/ Total Direct Hours<br />
Construction Work-Hours<br />
- Construction Indirect/ Direct Work-Hours<br />
Construction Productivity Unit Rate =<br />
Productivity Estimating Performance =<br />
Direct Work hours<br />
Installed Quantity<br />
Actual Productivity Rate<br />
Estimated Productivity Rate<br />
Cost Estimating Performance = Actual TIUC<br />
Estimated TIUC<br />
65
Engineering Productivity Metrics Categories and Breakouts<br />
Concrete<br />
- Total Concrete (CM)<br />
o Total Slabs (CM)<br />
• Ground and Supported Slab (CM)<br />
• Area Paving (CM)<br />
o Total Foundations (except Piling) (CM)<br />
• Foundation (
Project Phase Definition Table<br />
Project Phase Start/Stop Typical Activities & Products Typical Cost Elements<br />
Front End Planning<br />
Typical Participants:<br />
• Owner Personnel<br />
• Planning Consultants<br />
• Constructability<br />
Consultant<br />
• Alliance / Partner<br />
Start: Single project adopted<br />
and Formal project team<br />
established<br />
Stop: Project Sanction<br />
• Options Analysis<br />
• Life-cycle Cost Analysis<br />
• Project Execution Plan<br />
• Appropriation Submittal Pkg<br />
• P&IDs and Site Layout<br />
• Project Scoping<br />
• Procurement Plan<br />
• Arch. Rendering<br />
• Owner Planning Team Personnel Expenses<br />
• Consultant Fees & Expenses<br />
• Environmental Permitting Costs<br />
• Project Manager / Construction Manager Fees<br />
• Licensor Costs<br />
Detail Engineering<br />
Typical Participants:<br />
• Owner Personnel<br />
• Design Contractor<br />
• Constructability Expert<br />
• Alliance / Partner<br />
Start: Contract award to<br />
engineering firm<br />
Stop: Release of all approved<br />
drawings and specs for<br />
Construction (or last<br />
package for fast-track)<br />
• Drawing & spec. preparation<br />
• Bill of material preparation<br />
• Procurement Status<br />
• Sequence of operations<br />
• Technical Review<br />
• Definitive Cost Estimate<br />
• Owner Project Management<br />
Personnel<br />
• Designer Fees<br />
• Project Manager / Construction<br />
Manager Fees<br />
Procurement<br />
Typical Participants:<br />
• Owner personnel<br />
• Design Contractor<br />
• Alliance / Partner<br />
Start: Procurement plan for<br />
engineered equipment<br />
Stop: All major equipment<br />
has been delivered to site<br />
• Vendor Qualification<br />
• Vendor Inquiries<br />
• Bid Analysis<br />
• Purchasing<br />
• Expediting<br />
• Engineered Equipment<br />
• Transportation<br />
• Vendor QA/QC<br />
• Owner project management personnel<br />
• Project Manager / Construction<br />
Manager fees<br />
• Procurement & Expediting personnel<br />
• Engineered Equipment<br />
• Transportation<br />
• Shop QA / QC<br />
Note: <strong>The</strong> demolition / abatement phase should be reported when the demolition / abatement work is a separate schedule activity (potentially paralleling the<br />
design and procurement phases) in preparation for new construction. Do not report the demolition / abatement phase if the work is integral with<br />
modernization or addition activities.<br />
67
Project Phase Table (Cont.)<br />
Project Phase Start/Stop Typical Activities & Products Typical Cost Elements<br />
Construction<br />
Typical Participants:<br />
• Owner personnel<br />
• Design Contractor<br />
(Inspection)<br />
• Construction Contractor and<br />
its subcontractors<br />
Start: Commencement of<br />
foundations or driving<br />
Piles<br />
Stop: Mechanical Completion<br />
• Set up trailers<br />
• Procurement of bulks<br />
• Issue Subcontracts<br />
• Construction plan for<br />
Methods/Sequencing<br />
• Build Facility & Install<br />
Engineered Equipment<br />
• Complete Punchlist<br />
• Demobilize construction<br />
equipment<br />
• Warehousing<br />
• Owner project management personnel<br />
• Project Manager / Construction<br />
Manager fees<br />
• Building permits<br />
• Inspection QA/QC<br />
• Construction labour, equipment &<br />
supplies<br />
• Bulk materials (including freight)<br />
• Construction equipment (including<br />
freight)<br />
• Contractor management personnel<br />
• Warranties<br />
Start-up / Commissioning<br />
Note: Does not usually apply to<br />
infrastructure or building type<br />
projects<br />
Typical Participants:<br />
• Owner personnel<br />
• Design Contractor<br />
• Construction Contractor<br />
• Training Consultant<br />
• Equipment Vendors<br />
Start: Mechanical Completion<br />
Stop: Custody transfer to<br />
user/operator (steady<br />
state operation)<br />
• Testing Systems<br />
• Training Operators<br />
• Documenting Results<br />
• Introduce Feedstocks and<br />
obtain first Product<br />
• Hand-off to user/operator<br />
• Operating System<br />
• Functional Facility<br />
• Warranty Work<br />
• Owner project management personnel<br />
• Project Manager / Construction<br />
Manager fees<br />
• Consultant fees & expenses<br />
• Operator training expenses<br />
• Wasted feedstocks<br />
• Vendor fees<br />
68
Appendix C: Glossary<br />
General Terms<br />
Addition (Add-on) – A new addition that ties in to an existing facility, often intended to expand capacity.<br />
Grass Roots, Green Field – A new facility from the foundations and up. A project requiring demolition of<br />
an existing facility before new construction begins is also classified as grass roots.<br />
Modernization, Renovation, Upgrade– A facility for which a substantial amount of the equipment,<br />
structure, or other components is replaced or modified, and which may expand capacity and/or improve<br />
the process or facility.<br />
Percent Offsite Construction Labour Hours– <strong>The</strong> level of offsite labour hours for building modules.<br />
This value should be determined as a ratio of the offsite labour hours of all modules divided by total<br />
construction hours.<br />
Rework - is defined as activities in the field that have to be done more than once in the field or activities<br />
which remove work previously installed as part of project.<br />
Total Construction Hours – <strong>The</strong> summation of all direct and indirect hours associated with the<br />
construction phase.<br />
Project Delivery System<br />
Design-Bid-Build– Serial sequence of design and construction phases; Owner contracts separately with<br />
designer and constructor.<br />
Design-Build (or EPC) – Overlapped sequence of design and construction phase; procurement normally<br />
begins during design; owner contracts with Design-Build (or EPC) contractor.<br />
CM at Risk– Overlapped sequence of design and construction phases; procurement normally begins<br />
during design; owner contracts separately with designer and CM at Risk (constructor). CM holds the<br />
contracts.<br />
Multiple Design-Build– Overlapped sequence of design and construction phases; procurement normally<br />
begins during design; owner contracts with two Design-Build (or EPC) contractors, one for process and<br />
one for facilities.<br />
Parallel Primes– Overlapped sequence of design and construction phases; Procurement normally<br />
begins during design. Owner contracts separately with designer and multiple prime constructors.<br />
Cost Definition<br />
Construction Costs – include the costs of construction activities from commencement of foundation or<br />
driving piles to mechanical completion. <strong>The</strong> costs include construction project management, construction<br />
labour, and also equipment& supplies costs that are used to support construction operations and<br />
removed after commissioning. See “Instruction for Construction Direct and Indirect Costs” for detail<br />
of typical cost element.<br />
Contingency –Contingency is defined as an estimated amount included in the project budget that may<br />
be required to cover costs that result from project uncertainties. <strong>The</strong>se uncertainties may result from<br />
incomplete design, unforeseen and unpredictable conditions, escalation, or lack of project scope<br />
definition. <strong>The</strong> amount of contingency usually depends on the status of design, procurement and<br />
construction, and the complexity and uncertainties of the component parts of the project.<br />
69
Direct Costs – Direct costs are those which are readily or directly attributable to, or become an<br />
identifiable part of, the final project (e.g., piping labour and material) [AACE].<br />
Direct Cost of Field Rework– <strong>The</strong> sum of those costs associated with actual performance of tasks<br />
involved in rework. Examples include: Labour, Materials, Equipment, Supervisory personnel, Associated<br />
overhead cost.<br />
Modularization– Modularization refers to the use of offsite construction. For the purposes of the<br />
benchmarking data, modularization includes all work that represents substantial offsite construction and<br />
assembly of components and areas of the finished project. Examples that would fall within this<br />
categorization include:<br />
• Skid assemblies of equipment and instrumentation that naturally ship to the site in one piece, and<br />
require minimal on-site reassembly.<br />
• Super-skids of assemblies of components that typically represent substantial portions of the plant,<br />
intended to be installed in a building.<br />
• Prefabricated modules comprising both industrial plant components and architecturally finished<br />
enclosures.<br />
Modularization does not include offsite fabrication of components. Examples of work that would be<br />
excluded from the definition of modularization include:<br />
• Fabrication of the component pieces of a structural framework<br />
• Fabrication of piping spool-pieces<br />
Indirect Costs – Indirect costs are all costs that cannot be attributed readily to a part of the final product<br />
(e.g., cost of managing the project) [AACE].<br />
Schedule Definition<br />
Project Sanction – is defined as the milestone event at which the project scope, budget, and schedule are<br />
authorized. Project Sanction is the start of the execution phase of the project.<br />
Commissioning and Startup – <strong>The</strong> transitional phase between construction and commercial operations;<br />
major steps include turnover, checkout, commissioning, and initial operations. Commissioning is the<br />
integrated testing of equipment and facilities that are grouped together in systems prior to the introduction<br />
of feedstocks.<br />
Detail Engineering – Detail engineering is the project phase initiated with a contract to the firm providing<br />
detail engineering for the project. <strong>The</strong> typical activities included in this phase are: preparation of drawings,<br />
specifications, bill of materials, development of a definitive cost estimate, technical reviews, and<br />
engineering procurement functions. <strong>The</strong> detail engineering phase terminates with release of all approved<br />
drawings and specifications for construction.<br />
Mechanical Completion - <strong>The</strong> point in time when a plant is capable of being operated although some<br />
trim, insulation, and painting may still be needed. This occurs after completion of pre commissioning.<br />
Changes Definition<br />
Change - A change is any event that results in a modification of the project work, schedule or cost.<br />
Owners and designers frequently initiate changes during design development to reflect changes in project<br />
scope or preferences for equipment and materials other than those originally specified. Contractors often<br />
initiate changes when interferences are encountered, when designs are found to be not constructable, or<br />
other design errors are found.<br />
Change Order - A contractual modification executed to document the agreement and approval of a<br />
change (See definition of Change above).<br />
70
Project Development Changes – Project Development Changes include those changes required to<br />
execute the original scope of work or obtain original process basis. Examples include:<br />
1) Unforeseen site conditions that require a change in design / construction methods<br />
2) Changes required due to errors and omissions<br />
3) Acceleration<br />
4) Change in owner preferences<br />
5) Additional equipment or processes required to obtain original planned throughput<br />
6) Operability or maintainability changes. (See Change above)<br />
Scope Changes – Scope Changes include changes in the base scope of work or process basis.<br />
Examples include: 1) Feedstock change, 2) Changed site location, 3) Changed throughput, 4) Addition of<br />
unrelated scope<br />
Practice Definition<br />
Front End Planning– is the essential process of developing sufficient strategic information with which<br />
owners can address risk and make decisions to commit resources in order to maximize the potential for a<br />
successful project. Front End Planning is also known as pre-project planning, front end loading, feasibility<br />
analysis, conceptual planning/ schematic design, and early project planning.<br />
Project Risk Assessment –Project risk assessment is the process to identify, assess and manage risk.<br />
<strong>The</strong> project team evaluates risk exposure for potential project impact to provide focus for mitigation<br />
strategies.<br />
Team Building– is a project- focused process that builds and develops shared goals, interdependence,<br />
trust and commitment, and accountability among team members and that seeks to improve team<br />
members’ problem- solving skills.<br />
Alignment during Front End Planning– is the condition where appropriate project participants are<br />
working with acceptable tolerances to develop and meet a uniform defined and understood set of project<br />
objectives.<br />
Constructability– is the effective and timely integration of construction knowledge into the conceptual<br />
planning, design, construction, and filed operations of a project to achieve the overall project objectives in<br />
the best possible time and accuracy at the most cost- effective levels.<br />
Design for Maintainability– Design for maintainability is the optimum use of facility maintenance<br />
knowledge and experience in the design/engineering of a facility to pertain the ease, accuracy, safety and<br />
economy in the performance of maintenance action; a design parameter related to the ability to maintain.<br />
Material Management – the planning, controlling, and integrating of the materials takeoff, purchasing,<br />
economic, expediting, transportation, warehousing, and issue functions in order to achieve a smooth,<br />
timely, efficient flow of materials to the project in the required quantity, the required time, and at an<br />
acceptable price and quality, and the planning and controlling of these functions (CII Publication SP-4)<br />
Project Change Management– is the process of incorporating a balanced change culture of recognition,<br />
planning, and evaluation of project changes in an organization to effectively manage project changes.<br />
Practices related to the management and control of both scope changes and project changes.<br />
Zero Accident Techniques– include the site- specific safety programs and implementation, auditing,<br />
and incentive efforts to create a project environment and a level of that embraces the mind set that all<br />
accidents are preventable and that zero accidents is an obtainable goal.<br />
71
Quality Management– Quality management incorporates all activities conducted to improve the<br />
efficiency, contract compliance and cost effectiveness of design, engineering, procurement, QA/QC,<br />
construction and startup elements of construction projects.<br />
Automation/Integration (AI) Technology– <strong>The</strong> Automation and Integration Technology practice<br />
addresses the degree of automation/level of use and integration of automated systems for predefined<br />
tasks/work functions common to most projects.<br />
Planning for Startup– is the effectiveness of planning on startup activities that facilitate the<br />
implementation of the transitional phase between plant construction completion and commercial<br />
operations, including all of the activities bridging these two phases. Critical steps within the startup phase<br />
include systems turnover, checkout of systems, commissioning of systems, introduction of feed stocks,<br />
and performance testing.<br />
Prefabrication/ Preassembly/ Modularization– Prefabrication/Preassembly/Modularization (PPMOF) is<br />
defined as several manufacturing and installation techniques, which move many fabrication and<br />
installation activities from the plant site into a safer and more efficient environment. For each technique,<br />
more specific definitions are provided below.<br />
• Prefabrication: a manufacturing process, generally taking place at a specialized facility, in which<br />
various materials are joined to form a component part of a final installation. Prefabricated components<br />
often involve the work of a single craft.<br />
• Preassembly: a process by which various materials, prefabricated components, and/or equipment are<br />
joined together at a remote location for subsequent installation as a sub-unit: generally focused on a<br />
system.<br />
• Module: a major section of a plant resulting from a series of remote assembly operations and may<br />
include portions of many systems: usually the largest transportable unit or component of a facility.<br />
• Offsite Fabrication: the practice of preassembly or fabrication of components both off the site and<br />
onsite at a location other than at the final installation location.<br />
This practice consists of two part, constructability at AFE phase and constructability at mechanical<br />
completion. Please fill out one part of this practice according to your current project phase.<br />
Workface Planning– <strong>The</strong> process of organizing and delivering all elements necessary, before work is<br />
started, to enable craft persons to perform quality work in a safe, effective and efficient manner<br />
Engineering Productivity<br />
Engineering Direct Work hours - should include all detailed design hours used to produce deliverables<br />
including site investigations, meetings, planning, constructability, RFIs, etc., and rework. Specifically<br />
exclude work hours for operating manuals and demolition drawings.<br />
- Engineering work hours reported should only be for the categories requested and may not equal<br />
the total engineering work hours for the project. (See “Instructions for Computation of Work<br />
hours and Rework-Hours” reference table)<br />
- Exclude the following categories: architectural design, plumbing, process design, civil/site prep,<br />
HVAC, insulation and paint, sprinkler/deluge systems, etc. Within a category, direct work hours that<br />
cannot be specifically assigned into the provided classifications, and have not been excluded,<br />
should be prorated based on known work hours or quantities as appropriate.<br />
IFC Drawing– Issued for Construction drawings.<br />
Construction Productivity<br />
Actual Quantities and Work hours - are all quantities and work hours of actual installation and include<br />
rework hours for these quantities and work-hours.<br />
72
Estimated Productivity – are the estimated productivity of direct labour work hours required for<br />
installation according to the estimated quantity.<br />
For owners:<br />
For contractors:<br />
Estimated Quantity, Work hours and Total Installed Unit Cost at the time of<br />
Project Sanction (or as soon as available following sanction)<br />
Estimated Quantity, Work hours and Total Installed Unit Cost used as the basis<br />
of Contract Award.<br />
Estimated Quantities and Work hours – are the estimated quantity to be installed, the estimated work<br />
hours required for the installation and include all change orders.<br />
Estimated Total Installed Unit Cost – including labour and material cost at the time of project sanction<br />
(or as soon as available following sanction).<br />
Estimated Total Installed Unit Costs (TIUC) – is the burdened direct cost of labour, material and<br />
equipment by pro rata share which are directly attribute to, or become a part of the final product including<br />
overhead and profit at the time of project sanction (or as soon as available following sanction).<br />
Actual Total Installed Unit Costs (TIUC) – the burdened direct cost of labour, material and equipment<br />
by pro rata share which are directly attribute to, or become a part of the final product including overhead<br />
and profit from both direct hire and subcontract.<br />
• <strong>The</strong> direct labour costs are considered as the costs of the labours listed as Direct in the<br />
“Instructions for Computation of Actual Work-Hours, Rework-Hours, and Installed Costs” table in<br />
Construction Productivity Section.<br />
73
References<br />
AACE (2004). “Estimating Lost Labour Productivity in Construction Claims.” TCM Framework: 6.4-<br />
Forensic Performance Assessment, AACE International Recommended Practice No. 25R-03.<br />
Agresti, A. and Finlay, B. (1999). Statistical methods for the social sciences, 3rd ed., Prentice Hall, Inc.,<br />
Upper Saddle River, NJ, 07458, Prentice Hall, Inc., Upper Saddle River, NJ, 07458.<br />
<strong>Alberta</strong> Finance and Enterprise (AFE) (2008). “Highlights of the Highlights of the <strong>Alberta</strong> Economy”,<br />
http://www.albertacanada.com/statpub.<br />
Aminah R. (2005). “Results of a Survey of Performance Deviations on <strong>Major</strong> Industrial Construction <strong>Projects</strong> in<br />
<strong>Alberta</strong> (1990-2003).” <strong>Report</strong> to Construction Owner Association of <strong>Alberta</strong>, Spring, 2005.<br />
<strong>COAA</strong> (2008). “Construction Owners Association of <strong>Alberta</strong>”, http://www.coaa.ab.ca.<br />
Field, A. (2005). “Discovering Statistics Using SPSS.” Second Edition, SAGE Publications.<br />
Flyvbjerg, B., Bruzelius, N., & Rothengatter, W. (2003). “Megaprojects and risk: An anatomy of ambition.”<br />
Cambridge, UK: Cambridge University Press.<br />
Kellogg, J., Taylor, D., and Howell, G. (1981). “Hierarchy Model of Construction Productivity.”<br />
Journal of the Construction Division, 107(1), March 1981, pp. 137-152.<br />
ASCE,<br />
OSDG (2008). “Oil Sands – Important to Canada’s Present and Future”. Oil Sands Developers Group.<br />
E-mail: info@oilsandsdevlopers.ca.<br />
74
Companies Participating in <strong>COAA</strong> <strong>Benchmarking</strong> Training Sessions:<br />
• Air Products & Chemicals Inc.<br />
• <strong>Alberta</strong> Economic Development<br />
• <strong>Alberta</strong> Infrastructure and Transportation<br />
• Ascension Systems Inc.<br />
• BA Energy<br />
• Bantrel<br />
• BIRD Construction Company<br />
• Canadian Natural Resources<br />
• Canonbie Contracting Ltd.<br />
• Cobra Group of Companies<br />
• Colt Corporation<br />
• ConocoPhillips<br />
• CPI Construction<br />
• DriverCheck<br />
• Enbridge Pipelines Inc.<br />
• EPCOR<br />
• Esso Petroleum Canada<br />
• Flint Energy<br />
• Fluor Corporation<br />
• Husky Energy Inc.<br />
• IBEW Local 424<br />
• Imperial Oil Resources Ltd.<br />
• Intergraph Corporation<br />
• Jacobs<br />
• Kellogg Brown & Root<br />
• Laird Electric Inc.<br />
• Ledcor<br />
• Murdoch International Inc.<br />
• Nexen Inc.<br />
• OPTI Canada Inc.,<br />
• PCL<br />
• Petro-Canada<br />
• Revay and Associates Limited<br />
• RSC Equipment Rental<br />
• SafeTech Consulting Group Ltd.<br />
• Shell Canada Limited<br />
• Stantec<br />
• Steeplejack Industrial Group Inc.<br />
• Suncor Energy Inc.<br />
• Syncrude Canada Ltd.<br />
• Tartan Canada Corporation<br />
• ThyssenKrupp Safway, Inc.<br />
• TransCanada Pipelines, Ltd.<br />
• Westwood Companies<br />
• WorleyParsons Limited<br />
CII Staff:<br />
Stephen Mulva, Ph.D., Associate Director <strong>Benchmarking</strong> and Metrics<br />
Stephen R. Thomas, Ph.D., Associate Director, Research, Academic, and Breakthrough<br />
Jiukun Dai, Ph.D., Research Engineer<br />
Arpamart Chanmeka, Graduate Research Assistant<br />
Deborah DeGezelle, Senior Systems Analyst<br />
Hong Zhao, Senior Systems Analyst<br />
75
<strong>The</strong> Construction Industry Institute<br />
<strong>The</strong> University of Texas at Austin<br />
3925 West Braker Lane<br />
Austin, TX 78759-5316<br />
(512) 232-3000<br />
FAX (512) 499-8101<br />
Construction Industry Institute<br />
http://construction-institute.org<br />
Bureau of Engineering Research<br />
<strong>The</strong> University of Texas at Austin