July - AMMJ
July - AMMJ July - AMMJ
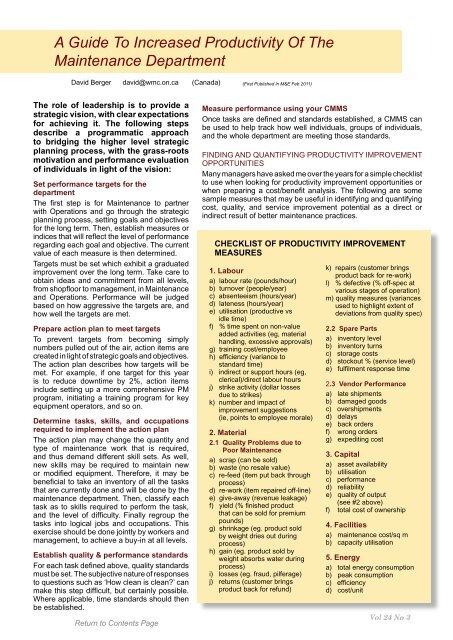
A Guide To Increased Productivity Of The Maintenance Department David Berger david@wmc.on.ca (Canada) (First Published in M&E Feb 2011) The role of leadership is to provide a strategic vision, with clear expectations for achieving it. The following steps describe a programmatic approach to bridging the higher level strategic planning process, with the grass-roots motivation and performance evaluation of individuals in light of the vision: Set performance targets for the department The first step is for Maintenance to partner with Operations and go through the strategic planning process, setting goals and objectives for the long term. Then, establish measures or indices that will reflect the level of performance regarding each goal and objective. The current value of each measure is then determined. Targets must be set which exhibit a graduated improvement over the long term. Take care to obtain ideas and commitment from all levels, from shopfloor to management, in Maintenance and Operations. Performance will be judged based on how aggressive the targets are, and how well the targets are met. Prepare action plan to meet targets To prevent targets from becoming simply numbers pulled out of the air, action items are created in light of strategic goals and objectives. The action plan describes how targets will be met. For example, if one target for this year is to reduce downtime by 2%, action items include setting up a more comprehensive PM program, initiating a training program for key equipment operators, and so on. Determine tasks, skills, and occupations required to implement the action plan The action plan may change the quantity and type of maintenance work that is required, and thus demand different skill sets. As well, new skills may be required to maintain new or modified equipment. Therefore, it may be beneficial to take an inventory of all the tasks that are currently done and will be done by the maintenance department. Then, classify each task as to skills required to perform the task, and the level of difficulty. Finally regroup the tasks into logical jobs and occupations. This exercise should be done jointly by workers and management, to achieve a buy-in at all levels. Establish quality & performance standards For each task defined above, quality standards must be set. The subjective nature of responses to questions such as ‘How clean is clean?’ can make this step difficult, but certainly possible. Where applicable, time standards should then be established. Measure performance using your CMMS Once tasks are defined and standards established, a CMMS can be used to help track how well individuals, groups of individuals, and the whole department are meeting those standards. FINDING AND QUANTIFYING PRODUCTIVITY IMPROVEMENT OPPORTUNITIES Many managers have asked me over the years for a simple checklist to use when looking for productivity improvement opportunities or when preparing a cost/benefit analysis. The following are some sample measures that may be useful in identifying and quantifying cost, quality, and service improvement potential as a direct or indirect result of better maintenance practices. CHECKLIST OF PRODUCTIVITY IMPROVEMENT MEASURES 1. Labour a) labour rate (pounds/hour) b) turnover (people/year) c) absenteeism (hours/year) d) lateness (hours/year) e) utilisation (productive vs idle time) f) % time spent on non-value added activities (eg, material handling, excessive approvals) g) training cost/employee h) efficiency (variance to standard time) i) indirect or support hours (eg, clerical)/direct labour hours j) strike activity (dollar losses due to strikes) k) number and impact of improvement suggestions (ie, points to employee morale) 2. Material 2.1 Quality Problems due to Poor Maintenance a) scrap (can be sold) b) waste (no resale value) c) re-feed (item put back through process) d) re-work (item repaired off-line) e) give-away (revenue leakage) f) yield (% finished product that can be sold for premium pounds) g) shrinkage (eg. product sold by weight dries out during process) h) gain (eg. product sold by weight absorbs water during process) i) losses (eg. fraud, pilferage) j) returns (customer brings product back for refund) k) repairs (customer brings product back for re-work) l) % defective (% off-spec at various stages of operation) m) quality measures (variances used to highlight extent of deviations from quality spec) 2.2 Spare Parts a) inventory level b) inventory turns c) storage costs d) stockout % (service level) e) fulfilment response time 2.3 Vendor Performance a) late shipments b) damaged goods c) overshipments d) delays e) back orders f) wrong orders g) expediting cost 3. Capital a) asset availability b) utilisation c) performance d) reliability e) quality of output (see #2 above) f) total cost of ownership 4. Facilities a) maintenance cost/sq m b) capacity utilisation 5. Energy a) total energy consumption b) peak consumption c) efficiency d) cost/unit Vol 24 No 3
info@infratherm.com.au Introducing the new, high performance NEC-Avio R300 Thermography Camera The NEC-Avio R300 is perfect for use in building inspections and power equipment diagnostics. It's also ideal for research and development professionals who require a thermal imaging camera that is highly sensitive and precision perfect. • High resolution (NETD) of 0.05ºC at 30ºC. • High performance with accuracy to +/- 1ºC. • Spatial resolution (IFOV) 1.21 mrad (STD lens). • Simultaneously thermal/visible/fusion video onto computer via calibrated USB. • LCD screen and viewfinder. • Panoramic image capture on camera. • Remote control comes as a standard feature. • External alarm output. • Radiometric JPEG. • 2 year warranty. NEC-AVIO offer outstanding quality and excellent performance at a value price. For more details speak to the region's leading thermal imaging suppliers, Infratherm, on 61 (0)2 4579 7334, 61 (0)2 4322 2100 or email info@infratherm.com.au
- Page 3 and 4: LogbooksOnline Web-based logbooks a
- Page 5: AMMJ Contents July 2011 Issue Vol 2
- Page 9 and 10: Reliability Week has been run since
- Page 11 and 12: AMMJ SCADA With Wireless Instrument
- Page 13 and 14: AMMJ Lubrication Reliability 13 Ala
- Page 15 and 16: Adver.indd 2 6/10/2011 4:57:13 PM A
- Page 17 and 18: Maintenance 2011 Seminars Download
- Page 19 and 20: AMMJ Maintenance Planning Is Too Ha
- Page 21 and 22: AMMJ Maintenance Planning Is Too Ha
- Page 23 and 24: Vol 24 No 3 AMMJ 23 2011 CM Equipme
- Page 25 and 26: Take a vibration expert along NEW F
- Page 27 and 28: Vol 24 No 3 AMMJ 27 2011 CM Equipme
- Page 29 and 30: Vol 24 No 3 AMMJ 29 2011 CM Equipme
- Page 31 and 32: AMMJ Maintenance Decision Support P
- Page 33 and 34: AMMJ Maintenance Decision Support P
- Page 35 and 36: AMMJ Maintenance Decision Support P
- Page 37 and 38: Simple Solutions to Big Problems St
- Page 39 and 40: AMMJ Effective Thickness of Corrode
- Page 41 and 42: Frequency, (%) Effective Thickness
- Page 43 and 44: Effective Thickness of Corroded Ste
- Page 45 and 46: AMMJ 45 [8] M. Matsumoto, Y. Shirai
- Page 47 and 48: AMMJ TPM - 20 Years On In The UK 47
- Page 49 and 50: • Features a valuable practical
- Page 51 and 52: 51 MAINTENANCE STRATEGY SERIES Terr
- Page 53 and 54: MAINTENANCE BOOKS - ORDER FORM Pric
- Page 55 and 56: Maintenance News 55 1-Million Pound
A Guide To Increased Productivity Of The<br />
Maintenance Department<br />
David Berger david@wmc.on.ca (Canada)<br />
(First Published in M&E Feb 2011)<br />
The role of leadership is to provide a<br />
strategic vision, with clear expectations<br />
for achieving it. The following steps<br />
describe a programmatic approach<br />
to bridging the higher level strategic<br />
planning process, with the grass-roots<br />
motivation and performance evaluation<br />
of individuals in light of the vision:<br />
Set performance targets for the<br />
department<br />
The first step is for Maintenance to partner<br />
with Operations and go through the strategic<br />
planning process, setting goals and objectives<br />
for the long term. Then, establish measures or<br />
indices that will reflect the level of performance<br />
regarding each goal and objective. The current<br />
value of each measure is then determined.<br />
Targets must be set which exhibit a graduated<br />
improvement over the long term. Take care to<br />
obtain ideas and commitment from all levels,<br />
from shopfloor to management, in Maintenance<br />
and Operations. Performance will be judged<br />
based on how aggressive the targets are, and<br />
how well the targets are met.<br />
Prepare action plan to meet targets<br />
To prevent targets from becoming simply<br />
numbers pulled out of the air, action items are<br />
created in light of strategic goals and objectives.<br />
The action plan describes how targets will be<br />
met. For example, if one target for this year<br />
is to reduce downtime by 2%, action items<br />
include setting up a more comprehensive PM<br />
program, initiating a training program for key<br />
equipment operators, and so on.<br />
Determine tasks, skills, and occupations<br />
required to implement the action plan<br />
The action plan may change the quantity and<br />
type of maintenance work that is required,<br />
and thus demand different skill sets. As well,<br />
new skills may be required to maintain new<br />
or modified equipment. Therefore, it may be<br />
beneficial to take an inventory of all the tasks<br />
that are currently done and will be done by the<br />
maintenance department. Then, classify each<br />
task as to skills required to perform the task,<br />
and the level of difficulty. Finally regroup the<br />
tasks into logical jobs and occupations. This<br />
exercise should be done jointly by workers and<br />
management, to achieve a buy-in at all levels.<br />
Establish quality & performance standards<br />
For each task defined above, quality standards<br />
must be set. The subjective nature of responses<br />
to questions such as ‘How clean is clean?’ can<br />
make this step difficult, but certainly possible.<br />
Where applicable, time standards should then<br />
be established.<br />
Measure performance using your CMMS<br />
Once tasks are defined and standards established, a CMMS can<br />
be used to help track how well individuals, groups of individuals,<br />
and the whole department are meeting those standards.<br />
FINDING AND QUANTIFYING PRODUCTIVITY IMPROVEMENT<br />
OPPORTUNITIES<br />
Many managers have asked me over the years for a simple checklist<br />
to use when looking for productivity improvement opportunities or<br />
when preparing a cost/benefit analysis. The following are some<br />
sample measures that may be useful in identifying and quantifying<br />
cost, quality, and service improvement potential as a direct or<br />
indirect result of better maintenance practices.<br />
CHECKLIST OF PRODUCTIVITY IMPROVEMENT<br />
MEASURES<br />
1. Labour<br />
a) labour rate (pounds/hour)<br />
b) turnover (people/year)<br />
c) absenteeism (hours/year)<br />
d) lateness (hours/year)<br />
e) utilisation (productive vs<br />
idle time)<br />
f) % time spent on non-value<br />
added activities (eg, material<br />
handling, excessive approvals)<br />
g) training cost/employee<br />
h) efficiency (variance to<br />
standard time)<br />
i) indirect or support hours (eg,<br />
clerical)/direct labour hours<br />
j) strike activity (dollar losses<br />
due to strikes)<br />
k) number and impact of<br />
improvement suggestions<br />
(ie, points to employee morale)<br />
2. Material<br />
2.1 Quality Problems due to<br />
Poor Maintenance<br />
a) scrap (can be sold)<br />
b) waste (no resale value)<br />
c) re-feed (item put back through<br />
process)<br />
d) re-work (item repaired off-line)<br />
e) give-away (revenue leakage)<br />
f) yield (% finished product<br />
that can be sold for premium<br />
pounds)<br />
g) shrinkage (eg. product sold<br />
by weight dries out during<br />
process)<br />
h) gain (eg. product sold by<br />
weight absorbs water during<br />
process)<br />
i) losses (eg. fraud, pilferage)<br />
j) returns (customer brings<br />
product back for refund)<br />
k) repairs (customer brings<br />
product back for re-work)<br />
l) % defective (% off-spec at<br />
various stages of operation)<br />
m) quality measures (variances<br />
used to highlight extent of<br />
deviations from quality spec)<br />
2.2 Spare Parts<br />
a) inventory level<br />
b) inventory turns<br />
c) storage costs<br />
d) stockout % (service level)<br />
e) fulfilment response time<br />
2.3 Vendor Performance<br />
a) late shipments<br />
b) damaged goods<br />
c) overshipments<br />
d) delays<br />
e) back orders<br />
f) wrong orders<br />
g) expediting cost<br />
3. Capital<br />
a) asset availability<br />
b) utilisation<br />
c) performance<br />
d) reliability<br />
e) quality of output<br />
(see #2 above)<br />
f) total cost of ownership<br />
4. Facilities<br />
a) maintenance cost/sq m<br />
b) capacity utilisation<br />
5. Energy<br />
a) total energy consumption<br />
b) peak consumption<br />
c) efficiency<br />
d) cost/unit<br />
Vol 24 No 3


