ANALELE UNIVERSITÄÅII DIN ORADEA - Departamentul de ...
ANALELE UNIVERSITÄÅII DIN ORADEA - Departamentul de ...
ANALELE UNIVERSITÄÅII DIN ORADEA - Departamentul de ...

You also want an ePaper? Increase the reach of your titles
YUMPU automatically turns print PDFs into web optimized ePapers that Google loves.
UNIVERSITATEA <strong>DIN</strong> <strong>ORADEA</strong><br />
DEPARTAMENTUL DE GEOGRAFIE, TURISM<br />
ŞI AMENAJAREA TERITORIULUI<br />
<strong>ANALELE</strong> UNIVERSITĂłII<br />
<strong>DIN</strong> <strong>ORADEA</strong><br />
Seria GEOGRAFIE<br />
TOM XXI<br />
Nr. 2/2011 (December)<br />
Editura UniversităŃii din Ora<strong>de</strong>a
UNIVERSITATEA <strong>DIN</strong> <strong>ORADEA</strong><br />
DEPARTAMENTUL DE GEOGRAFIE, TURISM ŞI AMENAJAREA TERITORIULUI<br />
<strong>ANALELE</strong> UNIVERSITĂłII<br />
<strong>DIN</strong> <strong>ORADEA</strong><br />
Seria GEOGRAFIE<br />
TOM XXI<br />
Nr. 2/2011 (December)<br />
Editura UniversităŃii din Ora<strong>de</strong>a
<strong>ANALELE</strong> UNIVERSITĂłII <strong>DIN</strong> <strong>ORADEA</strong>, SERIA GEOGRAFIE<br />
ANNALS OF UNIVERSITY OF <strong>ORADEA</strong>, GEOGRAPHY SERIE<br />
Review accredited by CNCSIS, Co<strong>de</strong> 669 “B+” Category (since 2008)<br />
Review in<strong>de</strong>xed in In<strong>de</strong>x Copernicus, DOAJ – Directory of Open Acces Journals, ULRICHSWEB – Global Serials Directory, SCIPIO –<br />
Platforma Editorială Română and EBSCO – EBSCOhost Online Research Databases<br />
The review is issued un<strong>de</strong>r the aegis of The University of Ora<strong>de</strong>a,<br />
Department of Geography, Tourism and Territorial Planning and The Territorial Studies and Analyses Centre<br />
Editor-in-Chief: Alexandru ILIEŞ, Gheorghe MĂHĂRA<br />
Associate Editors: Nicolae JOSAN, Rodica PETREA<br />
Assistant Editors: Grigore Vasile HERMAN, Ribana LINC<br />
Scientific Board:<br />
Liviu APOSTOL, “Al.I. Cuza” University of Iaşi (Romania)<br />
Dan BĂLTEANU, member of Romanian Aca<strong>de</strong>my, Institut of Geography of Bucharest (Romania)<br />
Milan BUFON, “Primorska” University of Koper (Slovenia)<br />
Huhua CAO, University of Ottawa (Canada)<br />
Jean-Paul CARRIERE, University of Tours (France)<br />
Doriano CASTAL<strong>DIN</strong>I, University of Mo<strong>de</strong>na and Reggio Emilia (Italy)<br />
Nicolae CIANGĂ, “Babeş-Bolyai” University of Cluj-Napoca (Romania)<br />
Adrian CIOACĂ, “Spiru Haret” University of Bucharest (Romania)<br />
Pompei COCEAN, “Babeş-Bolyai” University of Cluj-Napoca (Romania)<br />
Sterie CIULACHE, University of Bucharest (Romania)<br />
Olivier DEHOORNE, University of Antilles and Guyanne (France)<br />
Carmen DRAGOTĂ, Institut of Geography of Bucharest<br />
Allessandro GALLO, "Ca' Foscari" University of Venice (Italy)<br />
Floare GRECU, University of Bucharest<br />
Lisa Butler HARRINGTON, Kansas State University<br />
Ioan IANOŞ, University of Bucharest (Romania)<br />
Corneliu IAłU, “Al. I. Cuza” University of Iaşi (Romania)<br />
Dorina Camelia ILIEŞ, University of Ora<strong>de</strong>a (Romania)<br />
Ioan Aurel IRIMUŞ, “Babeş-Bolyai” University of Cluj-Napoca (Romania)<br />
Saşa KICOSEV, University of Novi Sad, Serbia<br />
Vladimir KOLOSSOV, Russian Aca<strong>de</strong>my of Science of Moscow (Russia)<br />
Gabor KOZMA, University of Debrecen (Hungary)<br />
Ionel MUNTELE, “Al.I. Cuza” University of Iaşi (Romania)<br />
Martin OLARU, West University of Timişoara (Romania)<br />
Ta<strong>de</strong>usz PALMOWSKI, University of Gdansk (Poland)<br />
Elisa PASTORIZA, Universidad Nacional <strong>de</strong> Mar<strong>de</strong>l Plata (Argentina)<br />
DănuŃ PETREA, “Babeş-Bolyai” University of Cluj-Napoca (Romania)<br />
Nicolae POPA, West University of Timişoara<br />
Maria RĂDOANE, “Ştefan cel Mare” University of Suceava (Romania)<br />
Maria Luisa RODRIGUEZ, University of Lisboa (Portugal)<br />
Stephane ROSIERE, University of Reims Champagne-Ar<strong>de</strong>nne, France<br />
Valeriu SAINSUS, Aca<strong>de</strong>my of Economic Science of Chişinău (Rep. of Moldova)<br />
Marcu STAŞAC, University of Ora<strong>de</strong>a (Romania)<br />
Istvan SULI-ZAKAR, University of Debrecen (Hungary)<br />
Karoly TEPERICS, University of Debrecen (Hungary)<br />
Dallen J. TIMOTHY, Arizona State University, United States of America<br />
Laurent TOUCHART, Université d’Orléans (France)<br />
Alexandru UNGUREANU, “Al. I. Cuza” University of Iasi<br />
Petru URDEA, West University of Timişoara (Romania)<br />
Luca ZARRILLI, University of Pescara-Chieti (Italy)<br />
Christoph WAACK, Regional Geography of Institut of Leipzig (Germany)<br />
Jan WENDT, University of Gdansk (Poland)<br />
Foreign Language Supervisor: Corina TĂTAR, Cezar MORAR<br />
Secretary On-line Version: Ştefan BAIAS<br />
The responsibility for the content of the articles belongs to the author(s).<br />
The articles are published with the notification of the scientific reviewer.<br />
The exchange manuscripts, books and reviews as well as any correspon<strong>de</strong>nce will be sent on the address of the Editorial Office.<br />
Editorial Office Address:<br />
University of Ora<strong>de</strong>a, Department of Geography, Tourism and Territorial Planning<br />
1 UniversităŃii Street, 410087 Ora<strong>de</strong>a, Romania<br />
Tel/ Fax +40.259.408.475, http://istgeorelint.uora<strong>de</strong>a.ro/Reviste/Anale/anale.htm, e-mail: auog.uora<strong>de</strong>a@yahoo.com<br />
ISSN 1221-1273, E-ISSN 2065-3409
C O N T E N T S<br />
SKI ACTIVITY IN WESTERN PART OF SOUTHERN CARPATHIANS. CASE STUDY: STRAJA SKI<br />
AREA<br />
Mircea VOICULESCU, Florentina POPESCU, Alexandru ONACA, Marcel TÖRÖK-OANCE<br />
(Art#212101-553) . . . . . . . . . . . . . . . . . . . . . . . . . . . . . . . . . . . . . . . . . . . . . . . . . . . . . . . . . . . . . . . . . . . . . . . . . . . . . . . . . . . . 159<br />
CONTRIBUTIONS TO INVENTORY AND ASSESSEMENT OF THE GEOMORPHOSITES IN<br />
CĂLIMANI NATIONAL PARK. CASE STUDY: 12 APOSTLES GEOLOGIC RESERVE<br />
Ioan BÂCA<br />
(Art#212102-547) . . . . . . . . . . . . . . . . . . . . . . . . . . . . . . . . . . . . . . . . . . . . . . . . . . . . . . . . . . . . . . . . . . . . . . . . . . . . . . . . . . . . 172<br />
PERSPECTIVES IN THE ANALYSIS OF THE TERRACES OF THE DANUBE WITHIN THE OLTENIA<br />
PLAIN (ROMANIA)<br />
Sandu BOENGIU, Sorin AVRAM, Alina VLĂDUł<br />
(Art#212103-528) . . . . . . . . . . . . . . . . . . . . . . . . . . . . . . . . . . . . . . . . . . . . . . . . . . . . . . . . . . . . . . . . . . . . . . . . . . . . . . . . . . . . 181<br />
THE FOEHN WINDS IN NORTHERN OLTENIA. 18.08.2008 CASE STUDY<br />
Anişoara IRIMESCU<br />
(Art#212104-538) . . . . . . . . . . . . . . . . . . . . . . . . . . . . . . . . . . . . . . . . . . . . . . . . . . . . . . . . . . . . . . . . . . . . . . . . . . . . . . . . . . . . 192<br />
ASPECTS REGAR<strong>DIN</strong>G THE RIME PHENOMEN IN DEVA AREA<br />
Cristina Diana BRĂDĂU<br />
(Art#212105-543) . . . . . . . . . . . . . . . . . . . . . . . . . . . . . . . . . . . . . . . . . . . . . . . . . . . . . . . . . . . . . . . . . . . . . . . . . . . . . . . . . . . . 203<br />
COMMUNITY’S ADAPTIVE CAPACITY DUE TO COASTAL FLOO<strong>DIN</strong>G IN SEMARANG COASTAL<br />
CITY, INDONESIA<br />
Muh Aris MARFAI, Dyah R. HIZBARON<br />
(Art#212106-536) . . . . . . . . . . . . . . . . . . . . . . . . . . . . . . . . . . . . . . . . . . . . . . . . . . . . . . . . . . . . . . . . . . . . . . . . . . . . . . . . . . . . 209<br />
DOWNSTREAM VARIATION IN PARTICLE SIZE: A CASE STUDY OF THE TROTUŞ RIVER,<br />
EASTERN CARPATHIANS (ROMANIA)<br />
Dan DUMITRIU, Daniel CONDORACHI, Mihai NICULIłĂ<br />
(Art#212107-527) . . . . . . . . . . . . . . . . . . . . . . . . . . . . . . . . . . . . . . . . . . . . . . . . . . . . . . . . . . . . . . . . . . . . . . . . . . . . . . . . . . . . 222<br />
SEASONAL STUDY WITH INTERPRETATION OF THE CHEMICAL CHARACTERISTICS OF WATER<br />
POND IN REFERENCE TO QUALITY ASSESSMENT: A CASE STUDY<br />
Hemant PATHAK, Deepak PATHAK, Sudhir Nagesh LIMAYE<br />
(Art#212108-548) . . . . . . . . . . . . . . . . . . . . . . . . . . . . . . . . . . . . . . . . . . . . . . . . . . . . . . . . . . . . . . . . . . . . . . . . . . . . . . . . . . . . 233<br />
DRINKING WATER SUPPLY AND CONSUMPTION TERRITORIAL DISPARITIES IN THE TIMIŞ<br />
PLAIN<br />
Bianca MITRICĂ, Irena MOCANU<br />
(Art#212109-542) . . . . . . . . . . . . . . . . . . . . . . . . . . . . . . . . . . . . . . . . . . . . . . . . . . . . . . . . . . . . . . . . . . . . . . . . . . . . . . . . . . . . 239<br />
CONTRIBUTIONS TO THE KNOWLEDGE OF THE ASSOCIATION OF FESTUCO DRYMEJAE-<br />
FAGETUM FROM LĂZĂRENI HILLS (NORTH-WESTERN ROMANIA)<br />
Laura Mariana LACATOŞ (HERMAN), Grigore Vasile HERMAN<br />
(Art#212110-532) . . . . . . . . . . . . . . . . . . . . . . . . . . . . . . . . . . . . . . . . . . . . . . . . . . . . . . . . . . . . . . . . . . . . . . . . . . . . . . . . . . . . 248<br />
GENESIS AND DYNAMICS OF A GEO-DEMOGRAPHIC SINGULARITY. A CASE STUDY - THE<br />
GIPSY COMMUNITY OF TOFLEA (BRĂHĂŞEŞTI COMMUNE, GALAłI COUNTY)<br />
Ionel MUNTELE, Raluca HOREA-ŞERBAN<br />
(Art#212111-533) . . . . . . . . . . . . . . . . . . . . . . . . . . . . . . . . . . . . . . . . . . . . . . . . . . . . . . . . . . . . . . . . . . . . . . . . . . . . . . . . . . . . 256
THE VILLAGES FROM SALAJ IN THE EASTERN PART OF JIBOU LOCALITY – DEMOGRAPHIC<br />
POTENTIAL -<br />
Oana - Andreia PUIA<br />
(Art#212112-534) . . . . . . . . . . . . . . . . . . . . . . . . . . . . . . . . . . . . . . . . . . . . . . . . . . . . . . . . . . . . . . . . . . . . . . . . . . . . . . . . . . . . 267<br />
COMMUNITIES BETWEEN PRESERVATION AND DISAPPEARANCE: THE DEMOGRAPHIC<br />
HAZARD IN BEIUS LAND<br />
Claudiu FILIMON, LuminiŃa FILIMON<br />
(Art#212113-551) . . . . . . . . . . . . . . . . . . . . . . . . . . . . . . . . . . . . . . . . . . . . . . . . . . . . . . . . . . . . . . . . . . . . . . . . . . . . . . . . . . . . 276<br />
DEMOGRAPHIC AND ECONOMIC VULNERABILITIES WITHIN THE SUBURBAN AREA OF TÂRGU<br />
JIU<br />
Daniela ZAMFIR, Cristian BRAGHINĂ, Cristian TĂLÂNGĂ<br />
(Art#212114-556) . . . . . . . . . . . . . . . . . . . . . . . . . . . . . . . . . . . . . . . . . . . . . . . . . . . . . . . . . . . . . . . . . . . . . . . . . . . . . . . . . . . . 286<br />
THE EFFECTS OF POPULATION AGING ON RURAL AREAS. CASE STUDY: THE SARATEL<br />
HYDROGRAPHIC BASIN (BUZAU SUBCARPATHIANS)<br />
Ilinca-Valentina STOICA<br />
(Art#212115-531) . . . . . . . . . . . . . . . . . . . . . . . . . . . . . . . . . . . . . . . . . . . . . . . . . . . . . . . . . . . . . . . . . . . . . . . . . . . . . . . . . . . . 294<br />
CHARACTERISTICS OF DEMOGRAPHICAL DYNAMICS IN AREAS OF URBAN INFLUENCE. CASE<br />
STUDY: INFLUENCE AREA OF RÂMNICU VÂLCEA CITY<br />
Constantin Cristian DRĂGHICI, Daniel PEPTENATU, Daniel Radu PINTILII, Cristina MERCIU, Loreta<br />
Andreea CERCLEUX<br />
(Art#212116-541) . . . . . . . . . . . . . . . . . . . . . . . . . . . . . . . . . . . . . . . . . . . . . . . . . . . . . . . . . . . . . . . . . . . . . . . . . . . . . . . . . . . . 303<br />
WAYS OF MANAGING THE URBAN - RURAL INTERFACE. CASE STUDY: BUCHAREST<br />
Ilinca-Valentina STOICA, Cristian TĂLÂNGĂ, Cristian BRAGHINĂ, Daniela ZAMFIR<br />
(Art#212117-555) . . . . . . . . . . . . . . . . . . . . . . . . . . . . . . . . . . . . . . . . . . . . . . . . . . . . . . . . . . . . . . . . . . . . . . . . . . . . . . . . . . . . 313<br />
SPORTS AND LEISURE TIME TOURISM – A WAY OF REVITALISING EMERGENT SPACES FROM<br />
THE METROPOLITAN AREA OF BUCHAREST<br />
Radu - Daniel PINTILII, Florentina - Cristina MERCIU, Daniel PEPTENATU, Andreea - Loreta<br />
CERCLEUX, Cristian Constantin DRĂGHICI<br />
(Art#212118-539) . . . . . . . . . . . . . . . . . . . . . . . . . . . . . . . . . . . . . . . . . . . . . . . . . . . . . . . . . . . . . . . . . . . . . . . . . . . . . . . . . . . . 323<br />
INTERNAL TOURISM MOVEMENT AND THE MAIN ROMANIAN TOURIST DESTINATIONS (THE<br />
PERIOD 1990 - 2008)<br />
Alexandru ILIEŞ, Dorina Camelia ILIEŞ, Cezar MORAR, Ioana JOSAN<br />
(Art#212119-546) . . . . . . . . . . . . . . . . . . . . . . . . . . . . . . . . . . . . . . . . . . . . . . . . . . . . . . . . . . . . . . . . . . . . . . . . . . . . . . . . . . . . 333<br />
ASPECTS REGAR<strong>DIN</strong>G THE ENVIRONMENTAL IMPACT OF TOURISM ACTIVITIES IN THE<br />
APUSENI NATURAL PARK (ROMANIA)<br />
Ribana LINC, Stelian NISTOR, David TURNOCK<br />
(Art#212120-552) . . . . . . . . . . . . . . . . . . . . . . . . . . . . . . . . . . . . . . . . . . . . . . . . . . . . . . . . . . . . . . . . . . . . . . . . . . . . . . . . . . . . 340<br />
MEANS OF CABLE TRANSPORTATION. AN INFRASTRUCTURAL COMPONENT OF THE<br />
GEOGRAPHICAL LANDSCAPE OF ALBAC - ARIEŞENI TERRITORIAL SYSTEM<br />
Maria GOZNER, Ştefan BAIAS<br />
(Art#212121-545) . . . . . . . . . . . . . . . . . . . . . . . . . . . . . . . . . . . . . . . . . . . . . . . . . . . . . . . . . . . . . . . . . . . . . . . . . . . . . . . . . . . . 354<br />
USING GIS MODELING AND THE DAC STATISTIC TO ANALYZE THE SUSTAINABILITY OF<br />
DEVELOPMENT IN IALOMIłA HYDROGRAPHIC BASIN<br />
Ioan IANOŞ, Alexandru-IonuŃ PETRIŞOR<br />
(Art#212122-535) . . . . . . . . . . . . . . . . . . . . . . . . . . . . . . . . . . . . . . . . . . . . . . . . . . . . . . . . . . . . . . . . . . . . . . . . . . . . . . . . . . . . 363<br />
GEOGRAPHICAL JOURNALS PUBLISHED IN ROMANIA - 2011<br />
Dumitru RUS<br />
(Art#21212923) . . . . . . . . . . . . . . . . . . . . . . . . . . . . . . . . . . . . . . . . . . . . . . . . . . . . . . . . . . . . . . . . . . . . . . . . . . . . . . . . . . . . 370<br />
GEOGRAPHY AND TOURISM ON THE IADULUI VALLEY<br />
Ribana LINC<br />
(Art#212224) . . . . . . . . . . . . . . . . . . . . . . . . . . . . . . . . . . . . . . . . . . . . . . . . . . . . . . . . . . . . . . . . . . . . . . . . . . . . . . . . . . . . 374
Analele UniversităŃii din Ora<strong>de</strong>a – Seria Geografie Year XXI, no. 2/2011 (December), pp. 159-171<br />
ISSN 1454-2749, E-ISSN 2065-1619 Article no. 212101-553<br />
SKI ACTIVITY IN WESTERN PART OF SOUTHERN CARPATHIANS.<br />
CASE STUDY: STRAJA SKI AREA<br />
Mircea VOICULESCU ∗<br />
West University of Timisoara, Department of Geography<br />
4 V. Pârvan Av., 300312, Timisoara, Romania, e-mail: voicu@cbg.uvt.ro<br />
Florentina POPESCU<br />
West University of Timisoara, Department of Geography<br />
4 V. Pârvan Av., 300312, Timisoara, Romania, e-mail: florentina19ro@yahoo.com<br />
Alexandru ONACA<br />
West University of Timisoara, Department of Geography<br />
4 V. Pârvan Av., 300312, Timisoara, Romania, e-mail: ducuonaca@yahoo.com<br />
Marcel TÖRÖK-OANCE<br />
West University of Timisoara, Department of Geography<br />
4 V. Pârvan Av., 300312, Timisoara, Romania, e-mail: torok@cbg.uvt.ro<br />
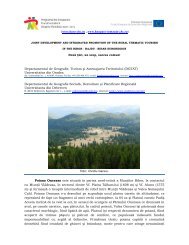
Abstract: The present paper is <strong>de</strong>dicated to the presentation of the ski potential of one of the<br />
most famous ski domain in the Southern Carpathians - the Straja ski area. It is located in the<br />
southeastern part of the Retezat - Go<strong>de</strong>anu range, on the northern slope of the Vâlcan<br />
Mountains. Straja ski area is endowed with a relentless tourist flow drawn by the scenic beauty<br />
of the winter landscape, by its specific amenities and facilities and by the consi<strong>de</strong>rable low<br />
prices of cable transportation and accommodation. The present analysis starts with a quantitative<br />
evaluation of the terrain factors by creating the hypsometric, slope and aspect mo<strong>de</strong>ls but also of<br />
the climatic variables. It is followed by an account of its cable transportation facilities, Straja<br />
having 7 cable transportation lines, serving 6 ski trails, each different in size, vertical drop,<br />
surface, <strong>de</strong>gree of difficulty, carrying capacity and some other services they offer such as night<br />
skiing. Furthermore we have also presented the cable transportation functioning periods, which<br />
are well correlated with the presence and persistence of the snow layer, this being an important<br />
indicator of the management of the ski activities.<br />
Key words: ski activities, Straja ski area, Southern Carpathians, Vâlcan Mountains<br />
* * * * * *<br />
INTRODUCTION<br />
Skiing activities represent very important attributes of winter tourism, being at the same<br />
sport activities, generating an entire industry within mountain areas (Agrawala, 2007; Hudson,<br />
2002, 2004), which is one of the most spectacular forms of tourism (Booth and Cullen, 2001;<br />
Heberlein et al., 2002; Jeanneret, 2001; God<strong>de</strong> et al., 2000; Yang et al., 2009).<br />
In the Romanian Carpathians and especially in the Southern Carpathians, skiing activities<br />
are in full spatial expansion and <strong>de</strong>velopment of the its specific infrastructure (MPTVP, 2009;<br />
∗ Corresponding Author<br />
http://istgeorelint.uora<strong>de</strong>a.ro/Reviste/Anale/anale.htm
160 Mircea VOICULESCU, Florentina POPESCU, Alexandru ONACA, Marcel TOROK-ONACE<br />
MPDTN, 2010). The Straja ski area started <strong>de</strong>veloping as a ski <strong>de</strong>stination after 1990, reaching<br />
today the status of one of the most attractive ski area in the Southern Carpathians, where alpine<br />
skiing and backcountry skiing can be practiced (SDML, 2008).<br />
From the point of view of tourist taxonomy, Straja was consi<strong>de</strong>red initially a genuine tourist<br />
nucleus (łigu, 2001). Today, Straja is a very important resort of local interest, according to H.G.<br />
1122/2002 (PATZVJ, 2003) and reached regional importance. Moreover, Straja is also consi<strong>de</strong>red<br />
in the National Mountain Tourism Development Plan - Superski în CarpaŃi, second edition (Lege<br />
nr. 418/2006 din 16/11/2006; SDDMVJ, 2008).<br />
The purpose of this paper is to present the natural potential of the Straja ski area, its present<br />
infrastructure and its <strong>de</strong>velopment perspectives.<br />
STUDY AREA<br />
Straja ski area is located in the Southern Carpathians, in the southeastern part of the Retezat<br />
- Go<strong>de</strong>anu range, on the northern slope of the Vâlcan Mountains (figure 1). They are oriented in a<br />
WSW - ENE direction and are located between the upper Motrului Valley and the Jiului Gorges,<br />
with a length close to 50 km and a width of 18 - 20 km (Muică, 1995). The geographic bor<strong>de</strong>rs of<br />
these mountains are well expressed by the relief through strong level oscillations at the limit<br />
between the steep slopes of the Vâlcan Mountains and the smooth interfluves towards the<br />
subcarpathians part of Oltenia region in the south and the Petroşani Depression in the north, but<br />
also through transversal <strong>de</strong>ep valley which separates them from the western and the eastern<br />
mountain masses (Geografia României, III, CarpaŃii Româneşti şi Depresiunea Transilvaniei,<br />
1987; Velcea and Savu, 1983; Muică, 1995).<br />
Straja is the generic name of the area situated on the northern slope of the Vâlcan<br />
Mountains, above the small town of Lupeni, un<strong>de</strong>r the peak bearing the same name at the motheastern<br />
boar<strong>de</strong>r of these Mountains, with a <strong>de</strong>clared tourist and sportive activity.<br />
The ski area is bor<strong>de</strong>red in the north by the Petroşani Depression, i.e. by the town of<br />
Lupeni, in the east by the line connecting the Sohodol and Baleia rivers, on the southern si<strong>de</strong> by a<br />
fraction of main the ridge, where the Straja Peak - 1868 m (figure 1), the Mutu Peak - 1737 m, the<br />
Ver<strong>de</strong> Peak - 1627 m, the Gura Plaiului Peak - 1579 m and the Vârful lui Frate Peak - 1524 m are<br />
lined up and in the west by the interfluve separating the Braia and Tunsului rivers.<br />
Figure 1. Location of Vâlcan Mountains and Straja Peak<br />
(Source: photo by Voiculescu, 2009)<br />
Straja is located in the Hunedoara county (being administrated by the municipality of<br />
Lupeni), but also within the Vâlcan Mountains, due to the fact that Straja is also an entrance point<br />
to theses mountains; the ski trails number 3.11 and 12 (Popescu, 1979) go towards the main ridge,<br />
making the connection towards east and west with other trails.
Ski Activities in Wenstern Part of Southern Carpathians… 161<br />
MATERIALS AND METHODS<br />
The main features of mountain resorts to be analyzed and compared are the natural factors,<br />
especially the ones related to terrain and the climatic factors, having the major concern directed<br />
towards snow - duration of the snow layer, <strong>de</strong>pth and the economic conditions related to<br />
infrastructure and capitalization of wither-sport produce.<br />
Therefore we have used a 30 m resolution Aster DEM to <strong>de</strong>pict the thematic maps<br />
concerning the terrain analysis important for ski resorts: altitu<strong>de</strong>, slope and aspect (Török-Oance,<br />
2001 - 2002). As for the analysis of the climatic factors we have used the data provi<strong>de</strong>d by the<br />
Parâng weather station.<br />
RESULTS<br />
Terrain features<br />
The terrain factor is an essential element serving the principle of providing high quality<br />
natural background for the winter - sport tourism (Jamieson and Johnson, 1998; McClung and<br />
Schweizer, 1999; Schweizer and Jamieson, 2001; łigu, 2001).<br />
Figure 2. DEM (on the left si<strong>de</strong>) and hypsometric map (on the right si<strong>de</strong>)<br />
Figure 3. Declivity map (on the left si<strong>de</strong>) and aspect map (on the right si<strong>de</strong>)
162 Mircea VOICULESCU, Florentina POPESCU, Alexandru ONACA, Marcel TOROK-ONACE<br />
The most important factors that need to be studied within the terrain analysis are: altitu<strong>de</strong>,<br />
slope, and aspect, to which we can add plane and profile curvature as well. For terrain analysis we<br />
had first generate the digital elevation mo<strong>de</strong>l (DEM), from which we have <strong>de</strong>rived the<br />
hypsometric, slope and aspect mo<strong>de</strong>ls (figure 2 and figure 3), using ArcGIS Software.<br />
Altitu<strong>de</strong> bares two connotations: absolute altitu<strong>de</strong> (of the ski area) and vertical drop. High<br />
altitu<strong>de</strong> ski area are not characteristic for the Romanian ski area landscape, excepting Sinaia ski<br />
area (from Bucegi Mountains) and Bâlea ski area (from Făgăraş massif) both located at over 2000<br />
m altitu<strong>de</strong>. In terms of vertical drop, to be able to consi<strong>de</strong>r a ski area for a future or existing resort<br />
the vertical drop has to integrate within these values: 400 - 1600 m (Peterson, 2005). Directing our<br />
attention towards our areas of interest we can realize that form the altitu<strong>de</strong>s’ point of view, the<br />
Straja ski area is located within the range of 1800 m and 800 m, measuring a vertical drop higher<br />
than 1000 m, being very well integrated into Petterson’s principle (2005). This prerequisite<br />
condition is fulfilled if we consi<strong>de</strong>r the possibility of going downslope until Lupeni, where the<br />
bottom station of the chairlift is located.<br />
Slope is a <strong>de</strong>fining parameter for ski area for it separates the type of ski trails for different<br />
category skiers. Penniman (1999, pp. 36) separates the skiers into two large categories: skiers who<br />
are users of skies or snowboards or other gravity propelled recreational <strong>de</strong>vices whose <strong>de</strong>sign and<br />
function allow users a significant <strong>de</strong>gree of control over speed and direction on snow and<br />
beginners, whom he categorizes as: those individuals whom use one or another of these <strong>de</strong>vices for<br />
the first time or who possess marginal abilities to turn or stop on slopes with an incline greater<br />
than 20%. It is fair to say that these are quite different one from the other and also use different<br />
reporting units (% and °), therefore, today, there are accepted different classifications. There are<br />
numerous classifications of ski trails and of skiers alike. Therefore, some researchers (Borgersen,<br />
1977, quoted by Penniman, 1999; Gaylor and Rombold, 1964; Tremper, 2001) separated the skiers<br />
into 3 large categories, and allocated very tight classes of <strong>de</strong>clivity for them: beginners or novice,<br />
intermediates, advanced or expert (table 1) or according to Blanchère scale (Tremper, 2001),<br />
mo<strong>de</strong>rate skiers, good skier and very good skier (table 2).<br />
Erickson, 1992<br />
(quoted by Penniman, 1999)<br />
Table 1. Slope gradient criteria<br />
Borgersen, 1977<br />
(quoted by Penniman, 1999)<br />
Trail co<strong>de</strong> Skier ability Gra<strong>de</strong> max Trail co<strong>de</strong> Skier ability Gra<strong>de</strong> max Trail co<strong>de</strong><br />
easier<br />
more<br />
difficult<br />
most<br />
difficult<br />
basic beginner<br />
basic intermediate<br />
no<br />
<strong>de</strong>scription<br />
15%<br />
8.5°<br />
24%<br />
13.5°<br />
50%<br />
26.5°<br />
(no co<strong>de</strong>)<br />
(no co<strong>de</strong>)<br />
(no co<strong>de</strong>)<br />
beginner<br />
intermediate<br />
advanced<br />
extreme no <strong>de</strong>scription (no value) (no co<strong>de</strong>) expert<br />
20%<br />
11.5°<br />
35%<br />
19°<br />
55%<br />
29°<br />
80%<br />
39°<br />
(no co<strong>de</strong>)<br />
(no co<strong>de</strong>)<br />
(no co<strong>de</strong>)<br />
Gaylor and Rombold, 1964<br />
Skier<br />
ability<br />
novice<br />
intermediate<br />
expert<br />
Gra<strong>de</strong> max<br />
20%<br />
11.5°<br />
34%<br />
18°<br />
35%<br />
(.5°<br />
>35%<br />
>19°<br />
Skier ability<br />
mo<strong>de</strong>rate skier<br />
good skier<br />
very good skier<br />
Table 2. Blanchère scale<br />
(Data source: Tremper, 2001)<br />
Caracateristics<br />
a skier of mo<strong>de</strong>rate ability capable of secure stem turns, off-piste, in all condition, on<br />
slope of 25°-30°<br />
able to make controlled turns of snow on slopes of 30°-35°. able to <strong>de</strong>scend short<br />
steeper pitches and handle difficult snow<br />
able to ascend and <strong>de</strong>scend on skis sustained and exposed slopes that most people can<br />
only climb up with axe and crampons. these are slopes in excess of 45o requiring a<br />
high level of skill and experience, to say nothing of courage.
Ski Activities in Wenstern Part of Southern Carpathians… 163<br />
At the highest altitu<strong>de</strong>s, the slopes surpass 30° - 35°, in the middle of the ski area slopes<br />
have values of 25° - 30°, but also there are areas with slopes between 15° - 20° (figure 3). To<br />
emphasize the role of the slope when classifying skiers we have drawn two profile line along si<strong>de</strong><br />
two ski trails (figure 4 and figure 5). It is easily noticed that 1st profile is consistent with a trail<br />
addressing skiers with abilities of <strong>de</strong>scending trails with high speeds, while the 2nd profile is<br />
consistent with a trail which can be un<strong>de</strong>rtaken by both advanced and medium skiers.<br />
Figure 4. Location of two profile line along si<strong>de</strong> two ski trails<br />
Figure 5. Longitudinal profiles of two ski trails<br />
In terms of aspect, most slopes are oriented towards north, north-west and west (figure 3),<br />
which are highly favorable for skiing activities. The radiation of the sun controls snow surface<br />
temperature more than air temperature (Tremper, 2001) and plays a very important role affecting<br />
snow instability and <strong>de</strong>gree of humidity (McClung and Schaerer, 1993).
164 Mircea VOICULESCU, Florentina POPESCU, Alexandru ONACA, Marcel TOROK-ONACE<br />
CLIMATIC ANALYSIS<br />
The other fundamental natural factors are the climatic ones with a major focus on snow<br />
(Jamieson and Johnson, 1998; McClung and Schweizer, 1999; Schweizer and Jamieson, 2001;<br />
łigu, 2001), where literature states that in or<strong>de</strong>r to have an economic efficient resort, it is<br />
necessary to have 120 days of snow - covered ski area (łigu, 2001), or other researchers have the<br />
opinion that if in seven out of ten winters there is snow covering of at least 30 cm on at least 100<br />
days between 1 December and 15 April (Becken and Hay, 2007, pp. 38; Besancenot, 1990; Freitas,<br />
2005; Hall and Higham, 2005) it is the place of a safe investment. For the synthetic climatic<br />
analysis of the Straja ski area we have used the data registered by the close-by Parâng<br />
meteorological station, in the interval of 1961 - 2007.<br />
Temperature plays an essential role because it <strong>de</strong>notes the type of precipitations (figure 6).<br />
The mean multiannual average is of 3.4oC. As of the month of December, the mean temperature<br />
becomes negative and remains this way until March. Thermal regime influences the type of<br />
precipitations, liquid or solid, number of days with snowfall (figure 6) and implicitly the <strong>de</strong>pth and<br />
duration of the snow cover (figure 6).<br />
Figure 6. Variation of temperature (on the left si<strong>de</strong>), a number of days with snowfalls and number of days<br />
with snow cover (on the right si<strong>de</strong>), at Parâng weather station<br />
between 1961 - 2007, average multiannual values<br />
As soon as October, the first days with snowfall are registered, so that in November the fist<br />
snow layer takes shape. Snow falls until the month of May, but the snow cover, being conditioned<br />
by temperature, only lasts up to April and rarely up to May. In this context, we need to mention<br />
that he earliest fist day with snowfall was registered to be the 03.08 and the latest fist day with<br />
snow fall was 12.11. Continuing the same i<strong>de</strong>a we need to mention that the earliest last day with<br />
snowfall was registered to be 16.04 and the latest last day with snowfall 19.07. Therefore the<br />
longest period of the snowfall interval was of 312 days and the smallest of 255 days (Bogdan,<br />
2008). Furthermore we need to mention that the average duration of the snowfall interval is of 93.7<br />
days and the average duration of the snow cover is of 131.1 days (Bogdan, 2008).<br />
SKI INFRASTRUCTURE<br />
At the beginning of the years 2000, at Straja there were one chairlift and two ski lifts (łigu,<br />
2001). Today there are 7 homologated ski trails (tabelul 3, figure 7 and figure 8) with a total length of<br />
9074.5 m which cover a surface of <strong>de</strong> 143,750 sqm. The ski trails are homologated (as stated in the<br />
Strategia <strong>de</strong> <strong>de</strong>zvoltare durabilă a Microregiunii Valea Jiului, 2008). Even though all the ski trails are<br />
located on the northern si<strong>de</strong> of the Vâlcan Mountains, they are differentiated according to the local<br />
topography. Therefore they differ in size and covered surface (figure 8). As for the <strong>de</strong>gree of difficulty,<br />
50% of the ski trails are easy, 16.6% medium and 33.3% difficult. Only one ski trail, Telescaun which<br />
insures the connection of the highest parts of the ski area and the town of Lupeni, has a shared <strong>de</strong>gree of<br />
difficulty between medium (80%) and difficult (20%), therefore being <strong>de</strong>dicated to skier with high<br />
technical abilities. We need to mention that 3 of the ski trails have night lighting that insures their<br />
lengthy operation hours which can be noticed in the schedule of the cable transportation facilities.
Nr.<br />
crt.<br />
Ski Activities in Wenstern Part of Southern Carpathians… 165<br />
Table 3. Caracteristics of the ski trails<br />
(Data source: Strategia <strong>de</strong> <strong>de</strong>zvoltare durabilă a Microregiunii Valea Jiului, 2008)<br />
Name of the<br />
homologated<br />
ski trails<br />
Trail lenght<br />
(m)<br />
Degree of difficulty<br />
Vertical<br />
drop (m)<br />
Surface<br />
(m²)<br />
Night<br />
skiing<br />
1. 1,2 Constantinescu 1741.5 easy 364 45000 yes<br />
2. 1,2 Lupului 519 difficult 163 32500 no<br />
3. 1,2 Mutu 1269 medium 320 10000 yes<br />
4. 1,2 Sfântu Gheorghe 700 easy 144.5 26000 no<br />
5. 1 Platoul Soarelui 405 easy 51 27000 yes<br />
6. 1 Canal 1400 difficult 180 3250 no<br />
7. 1 Telescaun 3200<br />
medium (80%),<br />
difficult (20%)<br />
593 - no<br />
1 - ski trails homologated (Strategia <strong>de</strong> <strong>de</strong>zvoltare durabilă a Microregiunii Valea Jiului, 2008)<br />
2 - ski trails homologated according to Ministerul Turismului din România<br />
Figure 7. Ski trails of the Straja ski area<br />
(Source: Strategia <strong>de</strong> <strong>de</strong>zvoltare durabilă a Microregiunii Valea Jiului, 2008)
166 Mircea VOICULESCU, Florentina POPESCU, Alexandru ONACA, Marcel TOROK-ONACE<br />
Figure 8. Length of ski trails (on the left si<strong>de</strong>) and surface covered by the trails (on the right si<strong>de</strong>)<br />
The highest <strong>de</strong>nsity of users is noticed on the Constantinescu and Mutu ski trails<br />
(figure 9) due to their consi<strong>de</strong>rable length and their medium <strong>de</strong>gree of difficulty. Another ski<br />
trail very much used is the Platoul Soarelui (figure 10) due to its easy <strong>de</strong>gree of difficulty,<br />
where tourists come to learn to ski. The Lupului and Canal ski trails (figure 10) are used only<br />
by skiers with high technical abilities.<br />
Figure 9. Constantinescu ski piste (on the left si<strong>de</strong>) and Mutu ski piste (on the right si<strong>de</strong>)<br />
(Source: photos by Voiculescu, 2009)<br />
Figure 10. Platoul Soarelui ski piste (on the left si<strong>de</strong>) and Canal ski piste (on the right si<strong>de</strong>)<br />
(Source: photos by Voiculescu, 2009)<br />
Cable transportation has <strong>de</strong>veloped over time and space as a response to gradually rising tourist<br />
<strong>de</strong>mands. If until 2001 there was only one means of cable transportation which served various trails and<br />
had a length of 1.45 km, with a capacity of 650 pers / hour (łigu, 2001), thereafter the situation improved<br />
consi<strong>de</strong>rably. Presently, there are 6 ski lifts, with a total length of 4671 m and which now serve all the ski<br />
trails of the Straja ski area. Transport time is reduced and the operation hours are differentiated in<br />
accordance the facilities of each ski trail, especially with the night skiing facilities (table 4).
Ski Activities in Wenstern Part of Southern Carpathians… 167<br />
Name of<br />
lift<br />
Ski lift 1<br />
Ski lift 2<br />
Ski lift 3<br />
Table 4. Caracteristics of ski lifts<br />
(Data source: Strategia <strong>de</strong> <strong>de</strong>zvoltare durabilă a Microregiunii Valea Jiului, 2008)<br />
Ski trail served<br />
Lupului, Mutu<br />
Constantinescu<br />
Platoul Soarelui<br />
Mutu, Lupului, Canal<br />
Platoul Soarelui<br />
Constantinescu<br />
Constantinescu<br />
Sfântu Gheorghe<br />
Platoul Soarelui<br />
Length<br />
(m)<br />
Vertical<br />
drop (m)<br />
Transport<br />
duration<br />
(min.)<br />
Capacity<br />
persons/hour<br />
519 163 4 675<br />
905 260 5 780<br />
952 180 5 840<br />
Ski lift 4 Sfântu Ghorghe 650 145 5 424<br />
Ski lift 5<br />
Ski lift 6<br />
Constantinescu<br />
Platoul Soarelui<br />
Mutu<br />
Constantinescu<br />
Platoul Soarelui<br />
1260 198.6 4 600<br />
385 102 4 520<br />
Schedule<br />
09.00-<br />
02.00<br />
09.00-<br />
17.00<br />
09.00-<br />
24.00<br />
09.00-<br />
17.00<br />
09.00-<br />
24.00<br />
09.00-<br />
24.00<br />
The transport capacity rose in the last few years, having values between 424 pers / hour and<br />
840 pers / hour, the highest values being reached by the Constantinescu, Sfântu Gheorghe ski trails<br />
which are the lengthiest and the most used by tourists. The smallest values are registered by the<br />
Lupului ski trail which is relatively short, but at the same time the most difficult and by the Platoul<br />
Soarelui which is again a short ski trail, but this time the easiest as well (table 3).<br />
Table 5. Ski lift <strong>de</strong>mands<br />
(Data source: DocumentaŃie Primăria Lupeni, 2005)<br />
Number ski lift Demand (%)<br />
1 2<br />
2 22<br />
3 30<br />
4 5<br />
5 18<br />
6 23<br />
Figure 11. Demand dynamics for the ski-lifts<br />
(Source: DocumentaŃie Primăria Lupeni, 2005)
168 Mircea VOICULESCU, Florentina POPESCU, Alexandru ONACA, Marcel TOROK-ONACE<br />
Ski lift <strong>de</strong>mands according to DocumentaŃie Primăria Lupeni (2005) differ in accordance<br />
with their <strong>de</strong>gree of usage (table 5, figure 11). The highest <strong>de</strong>mand (30%) is without out a doubt<br />
for the ski lift no 3, placed at the eastern end of the ski area, holding the advantage of transporting<br />
tourists towards the highest areas of the domain.<br />
Table 6. Ski activities record<br />
(Data source:according to DocumentaŃie Primăria Lupeni, 2005)<br />
Winter season Month Ski lift<br />
November did not work<br />
December 1,2<br />
January 1,2<br />
1999 - 2000<br />
February 1,2,3<br />
March 1,2,3<br />
April did not work<br />
November did not work<br />
December 1,2<br />
2000 - 2001<br />
January 1,2<br />
February 1,2,3<br />
March 1,2,3<br />
April did not work<br />
November did not work<br />
December 1,2<br />
2001 - 2002<br />
January 1,2<br />
February 1,2,3<br />
March 1,2,3<br />
April did not work<br />
November did not work<br />
December 1<br />
2002 - 2003<br />
January 1,3<br />
February 1,2,3<br />
March 1,2<br />
April did not work<br />
November did not work<br />
December 1,2,3,4,6<br />
2003 - 2004<br />
January 1,2,3,4,6<br />
February 1,2,3,4,6<br />
March 1,2,6<br />
April did not work<br />
November did not work<br />
December 1,2,3,4,5,6<br />
2004 - 2005<br />
January 1,2,3,4,5,6<br />
February 1,2,3,4,5,6<br />
March 1,2,3,6<br />
April 1,2,3,6<br />
High <strong>de</strong>mands (23%, respectively 22%) are directed to the ski lift no 6, respectively no 2,<br />
accessible at the entrance in the ski domain. Small <strong>de</strong>mand is directed towards the ski lift no 1<br />
(2%), due to the fact that it serves the Lupului ski trail, which is the most difficult, <strong>de</strong>stined for<br />
advanced skiers only and respectively towards ski-lift no 4 (5%), due to its lowest location and<br />
lack of snow at the beginning and at the end of the season. Even though the winter season is<br />
consi<strong>de</strong>red to be entailed in the November-April interval, skiing activities take place in the<br />
December-April interval, when the snow has the required characteristics for the skiing activities.<br />
Their intensity is <strong>de</strong>termined by snowfall and implicitly by the existence and the <strong>de</strong>pth of the snow
Ski Activities in Wenstern Part of Southern Carpathians… 169<br />
layer. The municipality of Lupeni, which is responsible for the administration of the Straja ski<br />
area, has created an interesting record of the ski activities in the interval 1999 - 2005<br />
(DocumentaŃie Primăria Lupeni, 2005) (table 6).<br />
After analyzing this record we have <strong>de</strong>termined some interesting aspects with regard to the<br />
usage dynamics of the ski-lifts in the November-April interval:<br />
- the months of November and April coinci<strong>de</strong> with the beginning, and the end of the season<br />
respectively, therefore are not suited for skiing activities, except for the year 2005 when 4 ski lifts<br />
were still in usage in the April;<br />
- the months of February and March are characterized by a high frequency of winter sport<br />
activities, when the snow layer has a consi<strong>de</strong>rable <strong>de</strong>pth and when at least 2 - 3 ski lifts operational;<br />
- in the same i<strong>de</strong>a we need to mention that in the winter of 2003 - 2004 in February and<br />
March, 5 lifts were functioning, while in the winter of 2004 - 2005 all ski lifts were operational in<br />
the same monthly interval, which is a clear indicator of the large quantities of snow and of the<br />
favorable <strong>de</strong>pth of the snow layer for skiing;<br />
- in the winters of 2003 - 2004 and 2004 - 2005 a high usage of the ski lifts was recor<strong>de</strong>d: 5<br />
of them in the December - February interval, respectively 6 for the same interval in the winter of<br />
2004 - 2005 and 4 ski - lifts for both winters in the March-April interval.<br />
DISCUSSION<br />
If in the beginning of the years 2000, the Straja ski area had great potential to achieve the<br />
required numbers for the specific indicators (Qt / Qp, where Qt - pers/hour, Qp - capacity of cable<br />
transportation; Lt / Nl, where Lt - total length of the transportation lines, Nl - no of<br />
accommodation beds; Qt / Nl şi Lp / Nl, where Lp - ski trail length) for the tourist nucleus status,<br />
presently most of these have been achieved (table 7):<br />
Nr.<br />
crt.<br />
Table 7. Characteristic of the ski trails including the optimum carrying capacity (Qt)<br />
Name of the<br />
homologated<br />
ski trails<br />
Trail lenght (m)<br />
Width<br />
(m)<br />
Vertical drop<br />
(m)<br />
Degree of<br />
difficulty<br />
Qt<br />
(persons)<br />
1. Constantinescu 1741.5 50 364 easy 435<br />
2. Lupului 519 40 163 difficult 120<br />
3. Mutu 1269 50 320 medium 345<br />
4.<br />
Sfântu<br />
Gheorghe<br />
700 30 145 easy 105<br />
5. Platoul Soarelui 405 60 102 easy 150<br />
6. Canal 1400 8 260 difficult 40<br />
Total 4239.5 1195<br />
The carrying capacity is calculated having in view the vertical drop, the width of the ski<br />
trail and especially important is the difficulty category of the ski trails. It <strong>de</strong>fines how many<br />
persons can be at the same time on that particular trail without inconveniencing each other.<br />
Without consi<strong>de</strong>ring the trail un<strong>de</strong>r the chairlift where the carrying capacity is rather impossible to<br />
calculate due to the fact that it belongs to two category types, there can be 1195 skiers on the ski<br />
trails of Straja. Here there can be ad<strong>de</strong>d the persons riding the ski lift at the same time.<br />
Without counting the benefits of the chairlift there are over 4.2 km of ski trails over the altitu<strong>de</strong><br />
of 1200 m, which is highly important consi<strong>de</strong>ring the fact that there are the one mostly used (table 5)<br />
and the fact that most of the season they are the beneficiaries of natural snow, and also if we compare<br />
them to the 2001 retaliation (łigu), when there were 1.95 km of ski trail, we realize the improvement.<br />
Furthermore if we take into consi<strong>de</strong>ration the evaluation criteria of the attractiveness of this<br />
ski area, according to łigu (2001), we can conclu<strong>de</strong> the following:<br />
- the <strong>de</strong>gree of accessibly to the ski area has improved due to the fact that in addition to the chairlift<br />
the road which connects the town of Lupeni with the resort of Straja was asphalted on a length of 9.3 km;<br />
- the natural tourist potential is outstanding serving as guarantee for the tourist market;
170 Mircea VOICULESCU, Florentina POPESCU, Alexandru ONACA, Marcel TOROK-ONACE<br />
- the ski area is endowed with features which enables tourists to practice alpine skiing,<br />
snowboarding and backcountry skiing;<br />
- the accommodation capacity has improved as well, through the emergence of new<br />
locations as a result of private local investors, but also through the improvement of the <strong>de</strong>gree of<br />
comfort - some of the existing chalets being classified;<br />
- if 10 - 15 years ago, the length of the trails was a weak point, today it became a point of<br />
attractiveness, due to its present size;<br />
- the existence of 7 cable transportation lines insure an efficient access to all trails;<br />
- the length of the trails are better correlated with the accommodation capacity, still in weekends<br />
and in peak season on some of the trails there are uncomfortable agglomerations of skiers;<br />
- in the same peak-season the hourly flow of the cable transportation capacity is overrun.<br />
Even though this is beyond our purpose, we could mention that during the summer season<br />
there are different activities that can be practiced in the Straja area: rest, walks, berry picking. The<br />
tourist <strong>de</strong>mand of the Straja ski area is characterized by an effective and sustained national <strong>de</strong>mand<br />
according to łigu (2001). Unfortunately the international <strong>de</strong>mand is still very low. Consi<strong>de</strong>ring the<br />
potential <strong>de</strong>mand, it follows the pattern of the effective one.<br />
CONCLUSIONS<br />
It is without a doubt that Straja represents one of the most dynamic and most important ski area<br />
of the Southern Carpathians, being integrated from a taxonomical point of view as a tourist resort. It has<br />
a tremendous natural potential, having sheltered and relatively long slopes, and of 4 - 5 months of snow<br />
each year. Due to its location in the western part of Southern Carpathians, Straja ski area is attractive to<br />
tourists from the din Banat and Transylvanian Regions, as much as to the ones coming from the<br />
southern and eastern part of Romania, a reality which we have observed on location.<br />
Complementing the alpine skiing activities, the Straja ski area is the perfect place for tourist<br />
that want to learn how to ski and also the perfect place to enjoy the snow and other winter<br />
activities such as snowboarding, ski touring, snow-mobiles ri<strong>de</strong>s which are specific to mountain<br />
areas characterized by skiing activities, according to Hudson (2002). It is remarkable the fact that<br />
in the last few years, the <strong>de</strong>gree of attractiveness has improved due to the emergence of new ski<br />
lifts but also due to the improvements of the skiing conditions (more facilities, better grooming).<br />
Having in view that Straja ski area is integrated in the larger Parâng - Retezat region,<br />
<strong>de</strong>clared by the Romanian Ministry of Tourism and Regional Development as a national tourism<br />
interest area (PIDULJH, 2008), we can therefore un<strong>de</strong>rline the attention that is directed towards<br />
this particular area, especially that according to PIDULJH (2008), the region that Straja is<br />
integrated in is annually visited by 500,000 tourists.<br />
ACKNOWLEDGEMENTS<br />
The research for this paper was supported by National University Research Council<br />
(CNCSIS - UEFISCSU), Romania, project number PNII - IDEI 1066/2009, Creation of the data<br />
base and thematic maps for the ski areas in the Southern Carpathians using GIS. Analysis, up to<br />
date evaluation and prognosis within the global climatic changes perspective.<br />
REFERENCES<br />
Agrawala S. (2007), Changements climatiques dans les Alpes Européennes. Adapter le tourisme d’hiver et la gestion <strong>de</strong>s<br />
risques naturels, OCDE, 140 pp;<br />
Becken S., Hay E. J. (2007), Tourism and Climate Change: Risks and Opportunities, Multilingual Matters, 352 pp.<br />
Besancenot P. J. (1990), Climat et tourisme, MASSON, 223 pp;<br />
Bogdan O. (2008), CarpaŃii Meridionali. Clima, hazar<strong>de</strong>le meteo-climatice şi impactul lor asupra turismului, Edit. Univ.<br />
Lucian Blaga, Sibiu, 324 pp;<br />
Booth L. K., Ross Cullen R. (2001), Managing Recreation and Tourism in New Zealand Mountains, Mountain Research<br />
and Development, Vol 21, No 4: 331-334;
Ski Activities in Wenstern Part of Southern Carpathians… 171<br />
Freitas R. C. (2005), The Climate-Tourism Relationship and its Relevance to Climate Change Impact Assessment, in<br />
Tourism, Recreation, and Climate Change (Hall M C, Higham S E J, edit.), Channel View Publications, pp. 29-44.<br />
God<strong>de</strong> M. P., Price F. M., Zimmerman M. F. (2000), Tourism and <strong>de</strong>velopment in mountain regions, CABI Publishing, 357 pp;<br />
Hall M. C., Higham S. E. J. (2005), Introduction: Tourism, Recreation and Climate Change, in Tourism, Recreation, and<br />
Climate Change (Hall M C, Higham S E J, edit.), Channel View Publications, pp. 3-29;<br />
Hudson S. (2002), Sport and Adventure Tourism, Haworth Press, 324 pp;<br />
Hudson S. (2004), Winter Sport Tourism in North America, in Brent, R., Daryl, A. (eds.), Sport Tourism,<br />
Interrelationships, Impacts and Issues, Cromwell Press, 77-101 pp;<br />
Jamieson B., Johnson D. C. (1998), Snowpack characteristics for skier triggering, Canadian Avalanche Association,<br />
Avalanche News, 85, 31-39;<br />
Jeannere F. (2001), Different Human Impacts in Similar Settings, Mountain Research and Development 21(4):314-319;<br />
McClung D. M., Schaerer P. (1993), The avalanche handbook. The Mountaineers, Seattles, USA, 271 pp;<br />
McClung D. M., Schweizer J. (1999), Skier triggering, snow temperatures and the stability in<strong>de</strong>x for dry-slab avalanche<br />
initiation, J. Glaciol., 45(150), 190-200;<br />
Muică C. (1995), MunŃii Vâlcanului, structura şi evoluŃia peisajului, Editura Aca<strong>de</strong>miei Române, 158 pp;<br />
Popescu N. (1979), MunŃii Vâlcan, Editura Sport-turism, Bucureşti, 107 pp;<br />
Schweizer J., Jamieson B. (2001), Snow cover properties for skier triggering of avalanches, Cold Regions Sciences and<br />
Technology, Vol. 33, Issues 2-3, pp. 207-221;<br />
łigu G. (2001), Turism montan, Ed. Uranus, Bucureşti, 296 pp;<br />
Tremper B. (2001), Staying alive in avalanche terrain, The Mountaineers Book, Seattle, 272;<br />
Yang M., Hens L., Ou X., Wulf R. (2009), Tourism: An Alternative to Development? Reconsi<strong>de</strong>ring Farming, Tourism, and<br />
Conservation Incentives in Northwest Yunnan Mountain Communities, Mountain Research and Development, 29(1):75-81;<br />
*** (1987), Geografia României, III, CarpaŃii Româneşti şi Depresiunea Transilvaniei, Editura Aca<strong>de</strong>miei Române, 655 pp.<br />
*** (2003), Planul <strong>de</strong> amenajare a teritoriului zonal Valea Jiului. Elemente care condiŃionează <strong>de</strong>zvoltarea (PATZVJ),<br />
Institutul NaŃional <strong>de</strong> cercetare - <strong>de</strong>zvoltare pentru urbanism şi <strong>de</strong>zvoltarea teritoriului, URBANPROIECT, 56 pp;<br />
*** (2005), DocumentaŃie Primăria Lupeni (DPL), Ju<strong>de</strong>Ńul Hunedoara, 4 pp;<br />
*** Lege nr. 418/2006 din 16/11/2006 privind modificarea si completarea Legii nr. 526/2003 pentru aprobarea<br />
Programului national <strong>de</strong> <strong>de</strong>zvoltare a turismului montan „Superschi in Carpati";<br />
*** (2008), Strategia <strong>de</strong> <strong>de</strong>zvoltare durabilă a Microregiunii Valea Jiului (SDDMVJ), Consiliul local al municipiului<br />
Lupeni, Ju<strong>de</strong>Ńul Hunedoara, 86 pp;<br />
*** (2008), Strategia <strong>de</strong> <strong>de</strong>zvoltare a municipiului Lupeni pentru perioada 2007 – 2013 (SDML), Anexa la HCL, NR. 76,<br />
Consiliul local al municipiului Lupeni, Ju<strong>de</strong>Ńul Hunedoara, 96 pp;<br />
*** (2009), Master plan în turism pe Valea Prahovei şi Zona Braşov-Râşnov (MPTVP), Faza I - Analiza zonei Valea<br />
Prahovei şi Braşov - Râşnov, Institutul NaŃional <strong>de</strong> Cercetare - Dezvoltare în Turism (INCDT), 112 pp;<br />
*** (2010), Master Planul pentru Dezvoltarea Turismului NaŃional 2007-2026 (MPDTN), OrganizaŃia Mondială a<br />
Turismului (accessed on the official Webpage of the Ministry for Regional Development and tourism<br />
http://www.mdrt.ro/ on the 2nd Aug 2010);<br />
*** (2008), Plan integrat <strong>de</strong> <strong>de</strong>zvoltare urbană Lupeni, Ju<strong>de</strong>Ńul Hunedoara (PIDULJH), http://www.elupeni.ro/docs/noutati/PIDU_Lupeni.pdf<br />
Submitted: Revised: Accepted and published online<br />
August 29, 2011 November 28, 2011 December 12, 2011
Analele UniversităŃii din Ora<strong>de</strong>a – Seria Geografie Year XXI, no. 2/2011 (December), pp. 172-180<br />
ISSN 1454-2749, E-ISSN 2065-1619 Article no. 212102-547<br />
CONTRIBUTIONS TO INVENTORY AND ASSESSEMENT OF THE<br />
GEOMORPHOSITES IN CĂLIMANI NATIONAL PARK. CASE STUDY:<br />
12 APOSTLES GEOLOGIC RESERVE<br />
Ioan BÂCA ∗<br />
„Babeş-Bolyai” University of Cluj Napoca, Faculty of Geography, BistriŃa Extension,<br />
Andrei Mureşanu Street, 3-5, BistriŃa, Romania, e-mail: john_grimo@yahoo.com<br />
Abstract: Contributions to inventory and assessment of the geomorphosites in Călimani<br />
National Park. Case study: 12 Apostles Geologic Reserve. The 12 Apostles Geomorphosite is<br />
located in the National Park Călimani, on the north-eastern bor<strong>de</strong>r of the Călimani cal<strong>de</strong>ra,<br />
and its geological reference object is 12 Apostles Geologic Reserve, IVth category according<br />
to IUCN. The geomorphosites inclu<strong>de</strong> several residual rock formations, shaped in volcanic<br />
conglomerates, presenting phytomorphic (mushrooms), zoomorphic (lizards, dragons), and<br />
anthropomorphic (historical figures, apostles etc.) physiognomies, with a high touristic<br />
attraction. Therefore, the geomorphosite is a major regional tourist attraction, integrated in<br />
tourist circuits in the Călimani Mountains. Starting from these premises, this paper aims the<br />
evaluation of this geomorphosite in terms of scientific, aesthetic, ecological, cultural and<br />
economic value, and to establish its global value, an extremely important parameter for future<br />
strategies, and for preservation and tourism exploitation. This approach was based on rich<br />
literature and methodology regarding inventory and evaluation of geomorphosites, applied to<br />
the particularities of this area. The results are particularly relevant, emphasizing the<br />
importance of the 12 Apostles geomorphosite within the Călimani National Park.<br />
Key words: geomorphosite, geologic reserve, geoheritage, geotourism, Călimani Mountains,<br />
Călimani National Park, IUCN<br />
* * * * * *<br />
FOREWORD<br />
The last <strong>de</strong>ca<strong>de</strong> witnessed intensified concerns about inventory and assessment of the<br />
geomorphosites and geosites as landforms with scientific, aesthetic, ecologic, economic and<br />
cultural value from human perspective (Panizza and Piacente, 1993; Panizza, 2001; Panizza and<br />
Piacente, 2003; Pralong, 2005; Pralong and Reynard, 2005; Reynard and Panizza, 2005; Reynard<br />
et al., 2009a; Reynard et al., 2009b; Ilieş and Josan, 2009); elements of biodiversity and human<br />
creations complement the assets of a particular region that can be exploited through tourism<br />
activities (Marthaler, 2003).<br />
At European level, numerous works in this field have been published; for Romania, we can<br />
mention studies by teams of researchers from the Faculty of Geography of the Ora<strong>de</strong>a University<br />
(Ilieş and Josan, 2009), from the Faculty of Geography of the Bucharest University (Comănescu et<br />
∗ Corresponding Author<br />
http://istgeorelint.uora<strong>de</strong>a.ro/Reviste/Anale/anale.htm
Contribution to Inventory and Assessement of the Geomorphosites… 173<br />
al., 2009; Comănescu and Dobre, 2009; Comănescu and Ne<strong>de</strong>lea, 2010), and from the Faculty of<br />
Tourism Geography from Bistrita (Bâca, 2011; Bâca and Schuster, 2011).<br />
This paper, as part of the project „Inventory and assessment of the geomorphosites from<br />
Călimani National Park” initiated by the Faculty of Tourism Geography from the Babeş-Bolyai<br />
University Cluj-Napoca, intends to submit to analysis one of the most relevant geomorphosite in<br />
this area, namely 12 Apostles Geologic Reserve, which is a particularly attractive target, inclu<strong>de</strong>d<br />
in tourist circuits from this Carpathian sector.<br />
WORK METHODOLOGY<br />
In preparing this study, several methodological stages were followed:<br />
- consulting the literature regarding this geomorphosites (Naum and Butnaru, 1969; Naum,<br />
1970; Naum, 1974; Naum and Butnaru, 1989);<br />
- processing tourism information and the existing literature and articles from various tourist<br />
websites (www.alpinet.ro, www.turismland.ro, www.inromania.info, www.dor<strong>de</strong>duca.ro,<br />
www.vatradornei.net, www.lasuceava.ro, www.panoramio.com);<br />
- consulting existing literature regarding inventory and evaluation of various<br />
geomorphosites (Panizza and Piacente, 1993; Reynard, 2006);<br />
- conducting field research, implementation of inventory and evaluation sheets for the 12<br />
Apostles geomorphosite, according to international methodology.<br />
RESULTS AND DISCUSSIONS<br />
STUDY AREA<br />
The Călimani National Park is located in Călimani Mountains, covering an area of 24,041<br />
hectares and was established by Law no. 5 / 2000 and Government Decision no. 230/2003<br />
(figure 1). It is classified as a protected area of IInd category according to IUCN, and its main<br />
purpose is to protect ecosystems, and recreation.<br />
Figure 1. Geographic position of the Călimani Mountains in Romania
174<br />
Ioan BÂCA<br />
The main points of interest in the park are the Scientific Reserve of Juniper trees with<br />
Pinus cembra - IUCN category Ia, with an area of 384.2 ha, the Iezer Lake Reserve - Category IV<br />
of IUCN, with an area of 322 ha, and he Geologic Reserve 12 Apostles, category IV of IUCN,<br />
with an area of 200 ha.<br />
12 Apostles Geologic Reserve is located in the north-eastern part of Călimani National Park, on<br />
the northwest bor<strong>de</strong>r of the Călimani cal<strong>de</strong>ra (the segment Tămău – Pietrele Roşii – 12 Apostoli –<br />
Lucaciu – Cerbu), at an altitu<strong>de</strong> of 1770 m in an area of maximum visibility, which dominates the<br />
valleys of Negrişoara (Little Black) and Neagra (Black River), tributary to the Dorna river (figure 2).<br />
Figure 2.The location of the 12 Apostles geomorphiste in the Călimani National Park<br />
GEOMORPHOLOGICAL FEATURES<br />
The 12 Apostles geomorphosite consists of several residual rock formations, <strong>de</strong>tached by<br />
differential erosion from the mass of volcanic agglomerates which form the bor<strong>de</strong>r of Călimani<br />
cal<strong>de</strong>ra. This cal<strong>de</strong>ra was formed by the collapse of few stratovolcanos which existed here in the<br />
Pliocene, and who have built around their a huge volcano-sedimentary plateau which extends<br />
between The Gorge of BistriŃa Ar<strong>de</strong>leană and Dornelor Depression to the North, Drăgoiasa-Bilbor-<br />
Secu <strong>de</strong>pressions to East, Mureşului Valley to South, Şieului Valley and BistriŃa Ar<strong>de</strong>leană Valley<br />
to West (Naum, Butnaru, 1989; Geografia României, 1987). The edifice of cal<strong>de</strong>ra is distinguished<br />
by very large in size, having a diameter of 10 km and a <strong>de</strong>pth of 500-800 m, which ranked first in<br />
the arc of the Oriental Carpathians Neogene eruptive arch. The bor<strong>de</strong>r of cal<strong>de</strong>ra is maintained<br />
between 1700 m and 2000 m, culminating in the Pietrosu Peak (2100 m), and North-eastern part of<br />
it was pierced by the Neagra Şarului River.<br />
The volcanic activity was particularly complex in this sector and manifested in explosive,<br />
efuzive and intrusive forms, thereby generating specific products: piroclastic flows, an<strong>de</strong>sitic an<br />
dacitic lava flows and an<strong>de</strong>sitic and dioritic intrusive bodies.<br />
Emptying the magmatic reservoir in late pliocene and the intensity of terminal eruptions<br />
caused the collapse of the system of joint cones and shaping the cal<strong>de</strong>ra, which was mo<strong>de</strong>la<strong>de</strong> by<br />
fluvial, glacial and periglacial processes in the following period.
Contribution to Inventory and Assessement of the Geomorphosites… 175<br />
Therefore, the <strong>de</strong>tailed morphology of the cal<strong>de</strong>ra is distinguished by systems of valleys<br />
and ridges, secondary volcanic craters (Pârâul Calului, Iezerul Călimanului, RăŃiŃiş, Pietricelu),<br />
intrusive massifs (Negoiu Românesc), glacial cirques (Pietrosu, ReŃiŃiş, Bradu Ciont, Negoiu<br />
Unguresc), crionival semifunnels and residual forms carved on volcanic agglomerates (needles,<br />
towers, pillars, apostles, walls, etc.) (figure 3).<br />
Figure 3.Geomorphologic sketch of Călimani cal<strong>de</strong>ra<br />
1-the bor<strong>de</strong>r of cal<strong>de</strong>ra; 2-structural surfaces; 3-structural ridge; 4-glacial cirques; 5-crionival semifunnel; 6-<br />
catchement area; 7-ridge; 8-fluvial slopes; 9-rivers; 10-village; 11-12 Apostles geomorphosite<br />
The rock formations of 12 Apostles geosite have heights from 3 to 12 m, phytomorphic<br />
(mushrooms), zoomorphic (lizards, dragons), anthropomorphic (apostles, characters) and amorphic<br />
physiognomies, allowing their separation into three megalithic sectors (figure 4):<br />
1) Lucaciu sector, with scattered rock formations around Lucaciu peak (1770 m);<br />
2) 12 Apostles sector, with residual formations distributed around the Munceilor peak (1775 m);<br />
3) Piciorul Hârlei sector, with scattered rocks on the southeast flank of the cal<strong>de</strong>ra, in the<br />
Neagra Şarului Valley.<br />
In terms of physiognomy and aesthetic features, the formations with zoo- and<br />
anthropomorphic look received suggestive names, which gives personality to the geomorphosite<br />
and a high <strong>de</strong>gree of attractiveness (Naum and Butnaru, 1989). Thus, in the Lucaciu sector there is<br />
a rock formation named Green Lizard, while in the 12 Apostles sector, following groups can be<br />
separated (figure 5):<br />
- the group Moşul (Old Man) and Mucenicul (The Martyr);<br />
- the central group, with the most representative rocky formations (Ramses, Godzila, Nefertiti,<br />
The Marshal, The Camel);<br />
- the group Ursoaica cu puii (Mother Bear with Bear Cubs);<br />
- the group Străjerul (The Watchman).<br />
A <strong>de</strong>tailed analysis of these rock formations highlights a number of relevant<br />
geomorphological features on attractive and evolutionary levels.<br />
Thus, there are isolated rocks and groups of rock cliffs, bor<strong>de</strong>red by slopes, with niches, steps<br />
and shelves carved on its faca<strong>de</strong>, and talus at their base, resulted through the processes of fragmentation<br />
and removal of the wall rock. The rocks of the Central Group of 12 Apostles sector are sometimes<br />
separated by narrow passages (crevice), which gives a spectacular configuration to the geomorphosite.
176<br />
Ioan BÂCA<br />
Figure 4. The localisation of The 12 Apostles geomorphosite on the Călimani cal<strong>de</strong>ra and the<br />
geomorphologic map<br />
1-residual ridge; 2-fluvial slopes; 3-peaks; 4-rocky formations; 5-rivers; 6-rural settlements; 7-the area of the<br />
geomorphosite<br />
Figure 5. The areal distribution of the rocky formations from the 12 Apostles geomorphosite
Contribution to Inventory and Assessement of the Geomorphosites… 177<br />
CULTURAL CONNOTATIONS<br />
In addition to their suggestive physiognomy, the rock formations from 12 Apostles<br />
geomorphosite have an important cultural dimension, with mythical and historical background,<br />
specific also for a number of geomorphosites in the Romanian Carpathians (Brill, 1974; Sârbu,<br />
2009). This cultural dimension of the geomorphosite is briefly <strong>de</strong>scribed by the Călimani National<br />
Park website (www.Călimani.ro) as follows:<br />
The 12 Apostles Statuary Complex and the neighbouring Lucaciu peak invoke the<br />
testimony of magic and mythic events <strong>de</strong>scen<strong>de</strong>d from ancient Dacian culture, reshaped over time<br />
in the form of Romanian Orthodox faith. Climbing mountains and ceremonial events held<br />
during the summer solstice, known in local language „Moşii <strong>de</strong> la Călimani” (The El<strong>de</strong>rs<br />
from Călimani) or „Moşii <strong>de</strong> Sânpetru” (The El<strong>de</strong>rs of Saint Peter), originate in the ancient<br />
Dacian worship of the sun, tree and fire, with the cult of ancestors as central element.<br />
The transfer from the solstice-celebrating Dacian tradition to the Christian Orthodox Rite<br />
gave rise to the celebration of the 12 Apostles, which had got in time a strong patriotic overlay,<br />
becoming The Ne<strong>de</strong>ia from Călimani (The Celebration from Călimani). During the celebration of<br />
the 12 Apostles on June 29, a lot of people from surrounding areas follow established trails to<br />
Lucaciu peak, to attend the great meeting. The sacred fire, which first separated crowd from<br />
divinity at evening hours, now purifies the offerings for the souls of those passed away. The<br />
stories were born, song and dance accompanied the Romanians separated by the peaks of<br />
Călimani Mountains, but united by faith, language and nation.<br />
Historical and geographical context caused a distinct evolution of the people around the<br />
Călimani, as they lived separated from one point in time at the bor<strong>de</strong>r of three provinces: Ar<strong>de</strong>al,<br />
Bucovina and Moldova. In such circumstances, the celebrations from 12 Apostles and Lucaciu<br />
appear as real moments of struggle for national unity. It seems that the last celebration took place<br />
un<strong>de</strong>r a condition of unbearable restrictions imposed by occupation authorities in 1914.<br />
Historian Nicolae Densuşianu (2002) constructed the hypothesis that these megalithic figures<br />
from Călimani and the whole area of the Carpathians would be the work of ancient Pelasgians, and that<br />
they would have been ma<strong>de</strong> in honour of some <strong>de</strong>ities (The Sphinx from Bucegi Mountains, the rocky<br />
formations from Ciucaş Mountains, etc.). Although this view seems fantastic, the intervention of<br />
ancient populations on rock formations shaped by natural processes is not to be exclu<strong>de</strong>d.<br />
Another proof of the cultural-historical value of 12 Apostles geomorphosite are the<br />
megalithic engravings discovered in 1987 on Paltin Valley, near the village of Gura Haiti, which<br />
apparently was part of a dolmen set type (Naum and Butnaru, 1989), erected by populations<br />
living here in prehistoric times. Whichever the truth, the fact that the rocky formations of the<br />
12 Apostles Geologic Reserve quicken the imagination of scientists and visitors point once<br />
again the cultural value of the geomorphosite.<br />
EVALUATION OF THE GEOMORPHOSITE<br />
After establishing the theoretical and methodological framework, a <strong>de</strong>tailed field research<br />
has been un<strong>de</strong>rtaken, during which various geomorphologic features were charted, such as the<br />
configuration of rocky formations, present-day geomorphological processes, the impact of human<br />
intervention on the relief etc. The final step consisted in creating the evaluation sheets for the<br />
geomorphosite, <strong>de</strong>fining the inventory and evaluation of the scientific, ecological, aesthetical,<br />
cultural and economic dimensions of the geosite, basing on relevant criteria. For each criterion, a<br />
score between 0 and 1 was appointed, with steps of one quarter of a point, resp. 0 = nothing,<br />
0.25 = low, 0.50 = high and 1.00 = very high. After each criterion was noted, the global value<br />
was calculated by summing the points and dividing the result to the total number of criteria.<br />
Due to the scientific and cultural importance of the 12 Apostles geomorphosite, a complex<br />
evaluation has been implemented, basing on an inventory file suggested by Reynard (2006), with<br />
necessary adaptations. The results of this process are represented in the tables 1 to 6.
178<br />
Ioan BÂCA<br />
Table 1. Scientific value of the 12 Apostles geomorphosite<br />
(Data source: after Reynard, 2006, whit adaptations)<br />
Criteria Evaluation Score<br />
Integrity<br />
Anthropogenic activities un<strong>de</strong>rtaken in this area (<strong>de</strong>forestation,<br />
grazing, tourism) have not particularly affected the integrity of 0.75<br />
the megalithic complex<br />
Representativeness<br />
12 Apostles Geological Reserve is representative for the<br />
Călimani National Park<br />
1.00<br />
Uniqueness<br />
By position, structure and configuration, the 12 Apostles<br />
geomorphosite is unique within the Călimani Mountains<br />
1.00<br />
Paleogeographic value<br />
The area of the 12 Apostles geomorphosite is a geological<br />
sequence of space-time mo<strong>de</strong>lling of the Călimani cal<strong>de</strong>ra<br />
1.00<br />
The geomorphosite provi<strong>de</strong>s information about residual<br />
Educational value landscape shaped by differential erosion processes on volcanic<br />
conglomerates<br />
1.00<br />
Scientific value<br />
By geological structure and geomorphological features, the 12<br />
Apostles Geologic Reserve is an scientifically important<br />
objective<br />
0.95<br />
Table 2. Ecologic value of the 12 Apostles geomorphosite<br />
(Data source: after Reynard, 2006, with adaptations)<br />
Criteria Evaluation Score<br />
Ecological influence<br />
With its features, the 12 Apostles geomorphosite support the<br />
<strong>de</strong>velopment of specific ecosystems (rocky, grassland, forest)<br />
1.00<br />
Vulnerability<br />
Tourist flows and camping activities could affect the<br />
ecosystems<br />
0.50<br />
Ecological value<br />
12 Apostles geomorphosite provi<strong>de</strong>s natural support for the<br />
<strong>de</strong>velopment of specific ecosystems in coniferous forests of<br />
the mountain<br />
0.75<br />
Table 3. Aesthetic value of the 12 Apostles geomorphosite<br />
(Data source: after Reynard, 2006, with adaptations)<br />
Criteria Evaluation Score<br />
Visibility<br />
The geomorphosite is visible from great distances and<br />
provi<strong>de</strong>s maximum visibility over the surrounding landscape<br />
1.00<br />
The rocky formations are distributed in 6 groups, with heights<br />
Contrast, vertical<br />
of 3-12 m; the show anthropogenic-zoo-phytomorphic forms,<br />
<strong>de</strong>velopment and<br />
and by their altimetric position they are arranged on three<br />
space structuring<br />
levels<br />
1.00<br />
Cromatic diversity<br />
Alternation of grey rocks with green open meadows and dark<br />
green of the coniferous forests<br />
0.75<br />
Aesthetic value<br />
Through the configuration of its rocky formations, the 12<br />
Apostles geomorphosite is characterised by a high aesthetic<br />
level<br />
0.91<br />
Table 4. Cultural value of the 12 Apostles geomorphosite<br />
(Data source: after Reynard, 2006, with adaptations)<br />
Criteria Evaluation Score<br />
Religious and<br />
symbolic<br />
importance<br />
Mythical and magical ceremony events related to the Dacian<br />
population rites about the summer solstice to worship the sun,<br />
the trees and the fire.<br />
Christian holidays during summer solstice, such as Călimani<br />
Sânpetru celebration, Ne<strong>de</strong>ia of Călimani,<br />
Moşii din Călimani, Moşii <strong>de</strong> Sânpetru, Ne<strong>de</strong>ia din Călimani.<br />
Near the geomorphosite lies the 12 Apostles hermitage<br />
1.00
Contribution to Inventory and Assessement of the Geomorphosites… 179<br />
Historical<br />
importance<br />
Literary and<br />
artistic importance<br />
Cultural value<br />
Habsburg Empire bor<strong>de</strong>r.<br />
On the 12 Apostles-Lucaciu ridge, fortifications of World War<br />
I-II (trenches) are preserved<br />
The Rocky formations of 12 Apostles geomorphosite are<br />
mentioned in many works of belletrist tourism, as well as on<br />
travel websites<br />
By its position, structure and configuration, the 12 Apostles<br />
geomorphiste was since ancient times a place of worship and<br />
pilgrimage and a source of inspiration for various literarytourism<br />
works<br />
0.75<br />
1.00<br />
0.91<br />
Table 5. Economic value of the 12 Apostles geomorphosite<br />
(Data Source: after Reynard, 2006, with adaptations)<br />
Criteria Evaluation Score<br />
Accessibility<br />
Forest roads and marked tourist trails from Poiana<br />
Negrii, Neagra Şarului and Gura Haitii<br />
0.75<br />
Present recovery The 12 Apostles Geological Reserve is a major<br />
and attractive objective from the<br />
geomorphological Călimani National Park integrated in tourism circuits of<br />
1.00<br />
interest this area<br />
Present recovery<br />
and cultural and<br />
historical interest<br />
Legal protection<br />
and utilization<br />
restrictions<br />
Equipment and<br />
services<br />
Economic value<br />
Place of pilgrimage during the celebration, on June 29,<br />
of the 12 Apostles Convent<br />
1.00<br />
Protected area, IV-th category IUCN 1.00<br />
There are no tourist facilities in this area.<br />
Accommodation can be arranged at the 12 Apostles<br />
Hermitage and in traditional farms in the surrounding<br />
villages<br />
The geomorphosite 12 Apostles is an important tourist<br />
attraction, but economically not sufficiently utilised<br />
0.25<br />
0.8<br />
Global value<br />
Potential threats<br />
Management<br />
measures<br />
Table 6. Synthesis<br />
The 12 Apostles Geologic Reserve represent an important attractive objective in<br />
the Călimani National Park, supporting various tourist activities (trekking, hiking,<br />
biking, ecotourism, cultural and educational tourism)<br />
Climbing activities can affect the rock formations and gully erosion processes may<br />
cause gully erosion on tourist trails<br />
It requires a strategy of access, placement of public signposts, resting places and<br />
scenic points and the <strong>de</strong>velopment of promotional materials<br />
CONCLUSIONS<br />
The 12 Apostles Geologic Reserve is an area-type geomorphosite, which, in addition to<br />
the scientific dimension, is characterized by significant aesthetic, cultural and historical<br />
connotations, enhancing its tourism attractiveness.<br />
The global value of the geomorphosite, obtained by adding other values<br />
(Sci+Eco+Sce+Cult+Econ/5), is high, and indicates its importance within the Călimani<br />
National Park, situation requiring protective measures and appropriate strategies for tourism<br />
utilisation (table 7).
180<br />
Ioan BÂCA<br />
Scientific<br />
value<br />
Ecological<br />
value<br />
Table 7. Global value of the 12 Apostles geomorphosite<br />
Scenic value<br />
Cultural value<br />
Economic<br />
value<br />
Global<br />
value<br />
0.95 0.75 0.91 0.91 0.8 0.864<br />
ACKNOWLEDGEMENTS<br />
The present work represents a part of the research results processed in or<strong>de</strong>r to inventory<br />
and evaluate the geomorphosites within the Călimani Natural Park and to elaborate the visiting<br />
strategy for this site, initiated by the Faculty of Tourism Geography from BistriŃa.<br />
The author acknowledge to anonymous reviewer for their thoughtful suggestions and comments.<br />
REFERENCES<br />
Bâca I. (2011), Contribution to inventory and assessments of the geomorphosites from Călimani National Park. Case<br />
study: Bistricior massif, Analele UniversităŃii din Ora<strong>de</strong>a, Seria Geografie, XXI, 1;<br />
Bâca I., Schuster E. (2011), Listing, evaluation and touristic utilisation of geosites containing archaeological artefacts.<br />
Case study: Ciceu Ridge (Bistrita-Nasaud County, Romania), Revista Geografica Acadêmica, v.5, n.1, pp.5-20;<br />
Brill T. (1974), Legen<strong>de</strong> geografice româneşti, Ed. Pentru Turism, Bucureşti, p.175;<br />
Comănescu L., Ne<strong>de</strong>lea Al., Dobre R. (2009), Inventoring and evaluation of geomorphosites in the Bucegi Mountains,<br />
Studii şi cercetări <strong>de</strong> geografie şi protecŃia mediului, 8, pp.38-43;<br />
Comănescu L., Dobre R. (2009), Inventorying, evaluating and tourism valuating the geomorphosites from the central sector of<br />
The Ceahlău National Park, GeoJournal of Tourism and Geosites, Year II, No.1, Vol.3, pp.86-96;<br />
Comănescu L., Ne<strong>de</strong>lea Al. (2010), Analysis of some representative geomorphosites în the Bucegi Mountains:between<br />
scientific evaluation and tourist perception, Area, Vol. 42 No. 4, pp. 406–416;<br />
Densuşianu, N., (2002), Dacia preistorică, Ed. Arhetip, Bucureşti, p.95<br />
Ilieş D., Josan N. (2010), Geomorfosituri şi geopeisaje, Editura UniversităŃii din Ora<strong>de</strong>a;<br />
Marthaler M. (2003), Le memoire <strong>de</strong> la Terre cache <strong>de</strong>rriere les panoramas, Geomorphologie et tourism, Lausanne;<br />
Naum T., Butnaru E. (1969), Căliman-Bârgău. Călăuza turistului, Editura Consiliului NaŃional pentru EducaŃie Fizică şi<br />
Sport, Bucureşti;<br />
Naum T. (1970), Complexul <strong>de</strong> mo<strong>de</strong>lare nivo-glaciar din MunŃii Călimani, Analele UniversităŃii Bucureşti, Geografie,<br />
anul XIX, pp.67-75;<br />
Naum T. (1974), EvoluŃia geomorfologică a masivului vulcanic Căliman în Pliocen şi Cuaternar, în „Buletinul ŞtiinŃific”,<br />
seria B, Insitutul Pedagogic din Baia Mare, pp.42-76;<br />
Naum T., Butnaru E. (1989), MunŃii Călimani, Ed. Sport-Turism, Bucureşti;<br />
Panizza M., Piacente S. (1993), Geomorphological assets evaluation, Z.Geomorph. N. F., Suppl.-Bd. 87, pp. 13-18;<br />
Panizza M., Piacente S. (2003), Geomorfologia Culturale, Pitagora Editrice, Bologna;<br />
Panizza M. (2001), Geomorphosites: Concepts, methods and examples of geomorphological survey, in Chinese Science<br />
Bulletin, 46, pp. 4-6;<br />
Pralong J. P. (2005), A method for assessing tourist potential and use of geomorphological sites, Géomorphologie: relief,<br />
processus, environnement, 3, pp. 189-196;<br />
Pralong J. P., Reynard E. (2005), A proposal for the classification of geomorphological sites <strong>de</strong>pending on their tourist<br />
value, Il Quaternario, 18 (1), pp. 315-321;<br />
Reynard E. (2005), Gemorphosites et paysages, Gemorphologie: Relief, Processus, Environnement;<br />
Reynard E., Panizza M. (2005), Geomorphosites: <strong>de</strong>finition, assessment and mapping. An introduction, Géomorphologie :<br />
relief, processus, environnement, nr. 3, pp. 177-180;<br />
Reynard E. (2006), Fiche d’inventaire <strong>de</strong>s géomorphosites, Université <strong>de</strong> Lausanne, Institut <strong>de</strong> géographie, apport non<br />
publié, 8 pages. – http://www.unil.ch/igul/page17893.html;<br />
Reynard E., Coratza P., Regolini-Bissig Geraldine (2009a), Geomorphosites, Verlag Dr. Friedrich Pfeil Munchen, p. 240;<br />
Reynard E., Regolini-Bissig Geraldine, Kozlik L., Bene<strong>de</strong>tti S. (2009b), Assessment and promotion of cultural<br />
geomorphosites in the Trient Valley (Switzerland), Valutazione e promozione di geomorfositi culturali nella Valle<br />
<strong>de</strong>l Trient (Svizzera), Mem. Descr. Carta Geol. d’It., LXXXVII, pp. 181-189;<br />
Sârbu A. M. (2009), Legen<strong>de</strong> geografice, Editura AIUS, Bucuresti, p.80;<br />
Submitted: Revised: Accepted and published online<br />
August 04, 2011 November 02, 2011 November 30, 2011
Analele UniversităŃii din Ora<strong>de</strong>a – Seria Geografie Year XXI, no. 2/2011 (December), pp. 181-191<br />
ISSN 1454-2749, E-ISSN 2065-1619 Article no. 212103-528<br />
PERSPECTIVES IN THE ANALYSIS OF THE TERRACES OF THE<br />
DANUBE WITHIN THE OLTENIA PLAIN (ROMANIA)<br />
Sandu BOENGIU ∗<br />
University of Craiova, Geography Department,<br />
Al. I. Cuza No 13, Craiova, Romania, e-mail: sboengiu@central.ucv.ro<br />
Sorin AVRAM<br />
University of Craiova, Geography Department,<br />
Al. I. Cuza No 13, Craiova, Romania, e-mail: asorin@clicknet.ro<br />
Alina VLĂDUł<br />
University of Craiova, Geography Department,<br />
Al. I. Cuza No 13, Craiova, Romania, e-mail: vladut_alina@yahoo.com<br />
Abstract: The present paper aims at ren<strong>de</strong>ring the evolution of the morphologic, climatic, and<br />
hydrographical events registered starting with the end of the Romanian till the Holocene. All the<br />
aforementioned events led to the formation of the terraces of the Danube along the sector Gura<br />
Văii - the mouth of the Olt River. By the end of the Romanian, within the Oltenia Plain, the<br />
continental phase that brought to the formation of the present landforms began. The<br />
<strong>de</strong>velopment of the terrace plain occurred on the background of the <strong>de</strong>terioration of the<br />
piedmont structure that was located along the Carpathian-Balkan curvature. The start of the<br />
<strong>de</strong>struction of the piedmont structure coinci<strong>de</strong>s with the formation of the Danube course and the<br />
<strong>de</strong>velopment of its hydrographical system. The erosion of the piedmont structures and the<br />
<strong>de</strong>velopment of a terrace plain functioning as a <strong>de</strong>pression occurred on the background of the<br />
Pleistocene climatic oscillations, of the rightward <strong>de</strong>viation of the Danube, and of the lowering<br />
of the base level. Thus, it appeared the Danube Valley the width of which reached even 48 km<br />
and the <strong>de</strong>pth 180 m, with a terrace system that corresponds to the main palaeogeographic<br />
coordinates. All these analysed events and transformations that are ren<strong>de</strong>red by means of GIS<br />
lead to the reconstruction of the formation stages and allow a synchronization of the<br />
morphologic, climatic, and hydrographic stages.<br />
Key words: Terraces, GIS, Oltenia Plain<br />
* * * * * *<br />
INTRODUCTION<br />
The South of Romania is crossed by the Danube River. The paleogeographic evolution led to<br />
the <strong>de</strong>velopment of a wi<strong>de</strong> plain on the left of the river, called the Romanian Plain or the Lower<br />
Danube Plain. There can be noticed the following genetic types of plains - piedmont plains,<br />
subsi<strong>de</strong>nce plains, terrace plains, and tabular plains, which are generally distributed on longitudinal<br />
alignments. The western si<strong>de</strong>, starting with the area where the Danube River flows out of the Defile,<br />
at the Iron Gates up to the Olt River, is called the Oltenia Plain (figure 1). It presents 75% terrace<br />
∗ Corresponding Author<br />
http://istgeorelint.uora<strong>de</strong>a.ro/Reviste/Anale/anale.htm
182<br />
Sandu BOENGIU, Sorin AVRAM, Alina VLĂDUȚ<br />
plains (Geografia României, 2005) and only 25% of its surface was not mo<strong>de</strong>lled by the river still<br />
displaying the features of the piedmont plain (Leu - Rotunda and Drănic - SălcuŃa Fields).<br />
Figure 1. The hypsometrical map of the Oltenia plain<br />
The Oltenia terrace plain is an erosion and accumulation <strong>de</strong>pression, entirely <strong>de</strong>veloped un<strong>de</strong>r<br />
the action of the Danube, the southern limit following its lowest part (Boengiu, 2000). The erosion of<br />
the piedmont structures and the formation of a terrace plain that functioned as a <strong>de</strong>pression occurred on<br />
the background of the Pleistocene climatic oscillations, of the rightward <strong>de</strong>viation of the Danube, and of<br />
the lowering of the base level. Thus, presently, in Oltenia, it was proven the presence of eight<br />
discontinuously <strong>de</strong>veloped terraces (Geografia Văii Dunării Româneşti, 1969) (figure 2). Yellowishreddish<br />
loess and loess-like <strong>de</strong>posits cover the upper terraces, while the lower terraces and the<br />
floodplains present sands and dunes.<br />
The analysis of the position of the Danube terraces within Oltenia, their link to the terraces<br />
of the Jiu and the Olt rivers, ma<strong>de</strong> by many researchers brings us to the conclusion that the<br />
evolution of this river is, at least to a certain extend, <strong>de</strong>termined not only by the neotectonic<br />
movements (which imposed the <strong>de</strong>velopment of the terraces only on the left of the Jiu River and<br />
on the right of the Olt River), but also by the Quaternary eustatic modifications, induced by the<br />
succession of many glacial and interglacial stages.<br />
The rising from Leu - Rotunda is due to the Passa<strong>de</strong>na neotectonic phase, when ‘the Riss-<br />
Wurm red clays located within Schiau anticline indicate a folding during the Middle Pleistocene’<br />
(Saulea, 1967), phase that has to be taken into account in the analysis of the terraces of the<br />
Danube, which can be correlated with the terraces of the Olt and of the Jiu rivers.<br />
The Romanian research in the field continues to use the Alpine chronology (that referring to<br />
glaciations) in or<strong>de</strong>r to correlate the age of the terraces. The relative altitu<strong>de</strong> of terraces, the characteristics<br />
of the sediments, and the age of fossils (paleonthological method) still represent the main methods for<br />
terrace dating. Absolute dating, based on paleomagnetic data, Th/U or luminescence dating, were used for<br />
establishing the age of the terraces of the Danube in Hungary (Pécsi, 1973, 1959).
Perspectives in the Analysis of the Danube Within the Oltenia Plain (Romania) 183<br />
Figure 2. Map of the Danube terraces within the Oltenia Plain<br />
(Source: after Geografia Văii Dunării Româneşti, 1969)
184<br />
Sandu BOENGIU, Sorin AVRAM, Alina VLĂDUȚ<br />
The dating of the terraces located within Wien basin was achieved according to the<br />
thickness of sediments, namely the <strong>de</strong>pth of the lower horizon and the height of the terrace tops.<br />
From the granulometric point of view, ol<strong>de</strong>r <strong>de</strong>posits are finer than the younger ones, which<br />
display larger dimensions of the sediments (Pflei<strong>de</strong>rer, 2008). The features of each terrace have<br />
also been analysed according to the local trend of geomorphologic mo<strong>de</strong>lling conditioned of not<br />
by tectonic faults, as well as by the base level.<br />
In Vojvodina region, Serbia, in the sector Vukovar-Belgra<strong>de</strong>, sediments dating based on<br />
magnetic susceptibility (MS), which was also correlated with the stratigraphy of the marine isotope<br />
(Markovic et al, 2009). The thickness of the analysed <strong>de</strong>posits generally reached 40 m and there was<br />
noticed low concentration of magnetic minerals in loess and high concentration in paleosols. The<br />
interpretation by means of rubification in<strong>de</strong>x and rock magnetic record of these data allowed the<br />
reconstruction of the paleoclimatic fluctuations during five glacial and interglacial cycles.<br />
The literature abunds in recent studies about the climatic and tectonic control for the formation<br />
of terraces, sediments analysis as well as dating of terrace or adjacent <strong>de</strong>posits (Gibbard, 2004;<br />
Ruszkiczay-Rüdiger, 2005; Jakab, 2007; Bridgland, 2007, 2008; Gábrisa, 2007; Buggle, 2009).<br />
DATA AND METHODS<br />
Starting from the evolution of the valleys <strong>de</strong>veloped in sedimentary <strong>de</strong>posits due to the<br />
rapid lowering of the base level, we used quantitative data, as well as verifications for the terraces<br />
<strong>de</strong>veloped on the background of the Quaternary climatic oscillations in analogous cases. The<br />
premises for the GIS analysis of the Danube Valley, located between the Defile and its confluence<br />
with the Olt River, are the linear and lateral erosion of the sediments of Carpathian-Balkan origin<br />
induced by certain neotectonic movements or by the change of the base level imposed by the<br />
climatic oscillations. The geological data indicated by the boreholes ma<strong>de</strong> along the Oltenia Plain<br />
correspond to Pelletier mo<strong>de</strong>l only in the immediate proximity of the mountainous area, in all the<br />
other cases sedimentation being controlled by marine transgressions and regressions and by the<br />
alluvia discharge of the hydrographical systems from the region (Enache, 2008).<br />
Thus, the complexity of the terraces genesis <strong>de</strong>termined us to take into account many mo<strong>de</strong>ls<br />
and try to eliminate by means of analysis those mo<strong>de</strong>ls that are not a<strong>de</strong>quate in the case of the Danube.<br />
For the sector located between the Danube Defile and Corbului Islet-Stîrmina Hill, the accepted mo<strong>de</strong>l<br />
for the formation of the terraces is the one <strong>de</strong>scribed by Pelletier (Pelletier, 2008). These terraces are<br />
induced by the alternance of the sedimentation - drainage process, which means that when the alluvial<br />
fan is un<strong>de</strong>r formation, the drainage is not concentrated, while during the periods characterized by<br />
climatic cooling and lowering of the base level, the flow is concentrated along certain channels<br />
(increase of the bottom erosion). Thus, it results lateral alluvia are no longer directly influenced by<br />
drainage becoming terraces; the process repeated as the base level oscillated. The channeling of the<br />
river along a single bed functioned as a local base level for the hydrographical systems installed on the<br />
newly formed terrace. Along the sector between Stîrmina and the confluence of the river with the Olt<br />
River, from Pelletier mo<strong>de</strong>l, we must take into account only the relation between the slow flow,<br />
characterized by very wi<strong>de</strong> mean<strong>de</strong>rs during warm periods when the base level raised, and the intensive<br />
bottom erosion registered during climatic cooling periods when the base level <strong>de</strong>creased.<br />
The used satellite images are taken by Landsat 7, NASA for the Balkan region. We also<br />
used orthophotoplans at the scale 1:5,000 for the regions where the limits are not characterized by<br />
large variations of level. Thus, the first stage of the research was the georeferenciacion of the<br />
satellite images and of the aerophotograms, as well as of the lithological (scale 1:200,000),<br />
geomorphologic (Geografia Vaii Dunarii Romanesti, 1969), hydrogeological (scale 1:50,000), and<br />
topographical (scale 1:25,000) maps. The overlapping of the cartographic documents allowed the<br />
precise i<strong>de</strong>ntification of the limits between the terraces and of the eventual contradictions, which<br />
were solved by means of local altitu<strong>de</strong> <strong>de</strong>terminations and boreholes. On the base of the satellite<br />
images, we worked according to Pelletier mo<strong>de</strong>l when trying to correlate the terraces through the<br />
analysis of the torrent processes installed there and of the average altitu<strong>de</strong>, they are located at.
Perspectives in the Analysis of the Danube Within the Oltenia Plain (Romania) 185<br />
DISCUSSIONS<br />
The relation between the eustatic movements registered within the Black Sea and the<br />
glacial and interglacial stages is a starting point in the analysis of the period when the Danube<br />
River built its terraces in the south of Oltenia (Ba<strong>de</strong>a, 2000). This relation might be explained by<br />
the fact that when the eustatic level of the Black Sea raised and, of course, that of the lake located<br />
at the south of the Carpathians, due to the thawing of the glaciers and heavy rainfalls registered<br />
during the interglacial stages, the advancement of the river stopped and there occurred a more<br />
intense divagation within the floodplain (Boengiu, 2009). During the glacial stages, as the climate<br />
was dry and the surface flow diminished, there occurred an eustatic lowering of the Black Sea and<br />
of the extra-Carpathian lake, which affected the extension of the Danube’s riverbed and led to the<br />
intensification of vertical erosion. Consequently, the Danube left the former floodplain that<br />
remained as a new terrace compared the new riverbed.<br />
The classical dating of the terraces of the Danube in the studied sector ma<strong>de</strong> reference to<br />
the chronology of the Alpine glaciers. Thus, we used the correlation Global Chronostratigraphical<br />
Correlation for the last 2.7 million years, 2010, achieved by University of Cambridge, University<br />
of Utrecht, International Union for Quaternary Research (INQUA), Stratigraphy and Chronology,<br />
International Union of Geological Sciences.<br />
Starting from the hypothesis that the 8 th terrace (T 8 ) of the Danube, with a relative<br />
altitu<strong>de</strong> of 140 - 170 m, represented the first floodplain of the Danube during the Pre-Günz<br />
stage (MIS 16, 620 - 680 ka) and then it was cut during Günz glacial stage (Marković et al,<br />
2009), it results that the 7 th terrace (T 7 ) with a relative altitu<strong>de</strong> of 110 - 115 m functioned as a<br />
floodplain during Günz - Min<strong>de</strong>l interglacial stage, being cut in Min<strong>de</strong>l stage (MIS 13 - 15, ka<br />
455 - 620). Günz glacial stage occurred by the end of the Upper Pleistocene (St. Prestian); in<br />
the South of Romania, there was registered a temperate continental climate and the Black Sea<br />
was in a lacustrine stage, its shore being located eastwards of its present position (Ciauda<br />
phase). The first formed terrace generally does not present alluvia. At the beginning of the<br />
Middle Pleistocene, there occurred Günz - Min<strong>de</strong>l interglacial stage; on the background of a<br />
warm and dry climate with seasonal differences, red clays formed. The Black Sea maintained<br />
its level (Post-Ceauda phase) and the Danube wi<strong>de</strong>ned its floodplain. It followed Min<strong>de</strong>l<br />
glacial stage, when the climate got col<strong>de</strong>r, the level of the Black Sea <strong>de</strong>creased (Paleo-Euxinic<br />
phase) allowing the <strong>de</strong>epening and the formation of a new terrace.<br />
The 8 th and 7 th terraces are located only west of the Jiu River more precisely to the area<br />
were the Baboia Stream and the DesnăŃui River flow out of the piedmont (Geografia Văii<br />
Dunării Româneşti, 1969).<br />
The 6 th terrace (T 6 ), with a relative altitu<strong>de</strong> of 90 m, functioned as a floodplain during Min<strong>de</strong>l -<br />
Riss interglacial stage and <strong>de</strong>veloped during Riss glacial stage (MIS 6, ka 130 - 200). In the second part<br />
of the Middle Pleistocene, there occurred Min<strong>de</strong>l - Riss interglacial stage, when climate acquired<br />
Mediterranean aspects and the basin of the Black Sea was subject to a transgression (Uzulnar phase).<br />
Un<strong>de</strong>r these circumstances, lateral erosion exerted by the Danube increased and the river exten<strong>de</strong>d its<br />
floodplain. By the end of the Middle Pleistocene, it occurred Riss glaciation, climate got col<strong>de</strong>r and the<br />
line of the shore withdrew due to the regression registered during the Middle Euxinic period.<br />
Consequently, the Danube increased its vertical erosion.<br />
The 5 th terrace (T 5 ), with a relative altitu<strong>de</strong> of 70 - 75 m, appeared as a large floodplain<br />
during Riss-Würm interglacial stage. It formed during Würm 1 glacial stage (MIS 5e [7, 9?], ka<br />
110 - 130). The Upper Pleistocene starts with Riss - Würm interglacial stage; on the background of<br />
a temperate climate, there occurred a new transgression of the Black Sea (Karangat phase), the<br />
Danube carried huge amounts of alluvia and increased its lateral erosion. The last glacial stage,<br />
Würm 1, when the climate got periglacial, is characterized by the occurrence of a new regression<br />
registered during the Neo-Euxinic phase; the river <strong>de</strong>epened its course.<br />
The 4 th terrace (T 4 ), with a relative altitu<strong>de</strong> of 50 m, functioned as a floodplain during the<br />
warm Würm 1 - Würm 2 interglacial stage. It <strong>de</strong>veloped through the <strong>de</strong>epening of the riverbed
186<br />
Sandu BOENGIU, Sorin AVRAM, Alina VLĂDUȚ<br />
during Wurm 2 glacial stage (MIS 4 - 5 a - d, ka 40 - 110). By the middle of the Upper Pleistocene, it<br />
started the old Black Sea phase, characterized by a general transgression with slow stagnation periods<br />
(CoteŃ, 1957). During Würm 1 - Würm 2 stage, climate became temperate there occurred a<br />
transgression, and implicitly a divagation, while during Würm 2 climate became periglacial.<br />
The 6 th , the 5 th , and the 4 th terraces appear along all the sectors of the Oltenia Plain, but not<br />
after the confluence of the Danube River with the Argeş River.<br />
The 3 rd terrace (T 3 ), with a relative altitu<strong>de</strong> of 27 - 35 m, formed the Danube floodplain in Würm 2<br />
- Würm 3 interstage; it was left as the riverbed lowered during Würm 3 glacial stage (MIS 2 - 3, ka 12 -<br />
40). The 2 nd terrace (T 2 ) of 13 - 27 m and the 1 st terrace (T 1 ) of 8 - 13 m, which are wi<strong>de</strong>r and continue east<br />
of the Olt River, appeared during the post-glacial stage (MIS 1, ka present day - 12). By the end of the<br />
Upper Pleistocene, the Black Sea evolved towards the present features; the anaglacial and cataglacial<br />
stages Würm 2 - Würm 3 and Würm 3 induced slow regressions and transgressions, while during the<br />
tardiglacial and postglacial, the shoreline evolved from -35 (-80) m towards the present position.<br />
RESULTS<br />
In the case of old terraces, geomorphologic processes display an increased intensity, while<br />
in the case of very old terraces, these processes led to their total <strong>de</strong>struction; the action of erosion<br />
on terraces can be noticed in the satellite image from figure 3, where T4 appears more fragmented<br />
than T3 within Severin Depression, which comes to support this theory. As the age of the terraces<br />
<strong>de</strong>creases, from the Middle Pleistocene (T5, T4) till the Upper Pleistocene or even Holocene (T3,<br />
T2, T1), the tops of the terraces get more intact (Enciu, 2007). Using the method of relative dating<br />
of the terraces age proposed by Hsu and Pelletier, one may correlate the succession of the terraces,<br />
especially of those that are more recent, as they preserve, in most of the cases, their top intact.<br />
Surface and altitu<strong>de</strong> are the data necessary to apply the calculation formula (Pelletier, 2004):<br />
Consi<strong>de</strong>ring the solution of the data series and replacing h(x, t) = h 0 , we have in the formula:<br />
H (x, t) = extension of the <strong>de</strong>gradation of the terrace top within the surface (x) and in time (t)<br />
h o = initial surface<br />
The facility of obtaining the data necessary for the <strong>de</strong>termination of the relative age with the<br />
help of the aforementioned formula, in GIS system, is easily i<strong>de</strong>ntifiable as the measurement of the<br />
surface of the terrace tops and of the extension of the surface affected by torrents may be achieved on<br />
satellite images, orthophotoplans, as well as by local mapping with the total station (equipped with a<br />
GPS); then, the acquired data are also evaluated in the same geographic information system.<br />
Thus, through regressive erosion, the torrent fragments the scarp of the terrace and<br />
penetrate towards its top. The surface of the terrace tops in the case of the Danube along the<br />
analysed sector and the data introduced in the mo<strong>de</strong>l for kt are 40, 60, 100... 3,200 sqm, and the<br />
length of the terrace 2L = 200 m. The threshold when the extension of the torrent <strong>de</strong>termines the<br />
complete <strong>de</strong>struction of the terrace is kt≈200 sqm; thus, in the integral ∫cos x dx = sin x + C if we<br />
consi<strong>de</strong>r cos <strong>de</strong> x = <strong>de</strong>crease of the altitu<strong>de</strong> of the top/ <strong>de</strong>crease of the surface of the terrace top<br />
and sin <strong>de</strong> x = time increase, then one may notice that the height of the terrace laniary <strong>de</strong>creases in<br />
time, relation expressed by means of the integral cos x dx + sin x + C, where cosx represents the<br />
<strong>de</strong>crease of the terrace altitu<strong>de</strong> according to sin x, which represents time. Thus, in the case of T4<br />
and T3 within Severin Depression, according to the torrents installed on T4, kt presents a value of<br />
200 sqm for kt, while for T3, kt is 60 sqm. Consequently, T4 is at least twice ol<strong>de</strong>r than T3. Once kt<br />
values are established for the representative samples for each of the 8 terraces, we may achieve their<br />
correlation also by taking into account the length of the torrents according to the formula α= √kt.
Perspectives in the Analysis of the Danube Within the Oltenia Plain (Romania) 187<br />
Figure 3. Reconstruction of the terraces of the Danube within Severin Depression<br />
according to the altitu<strong>de</strong> of the terrace tops<br />
Analysing the numerical mo<strong>de</strong>l (SRTM, 90 m, from 2004), it comes out that the situation<br />
is even more complex; for example, in Severin Depression, according to the map ren<strong>de</strong>red in<br />
Geografia Vaii Dunarii Romanesti, on the left of the Topolnita River, there is located T 4, which<br />
presents an exten<strong>de</strong>d and less fragmented top, while on the right, after the local terrace of the<br />
river that crosses this <strong>de</strong>pression there appears only T 3, T4 being absent.<br />
The altitu<strong>de</strong> from the numerical mo<strong>de</strong>l (figure 4) indicates that T4 is fragmented. In this<br />
case as well, there might be some discussions-the fragmentation might have been achieved by<br />
the Danube through mean<strong>de</strong>rs and, thus, T4 would be separated to the level T3 from the river<br />
course or the fragmentation might be of later origin induced by different erosion processes. With<br />
regard to the right si<strong>de</strong> of the Topolnita River, where we should have had two terrace levels<br />
(local and T3 of the Danube), the situation ren<strong>de</strong>red by the numerical mo<strong>de</strong>l indicates that T3 is<br />
more withdrawn from the axe of the valley, due to the Topolnita River, which replaced the scarp<br />
of T3 through its local terrace (the upper level) (figure 4).<br />
As we have mentioned before, Severin Depression also rises a series of correlation<br />
problems. According to the achieved profile, it comes out that on the left of the river, besi<strong>de</strong>s T4,<br />
there also <strong>de</strong>velops a level that might be attributed to T3 (using the altitu<strong>de</strong> correlation), as the<br />
difference of altitu<strong>de</strong> between the Topolnita Flood plain and the top of the terrace that might be<br />
generated by the Danube River reaches 30 m.<br />
Of course, there cannot be exclu<strong>de</strong>d the possibility that this local terrace of the river,<br />
would have been induced by the change of the base level or climatic oscillations. Regarding the<br />
right si<strong>de</strong>, the correlation of the altitu<strong>de</strong>s with the possible T3 located on the left of the<br />
Topolnita emphasizes the fact that this is more withdrawn and that the floodplain of the<br />
Topolnita River appears at a lower level (figure 4).
188<br />
Sandu BOENGIU, Sorin AVRAM, Alina VLĂDUȚ<br />
Figure 4. Topographical profile within Severin Depression, achieved after SRTM 40 m<br />
The utilization of GIS, besi<strong>de</strong>s helping us create the mo<strong>de</strong>ls of erosion and correlation of<br />
the terraces according to the torrents installed on the terraces of the Danube, also allowed the<br />
achievement of a series of profiles within the areas that displayed certain problems with regard to<br />
the location of the limits. We also achieved transversal profiles, which, on the base of the<br />
extensions of the program ArcGis (Spatial Analyst, 3D Analyst), may ren<strong>de</strong>r the succession of the<br />
terraces or, if it is the case, their lack in the established succession. Thus, through the option of<br />
creating the graphs according to the elevation mo<strong>de</strong>l achieved by Shuttle Radar Topography<br />
Mission in 2004, the profile line was mo<strong>de</strong>lled in steps for each modification of altitu<strong>de</strong> in or<strong>de</strong>r to<br />
obtain a better correlation of the terraces (figure 5).<br />
Figure 5. Topographical profile no. 1<br />
By correlating the data obtained on the base of the profiles, satellite images, and the main<br />
cartographic product in terms of the Danube terraces (Geografia Văii Dunării Româneşti, 1969),<br />
we noticed a series of non-concordances.<br />
Thus, as we may notice from figure 5, the succession of the levels in the analysed sector is<br />
T5 and, according to the aforementioned volume, there would follow T6 on the same alignment.<br />
However, the altitu<strong>de</strong> of the area indicates that there should be a terrace lower than T5 or that on<br />
T5 (from this sector) the level of the sediments (at the level of the lateral levee) is much higher<br />
than on T6 or that there appears a series of dunes.<br />
The west-east succession of the terraces is ren<strong>de</strong>red in figure 6, which present an erosion<br />
outlier (T5) that has on its both si<strong>de</strong>s T4; it is thus obvious that the mean<strong>de</strong>rs of the river ero<strong>de</strong>d<br />
the material and the continuity of T5 was no longer preserved.<br />
Figure 7 ren<strong>de</strong>rs a new succession of the Danube terraces within a perimeter of the Oltenia<br />
Plain where the floodplain <strong>de</strong>stroyed T1; T2 remained due to the aeolian sediments carried in the<br />
area. T3 and T4 are reduced and fragmented by the hydrographical system installed on subsequent<br />
valleys (Boengiu, S., 2000). Within this sector, T7 appears for the last time on the Danube Valley,<br />
at the contact with the northern piedmont region (Stroe, 2003).
Perspectives in the Analysis of the Danube Within the Oltenia Plain (Romania) 189<br />
Figure 6. Topographical profile no. 2<br />
The creation of the digital product DEM, using ArcGis 9.2 on the base of the topographical<br />
maps and GPS surveys, allowed us a better <strong>de</strong>termination of the elevation that helped us correlate<br />
the terraces according to the relative and absolute altitu<strong>de</strong>s of the terrace tops. DEM-s also enabled<br />
us to analyse these terraces from the morphologic point of view as, according to the sedimentary<br />
<strong>de</strong>posits, it resulted that certain terraces present a higher altitu<strong>de</strong> mainly due to the eolian <strong>de</strong>posits,<br />
which formed after their initial <strong>de</strong>velopment.<br />
Figure 7. Topographical profile no. 3<br />
The interpolation between the altitu<strong>de</strong> (altitu<strong>de</strong>s <strong>de</strong>termined by means of GPS) and the<br />
piezometric level (the hydrogeological maps 1:50,000) DEM-s allowed us to locate the contact<br />
area between two successive terraces. In this contact area, in most of the cases, there also appear<br />
springs, the presence of which was also certified in the field. We mention that the GPS<br />
measurement were achieved by means of a NAUTIZ X7 <strong>de</strong>vice, which supplies values in real time<br />
and has an error of 2 - 3 cm both on vertical and horizontal directions. The measurements were<br />
ma<strong>de</strong> in WGS84 projection system and then the values were transformed such that they matched<br />
the projection system Stereografic 70, as the Romanian maps are achieved in this last system.<br />
On the base of the correlation between the phreatic level and the altitu<strong>de</strong>s/<strong>de</strong>pths they are<br />
located at, numerical mo<strong>de</strong>ling (figure 8) allows us notice that, in most of the cases, the discontinuity of<br />
the morphologic slope and sometimes even of the phreatic aquifers at the limit between terrace levels<br />
and, on certain sectors, between terraces and floodplains, is induced by the presence of some<br />
impermeable layers below the aquifers, which are former erosion levels of the Danube (Ba<strong>de</strong>a, 2000).<br />
Thus, the isopieses map, as equipotentials of the piezometric surface, expresses the morphology of a<br />
phreatic horizon and indicate the slope and the flow direction emphasizing the level of the impermeable<br />
layer, the flow altitu<strong>de</strong> at the moment when the respective terrace <strong>de</strong>veloped.<br />
The results obtained for the interpretation of the chronology of terraces on the base of the<br />
geomorphologic, lithological, and pedological aspects may be further used in case there are no<br />
possibilities of absolute dating. There are some problems that may appear when using traditional<br />
methods, as Ruszkiczay-Rudiger et al. observed (Ruszkiczay-Rudiger et al, 2005). The <strong>de</strong>epening<br />
of the longitudinal profile may be induced by a continuous tectonic rising or / and the influence of
190<br />
Sandu BOENGIU, Sorin AVRAM, Alina VLĂDUȚ<br />
the climatic fluctuations upon rainfall amounts and sedimentation rate. The <strong>de</strong>positing of<br />
sediments may be consi<strong>de</strong>red a consequence of the increase of the solid flow or of the <strong>de</strong>crease of<br />
the flow speed (Burbank and An<strong>de</strong>rson, 2001). The <strong>de</strong>terioration of the terraces due to mean<strong>de</strong>r<br />
formation / lateral erosion make the <strong>de</strong>termination of their age be quite imprecise if we resume<br />
only to altitu<strong>de</strong>s. The granulometry of the sedimentary <strong>de</strong>posits is not i<strong>de</strong>ntical for the same<br />
horizon and making correlations among lithostratigraphical columns is difficult.<br />
Figure 8. Mo<strong>de</strong>lling of the terraces of the Danube according to the average altitu<strong>de</strong> of the terrace tops<br />
(Source: Geografia Văii Dunării Româneşti)<br />
CONCLUSIONS<br />
By analysing the <strong>de</strong>pen<strong>de</strong>nce of the terraces of the Danube between Gura Vaii and the Olt<br />
River, it results a good correlation between climatic oscillations and the formation of the respective<br />
terraces, if we admit that, during the interglacial stages the river got slower, formed mean<strong>de</strong>rs within<br />
a large floodplain (Pleniceanu and Boengiu, 2001), while during the glacial stages, due to the severe<br />
reduction of the surface flow and of the base level, vertical erosion intensified and the riverbed<br />
<strong>de</strong>epened. The main i<strong>de</strong>a resulting from the studies achieved at international level is that the number<br />
of terraces did not exclusively conditioned by interglacial periods. There should be also taken into<br />
consi<strong>de</strong>ration the oscillations of the base level and neotectonic movements.<br />
Through the digitization of the map published in Geografia Vaii Dunarii Romanesti we<br />
could start the reconstruction of the genesis of the terraces by correlating this cartographic product<br />
with the other mo<strong>de</strong>ls and interpolations in or<strong>de</strong>r to obtain the most accurate product possible. The<br />
digitization of the map achieved in Stereo 70 projection and then the introduction of the attributes<br />
for the relative altitu<strong>de</strong> of the terrace tops allowed their block mo<strong>de</strong>lling enabling an optimal<br />
visualization of the succession of terraces. The evaluation of the extension of torrents within the<br />
terrace tops may also be consi<strong>de</strong>red a method for estimating terrace age (we consi<strong>de</strong>r that a terrace<br />
is ol<strong>de</strong>r if the torrential valleys as more exten<strong>de</strong>d, both in terms of length and surface)<br />
The reconstruction and exact correlation according to the altitu<strong>de</strong> of the terraces could be achieved<br />
on the base of the extension Spatial Analyst and ArcScene of 3D interpolation, by means of which we<br />
were able to mo<strong>de</strong>l the terraces in 3D, as blocks. We also were able to follow the southwards withdrawal<br />
of the riverbed according to the altitu<strong>de</strong> the former riverbeds of the Danube used to be located at.
Perspectives in the Analysis of the Danube Within the Oltenia Plain (Romania) 191<br />
The cartographical and geomorphologic interpretation of the terraces of the Danube along<br />
the analysed sector allowed us to get aware of the fact that the methods used so far for dating and<br />
classifying terraces are empirical. Consequently, it is quite necessary to start using absolute dating<br />
methods, such as TH/U and luminescence, paleomagmatic dating etc.<br />
REFERENCES<br />
Ba<strong>de</strong>a L. (2000), Morfogeneza villafranchiană, Editura FundaŃiei România <strong>de</strong> Mâine, Analele UniversităŃii ,,Spiru Haret”,<br />
Seria geografie, nr. 3, Bucureşti, p. 15-18;<br />
Boengiu S. (2000), Morphostructural and morphocronological consi<strong>de</strong>rations concerning the BălăciŃa Piedmont and the BlahniŃa-<br />
DesnăŃui Plain, Analele UniversităŃii din Craiova, vol. III, Seria Geografie, Editura Universitaria, Craiova, p. 33-38;<br />
Boengiu S., Avram S. (2009), BălăciŃa piedmont. A mo<strong>de</strong>l of formation and evolution, Zeitschrift fur Geomorphologie, nr.<br />
53, Suppl.3, Berlin-Stuttgart, p. 85-95;<br />
Bridgland D, Westaway R. (2007), Preservation patterns of Late Cenozoic fluvial <strong>de</strong>posits and their implications: Results<br />
from IGCP 449 Quaternary International, article in press;<br />
Bridgland D, Westaway R. (2008), Climatically controlled river terrace staircases: A worldwi<strong>de</strong> Quaternary phenomenon,<br />
Geomorphology 98, p. 285-315;<br />
Buggle B, Hambach U, Glaser V, Gerasimenko N., Marković S, Glaser I., Zöller L. (2009), Stratigraphy and spatial and<br />
temporal paleoclimatic trends in Southeastern/Eastern European loess-paleosol sequences Quaternary<br />
International 196, p. 86-106;<br />
Burbank D. W., An<strong>de</strong>rson R.S, (2001), Tectonic Geomorphology, Wiley-Blackwell, London U.K;<br />
CoteŃ P. (1957), Câmpia Olteniei, Editura ȘtiinŃifică, Bucureşti, p. 35;<br />
Enache C. (2008), Geologia Olteniei, Editura Universitaria, Craiova;<br />
Enciu P. (2007), Pliocenului şi Cuaternarului din vestul Bazinului Dacic, Editura Aca<strong>de</strong>miei Române, Bucureşti;<br />
Gábrisa G, Nádor A. (2007), Long-term fluvial archives in Hungary: response of the Danube and Tisza rivers to tectonic movements<br />
and climatic changes during the Quaternary: a review and new synthesis, Quaternary Science Reviews 26, p. 2758-2782;<br />
Gibbard P., van Kolfschoten T. (2004), The Pleistocene and Holocene Epochs, Chapter 22 In Gradstein, F. M., Ogg, James G.,<br />
and Smith, A. Gilbert (eds.), A Geologic Time Scale 2004 Cambridge University Press, Cambridge, p. 441-453;<br />
Jakab S. (2007), Chrono-toposequences of soils on the river terraces in Transylvania (Romania), Catena 71, p. 406-410;<br />
Marković S.B, Hambach U, Catto N, Jovanović M, Buggle B., Machalett B, Zoller L, Glaser B, Frechen M. (2009), Middle<br />
and Late Pleistocene loess sequences at Batajnica, Vojvodina, Serbia, Quaternary International 198, p. 255-266;<br />
Pécsi, M. (1959), Formation and Geomorphology of the Danube Valley in Hungary (in Hungarian with German summary),<br />
Akadémiai Kiadó, Budapest, p. 346;<br />
Pécsi M. (1973), Geomorphological position and absolute age of the Lower Paleolithic site at Vertesszolos, Hungary,<br />
Foldrajzi Kozlemenyek, 21, p. 109-119;<br />
Pelletier J. (2008), Quantitative Mo<strong>de</strong>ling of Earth Surfaces Processes, Edit. Cambridge University Press, New York;<br />
Pflei<strong>de</strong>rer S. (2008), Geostatistical analysis of elevation and lithology of Quaternary terraces in Vienna (Austria), Austrian<br />
Journal of Earth Sciences, Volume 101, p. 81-87;<br />
Pleniceanu V., Boengiu S. (2001), Impactul activității antropice în evoluția calității apelor Jiului inferior, Institutul <strong>de</strong><br />
Geografie al Aca<strong>de</strong>miei Române, T.VII-2000, București;<br />
Ruszkiczay-Rüdiger, Fodor L, Bada G, Leé-Össy Sz, Horváth E, Dunai T.J. (2005), Quantification of Quaternary vertical<br />
movements in the central Pannonian Basin: A review of chronologic data along the Danube River, Hungary,<br />
Tectonophysics 410, p. 157-172;<br />
Saulea Emilia (1967), Geologie istorică, Editura Didactică şi Pedagogică, Bucureşti;<br />
Stroe R. (2003), Piemontul BălăciŃei. Studiu <strong>de</strong> geomorfologie, Editura MondoRo, București;<br />
*** (1969), Geografia Văii Dunării Româneşti, Editura Aca<strong>de</strong>miei Romane, Bucureşti;<br />
*** (2005), Geografia României, vol. V, Editura Aca<strong>de</strong>miei Romane, p. 141.<br />
Submitted: Revised: Accepted and published online<br />
May 23, 2011 July 27, 2011 August 22, 2011
Analele UniversităŃii din Ora<strong>de</strong>a – Seria Geografie Year XXI, no. 2/2011 (December), pp. 192-202<br />
ISSN 1454-2749, E-ISSN 2065-1619 Article no. 212104-538<br />
THE FOEHN WINDS IN NORTHERN OLTENIA.<br />
18.08.2008 CASE STUDY<br />
Anişoara IRIMESCU ∗<br />
National Meteorological Administration, Bucureşti-Ploieşti Avenue, Bucureşti, Romania,<br />
e-mail: anisoara.irimescu@meteoromania.ro<br />
Abstract: In Romania, foehn winds are short-time atmospheric phenomena of low-to-medium<br />
intensity, which do not appear always in the weather station-performed observations. Such<br />
situations require additional data to provi<strong>de</strong> a larger and dynamic picture in comparison with<br />
the punctual information sent by stations. This paper aims to capture, present and analyze the<br />
characteristic parameters of northern Oltenia foehn winds, in the Carpathian-Balkan Internal<br />
Curvature. Herein, it is shown a typical foehn situation revealed by weather stations and also<br />
by satellite images (MSG), atmospheric radio soundings and numerical mo<strong>de</strong>ling.<br />
Key words: foehn, northern Oltenia, climatic parameters, satellite images, atmospheric radio<br />
sounding, regional climatic mo<strong>de</strong>l RegCM3<br />
* * * * * *<br />
INTRODUCTION<br />
The Foehn, according to the World Meteorological Organization <strong>de</strong>finition (1992), is a<br />
wind warmed and dried by <strong>de</strong>scent, in general on the lee si<strong>de</strong> of a mountain. It can occur any time<br />
of the year, but it is seen more often in winter and spring function of local circulation. Foehn<br />
winds <strong>de</strong>pend on small-scale topographic features, although they require also a<strong>de</strong>quate conditions<br />
on a larger scale than the regions wherein they occur.<br />
The region of interest is located in South-Western Romania between the rivers Danube and<br />
Olt and the Carpathian-Balkan Internal Curvature’s orographic barrage (figure 1). In 2007,<br />
Candrea putted into the GIS environment the geographical limits using the „Geomorphological<br />
units” (scale 1:800, 000) of Posea and Ba<strong>de</strong>a, 1984.<br />
The northern Oltenia foehn is a small-scale phenomenon closely connected to the<br />
topographic features. In this regard a very fine measurement network is necessary to capture the<br />
phenomenon. In such context, METEOSAT8 (MSG) images have become a nee<strong>de</strong>d tool, given<br />
their fine temporal resolution (15 minute).<br />
Regional Climatic Mo<strong>de</strong>l RegCM3 output data for 23 altitu<strong>de</strong> levels were also used,<br />
mostly for the active surface level (similar to station-recor<strong>de</strong>d meteorological parameters) and<br />
the vertical levels related to the boundary layer and the lower troposphere (Kiehl at al., 1996;<br />
Ramanathan and Downey, 1986; Slingo, 1989; Dickinson et al., 1993; Giorgi at al., 1993).<br />
∗ Corresponding Author<br />
http://istgeorelint.uora<strong>de</strong>a.ro/Reviste/Anale/anale.htm
The Foehn Wind in Northern Oltenia. 18.09.2008 Case Study 193<br />
Unlike data recor<strong>de</strong>d at weather stations (spaced more than 50 km apart), this mo<strong>de</strong>l’s outputs<br />
build up a unique database that <strong>de</strong>scribes 3-D meteorological parameters at a much higher<br />
resolution (10 km).<br />
Figure 1. Location of the study area<br />
AVAILABLE DATA<br />
To i<strong>de</strong>ntify and characterize a foehn in the interest region a number of data types have been used:<br />
- synoptic maps;<br />
- radio sounding data;<br />
- meteosat Second Generation (MSG) images; images received every 15 minutes enable a<br />
temporal analysis of fast-<strong>de</strong>veloping meteorological events (the National Meteorological<br />
Administration archive);<br />
- regional Climatic Mo<strong>de</strong>l RegCM3 output data.<br />
Standard climatologic analyses are mostly based on punctual data recor<strong>de</strong>d by weather<br />
stations (the National Meteorological Administration archive) and inclu<strong>de</strong> such parameters as air<br />
temperature, relative humidity and precipitation.<br />
DATA ANALYSIS<br />
To mark out the north Oltenia foehn, the quality of being representative was chosen as<br />
criterion for the 18 September 2008 situation.<br />
Synoptic Analysis<br />
Before this phenomenon, on 17 September 2008, 12 UTC, the synoptic situation over<br />
Europe was characterized by the presence of an Azores anticyclone centered on the North Atlantic,<br />
ridge exten<strong>de</strong>d north-east, while East Europe was un<strong>de</strong>r the influence of the East-European
194<br />
Anişoara IRIMESCU<br />
anticyclone that <strong>de</strong>veloped westward over the Scandinavian Peninsula, wherein the Scandinavian<br />
anticyclone was present. A baric low was interposed between these anticyclones areas, over the<br />
British Isles, in relation to a second low centered west of Portugal. The Mediterranean cyclone<br />
<strong>de</strong>veloped in the Eastern Mediterranean, extending its direct influence over Romania. It moved<br />
fast eastward so that at 18 UTC it was already centered over the Eastern Black Sea region.<br />
On 18 September 2008, 00 UTC, the low centered over the British Isles disintegrated<br />
and the whole continent was un<strong>de</strong>r the dominance of an anticyclonic regime resulted from a<br />
merge between the Azores anticyclone and the East-European one. South-East Europe (the<br />
Eastern Mediterranean and Black Sea regions) was un<strong>de</strong>r the influence of the Mediterranean<br />
cyclogenesis (there were two cyclones in the Black Sea area). At 06 UTC, the North Europe<br />
anticyclonic belt exten<strong>de</strong>d southward a ridge that, in its motion along this trajectory, moved<br />
south-eastward the cold front of the cyclone centered over the Black Sea (figure 2). This<br />
situation continued over the next hours.<br />
Figure 2. Spatial distribution of air pressure (Mean Sea Level Pressure) at 18.09.2008, 06 UTC<br />
(Source: www.wetter3.<strong>de</strong>)<br />
Analyzing the satellite data information<br />
In this context, the air masses came from north in the area of interest, which is clearly<br />
shown also on satellite images. Keeping watch over the evolution and motion of cloud<br />
systems on the 17 - 18.09.2008 METEOSAT8 images, it was found out the time when these<br />
systems changed direction (17 UTC) from south-west to north. It was also noticed the clear<br />
skies area is associated with the action of cloud-dissipating foehn (figure 3). This was a very<br />
large area. The above mentioned evolution continued throughout 18.09.2008. For this analysis<br />
there were used false-color images (product 018, R=WV6.2-WV7.3; G=IR9.7-IR10.8;<br />
B=WV6.2), to facilitate i<strong>de</strong>ntification / <strong>de</strong>tection.
The Foehn Wind in Northern Oltenia. 18.09.2008 Case Study 195<br />
Figure 3. Evolution in time of cloud systems over the region of interest, 18.09.2008:<br />
a) 00:00 UTC, b) 01:00 UTC, c) 02:00 UTC, d) 03:00 UTC, e) 04:00 UTC, f) 05:00 UTC, g) 06:00 UTC, h)<br />
07:00 UTC, i) 08:00 UTC<br />
(Source: data processed after MeteoRomania Archive)<br />
Analyzing the radio soundings<br />
On 18.09.2008, 00 UTC, this sounding revealed the presence of a col<strong>de</strong>r sector and lower<br />
relative humidity at the Bucharest Station in comparison with the previous day, from ground level<br />
up to 1500 m altitu<strong>de</strong>. Winds blew from south-east a few hundreds of meters from ground level<br />
and from north-east up to 3000 m altitu<strong>de</strong> (figure 4).<br />
Conditions changed at 12 UTC (figure 5):<br />
- ground - level air temperatures were higher than a day before (there was recor<strong>de</strong>d an<br />
increase in air temperature over the first 800 m while the equipotential temperature had a similar<br />
evolution only for the first 200 meters);<br />
- relative humidity reached lower values than a day before from ground level to 5,000<br />
meters and above;<br />
- wind direction changed from the preceding radio sounding: south-westerly over the first<br />
150 meters and westerly up to and beyond 10,000 meters.<br />
Analyzing the meteorological data<br />
On 18 September 2008, air temperatures had the following features:<br />
- a typical diurnal evolution at each analyzed station (Caransebeş, Târgu Jiu, Craiova and łarcu);<br />
- mo<strong>de</strong>rate diurnal amplitu<strong>de</strong>s on the windward versant (1.4°C...2.1°C at Caransebeş and<br />
łarcu, respectively) and more intense ones on the lee si<strong>de</strong> (12.7°C at Târgu Jiu) as well as across<br />
the plains (10.0°C at Craiova);
196<br />
Anişoara IRIMESCU<br />
- the thermal step between 06 UTC and 08 UTC was more marked across the Târgu Jiu<br />
<strong>de</strong>pression as against the plain areas - Craiova Station (figure 6).<br />
Figure 4. Atmospheric radio sounding on<br />
18.09.2008, 00 UTC - Bucharest Station<br />
(Source: data processed after MeteoRomania Archive)<br />
Figure 5. Atmospheric radio sounding on<br />
18.09.2008, 12 UTC - Bucharest Station<br />
(Source: data processed after MeteoRomania Archive)<br />
Figure 6. Air temperature evolution on 18.09.2008<br />
(Source: data processed after MeteoRomania Archive)<br />
An analysis of the relative humidity data showed that:<br />
- on the windward versant (Caransebeş), this parameter topped 80% throughout the day and<br />
100% on the crest (łarcu);<br />
- on the lee si<strong>de</strong> (Târgu Jiu) as well as in the plains (Craiova) these values ran down to 40%<br />
at 11 UTC (figure 7);<br />
- from 10UTC to 21UTC, relative humidity at Târgu Jiu was lower than at Craiova.<br />
A comparative analysis concerning air temperature and relative humidity revealed the<br />
presence of a foehn, which was highlighted by the fact that between 10 and 21 UTC, while<br />
temperatures were comparable, relative humidity was lower at Târgu Jiu than at Craiova, within<br />
different physical-geographical conditions.
The Foehn Wind in Northern Oltenia. 18.09.2008 Case Study 197<br />
Figure 7. Relative humidity evolution on 18.09.2008<br />
(Source: data processed after MeteoRomania Archive)<br />
On the windward si<strong>de</strong>, cloud formations brought on light atmospheric precipitation<br />
(1 - 10 mm), while on the lee si<strong>de</strong> their absence caused a lack of precipitation (figure 8).<br />
Figure 8. Spatial distribution of atmospheric precipitation on 18-19.09.2008<br />
(Source: MeteoRomania Archive)<br />
Numerical Mo<strong>de</strong>ling<br />
By using the Regional Climatic Mo<strong>de</strong>l RegCM3, there were analyzed the parameters<br />
connected to foehn action, grouped as follows: active surface-related parameters (2-m air<br />
temperature, 10-m wind speed and direction, distribution of precipitation); parameters<br />
<strong>de</strong>rived from a vertical scan of the atmosphere (vertical air motion - upward / downward, air<br />
temperature, wind speed and direction, <strong>de</strong>rivative of temperature).
198<br />
Anişoara IRIMESCU<br />
The first lead is given by the evolution in time of active surface-related temperature,<br />
wind speed and direction. After analyzing these parameters, it was noticed an increase in<br />
temperature of about 1.5°C (figure 9, empty circle), winds from north (figure 9, full circle)<br />
with intensifications of at least 2.5m / s (figure 9, full quadrate) from 00UTC to 03UTC.<br />
Therefore, the first two criteria to i<strong>de</strong>ntify a foehn were met.<br />
Figure 9. Evolution of temperature differences between the two reference regions (empty circle),<br />
meridional flow (full circle) and wind speed (full quadrate) on 18.09.2008<br />
(Source: data processed after MeteoRomania Archive)<br />
To mark out the above mentioned features, it was analyzed the space distribution of these<br />
parameters at mo<strong>de</strong>l-related times (three hours for the active surface and six hours for the vertical<br />
evolution). So, at 06 UTC, on the active surface level there were several warmer areas in the<br />
region of interest (a 2°C difference in relation to the adjoining environment), winds from north and<br />
higher speeds beyond the mountain obstacle (figure 10).<br />
At 15 UTC, the warmer surfaces were still present and wind speed kept its 06 UTC features<br />
(figure 11). As it can be noticed, winds blew mostly from north across Romania, which can also be<br />
seen by analyzing the synoptic maps.<br />
The analysis by vertical sections was focused on the following parameters: temperature, vertical<br />
motion of air (vertical velocity omega), wind speed and direction, and <strong>de</strong>rivative of temperature. The first<br />
three were analyzed for five longitudinal profiles between 46°N and 43°N, while the <strong>de</strong>rivative of<br />
temperature ( ∂ T / ∂z<br />
) was calculated for latitu<strong>de</strong> profiles ranging between 23°E and 24°E. The vertical<br />
section-measured air temperatures for 23°E longitu<strong>de</strong> show a difference of 6°C between the lee si<strong>de</strong> and<br />
the windward one (up to 950 hPa). The warming process on ground level reached a high between 44.6 and<br />
45.0°N, while wind speeds were highest a few latitu<strong>de</strong> <strong>de</strong>grees to the north (figure 12).
The Foehn Wind in Northern Oltenia. 18.09.2008 Case Study 199<br />
Figure 10. Spatial distribution of air temperature, wind speed and direction at 18.09.2008, 06 UTC<br />
(Source: data processed after MeteoRomania Archive)<br />
Figure 11. Spatial distribution of air temperature, wind speed and direction at 18.09.2008, 15 UTC<br />
(Source: data processed after MeteoRomania Archive)
200<br />
Anişoara IRIMESCU<br />
Figure 12. Distribution of air temperature (colored contour) and wind speed and direction (vector),<br />
18.09.2008, 06UTC (vertical section, 23°E longitu<strong>de</strong>)<br />
(Source: data processed after MeteoRomania Archive)<br />
Figure 13. Vertical velocity omega (colored contour), wind speed and direction (vector), 18.09.2008, 06UTC<br />
(vertical section along 23°E longitu<strong>de</strong>)<br />
(Source: data processed after MeteoRomania Archive)
The Foehn Wind in Northern Oltenia. 18.09.2008 Case Study 201<br />
Figure 13 shows the vertical motion by vertical velocity omega dP/dt*10 -3 Pa/s, where the<br />
negative values stand for upward motions and the positive ones for downward motions. On 23°E<br />
longitu<strong>de</strong>, ascending air reached maximum speed at 45.6°N latitu<strong>de</strong>, while the <strong>de</strong>scending<br />
motion started at 45.4°N latitu<strong>de</strong> and got highest speeds at 45.2°N latitu<strong>de</strong>, followed by a new<br />
ascending motion (mostly above the ground level, while on ground level it could be noticed only<br />
around 44.6°N latitu<strong>de</strong>) and again by a new <strong>de</strong>scending one.<br />
Afterwards, these waves could be found only in altitu<strong>de</strong>, which highlights the undulatory<br />
motions of air when an obstacle is crossed – the Scorer-Klieforth theory (Atkinson, 1981). Taking<br />
into account the topography of the mo<strong>de</strong>l, it can be noticed that, at this longitu<strong>de</strong> the greatest<br />
heights are located on 45.35°N latitu<strong>de</strong>. Therefore, air ascends on the windward si<strong>de</strong>, while the<br />
<strong>de</strong>scending motion occurs right after the crest is reached. It should be emphasized that the<br />
horizontal movement of air reaches highest speeds along the sectors of downward motion, from<br />
North-North-West. Above 45.9°N latitu<strong>de</strong>, winds blow West-North-West on the first horizontal<br />
levels, tending to go round the mountain.<br />
The North-North-West direction prevails along the entire height of the section.<br />
The last element to analyze was the distribution of precipitation over the active surface.<br />
At 06 UTC, precipitation fallen during the previous three hours reached 20-30 mm north of<br />
45.5°N latitu<strong>de</strong>, on the windward si<strong>de</strong> of the mountain, while on the lee si<strong>de</strong> there were not<br />
recor<strong>de</strong>d any precipitation amounts (figure 14).<br />
Figure 14. Distribution of atmospheric precipitation on 18.09.2008, 06 UTC<br />
(Source: data processed after MeteoRomania Archive)<br />
CONCLUSIONS<br />
The intensity of foehn winds in the area of interest is significantly diminished as this<br />
area is located insi<strong>de</strong> the curvature formed by the Carpathians and the Balkan Mountains.<br />
Foehn winds here have not the intensity of those in the Alps, whose effect is much more<br />
increased by the higher altitu<strong>de</strong>s and a perpendicular orientation in relation to the more humid<br />
air masses, as against the Southern Carpathians case.
202<br />
Anişoara IRIMESCU<br />
As the program of observations and measurements is getting shorter and some weather<br />
stations are liquidated, the features of foehn winds will be marked out and analyzed using the<br />
regional climate mo<strong>de</strong>l RegCM3 results (with high space-time resolution: 10 km and 3 hours for<br />
the active surface and six hours for the vertical evolution), atmospheric radio sounding and<br />
satellite images, which add to the climatic information.<br />
From a synoptic point of view, the presence of fully <strong>de</strong>veloped cyclones in the Black Sea<br />
region and the anticyclonic belt of Northern Europe generated favorable conditions for foehn<br />
winds to occur on 18.09.2008 in the area of interest.<br />
Every analyzed element confirmed the occurrence of foehn winds on 18.09.2008, which<br />
<strong>de</strong>veloped in the well known manner.<br />
The features of the 18.09.2008 foehn winds are marked out by the following observations:<br />
- air temperatures in the vertical section differed by up to 6°C between the two versants of<br />
the Southern Carpathians within the area of interest, the highest ground-level warming having<br />
occurred between 44.6 – 45.0°N latitu<strong>de</strong>;<br />
- relative humidity of air was recor<strong>de</strong>d with differences of 40% between the lee si<strong>de</strong> (Târgu<br />
Jiu Station) and the windward si<strong>de</strong> (Caransebeş Station);<br />
- wind speed from North-North-West reached highs along the sectors of downward motion,<br />
the most intense gusts having been recor<strong>de</strong>d upstream the area of highest warming;<br />
- precipitation on the windward si<strong>de</strong> of the mountain reached up to 20-30 mm, while on the<br />
lee si<strong>de</strong> they were absent;<br />
- upward and downward motions (vertical velocity omega) provi<strong>de</strong>d information regarding<br />
the presence of undulatory motions (waves) on the lee si<strong>de</strong>.<br />
ACKNOWLEDGMENTS<br />
The author would like to thank: Dr. Mihaela Caian for her help in running the numerical<br />
mo<strong>de</strong>ls and data analysis assistance [PC 6 Cecilia Project – Assessment of the impact and<br />
vulnerability to climate change in Central and Eastern Europe, within which very fine scale (10<br />
km) climatic numerical simulations were performed]; Dr. Carmen Sofia Dragotă and Prof. Univ.<br />
Dr. Octavia Bogdan for their helpful comments on the paper. The author acknowledges also to the<br />
anonymous reviewers for their thoughtful suggestions and comments.<br />
REFERENCES<br />
Atkinson B. W. (1981), Meso-scale atmospheric circulation, Aca<strong>de</strong>mic Press, London, 494 p;<br />
Candrea B. (2007), Cercetări privind utilizarea mijloacelor mo<strong>de</strong>rne pentru caracterizarea factorilor fizico-geografici,<br />
Rezumatul tezei <strong>de</strong> doctorat, mss, Universitatea Transilvania Braşov;<br />
Dickinson B., Beier P. (2006), Quantifying the influence of topographic position on cougar (Puma concolor) movement in<br />
Southern California, USA, The Zoological Society of London, Journal of Zoology 271, pp. 270-277;<br />
Giorgi F., Marinucci M. R., Bates G. T. (1993), Development of a second generation regional climate mo<strong>de</strong>l (RegCM2).<br />
Partea I: Boundary layer and radiative transfer processes, Mon. Wea. Rev., 121, pp. 2794–2813;<br />
Kiehl J. T., Hack J. J., Bonan G. B., Boville B. A., Briegleb B. P., Williamson D. L., Rasch P. J. (1996), Description of the<br />
NCAR Community Climate Mo<strong>de</strong>l (CCM3), NCAR Tech. Note NCAR/TN-420+STR, 143 pp;<br />
Posea Gr., Ba<strong>de</strong>a L. (1984), UnităŃile <strong>de</strong> reflief (regionarea geomorfologică), hartă color sc. 1:750 000, Editura ŞtiinŃifică<br />
şi Enciclopedică, Bucureşti;<br />
Ramanathan V., Downey P. (1986), A nonisothermal emissivity and absorptive formulation for water vapor, J. Geophys.<br />
Res. Atmospheres, 91, pp. 8649-8666;<br />
Slingo A. S. (1989), A GCM parameterization for the shortwave radiative properties of water clouds, J. Atmos. Sci. 46, pp 1419-1427;<br />
*** (1992), DicŃionar Meteorologic InternaŃional, OrganizaŃia Meteorologică Mondială;<br />
*** Baza <strong>de</strong> date climatice, AdministraŃia NaŃională <strong>de</strong> Meteorologie (09.2008);<br />
*** Arhiva <strong>de</strong> imagini satelitare MSG, AdministraŃia NaŃională <strong>de</strong> Meteorologie (09.2008);<br />
*** www.wetter3.<strong>de</strong><br />
Submitted: Revised: Accepted and published online<br />
June 30, 2011 Octomber 08, 2011 November 26, 2011
Analele UniversităŃii din Ora<strong>de</strong>a – Seria Geografie Year XXI, no. 2/2011 (December), pp. 203-208<br />
ISSN 1454-2749, E-ISSN 2065-1619 Article no. 212105-543<br />
ASPECTS REGAR<strong>DIN</strong>G THE RIME PHENOMEN IN DEVA AREA<br />
Cristina Diana BRĂDĂU ∗<br />
University of Ora<strong>de</strong>a, Armatei Române Street, no. 1, Ora<strong>de</strong>a, Romania,<br />
Doctoral School in Geography, mail: cristinabradau@yahoo.com<br />
Abstract: The survey regarding the rime phenomenon in Deva area was carried out for the<br />
time between 1961 - 2010. Within the time surveyed, the number of days with rime halted<br />
between 75 days in 1965 and 16 days in 2010. The average number of days with rime is 44<br />
days. In Deva area, the phenomenon of rime has a mo<strong>de</strong>rate condition.<br />
Key words: phenomenon of rime, frost, Deva city area.<br />
* * * * * *<br />
INTRODUCTION<br />
Rime is the phenomenon whose spatiotemporal action <strong>de</strong>pends on the air temperature, wind<br />
and humidity. It can be seen when the air and earth’s temperature drops un<strong>de</strong>r 0°C, air humidity is<br />
over 70%, calm weather or mild wind, reduced cloudiness or clear sky, high insolation during the<br />
day and high level of radiation during the night which <strong>de</strong>termines the temperature to drop below<br />
the freezing point and the vapors sublimation (Măhăra, 2001). The appearance of rime is<br />
<strong>de</strong>termined by three categories of causes in Deva: air masses circulation, the active surface and<br />
climatic elements characteristics (humidity, cloudiness, temperature, wind).<br />
In Deva area, the greatest part of the freezing and rime phenomena are <strong>de</strong>termined by the<br />
air masses that disperse out the Field of Pannonia, Northern Europe and North-Western Europe.<br />
The geosynoptical conditions presented cause the most numerous cooling because of the cool air<br />
masses in Greenland as far as the South-Eastern Europe. The low air pressure in the Romania area<br />
attracts the cool air with high air pressure in the Scandinavian Peninsula.<br />
METHODOLOGY<br />
The Deva Weather Base provi<strong>de</strong>d data collected between 1961 - 2010 for the analysis of the<br />
rime phenomenon. The data referring to the numer of days with rime in the cities Iaşi, Timişoara,<br />
ConstanŃa, Braşov and Câmpina were collected out of Clima României, 2008 the edition.<br />
In this survey, we analyse the indicators referring to the multiannual average number of days<br />
with rime, the abnormality of the annual number of days with rime besi<strong>de</strong> the multiannual average, the<br />
monthly average number of days with rime. The comparative analysis of the number of days with rime<br />
in certain cities placed in different parts in Romania emphasizes the importance of the geographical<br />
position and its relief in the rime phenomenon appearance on the Romanian territory.<br />
∗ Corresponding Author<br />
http://istgeorelint.uora<strong>de</strong>a.ro/Reviste/Anale/anale.htm
204<br />
Cristina Diana BRĂDĂU<br />
RESULTS<br />
The multiannual fluctuation of the number of days with rime<br />
This indicator has a crucial importance in the emphasis of the maximum and minimum<br />
number of days with rime between 1961 - 2010, as well as the negative and positive abnormalities<br />
compared to the multiannual average.<br />
For an integrating analysis, we consi<strong>de</strong>r the annual average number of days with rime in the<br />
following cities: Iaşi, Timişoara, ConstanŃa, Braşov and Câmpina placed in different parts on the<br />
Romanian territory and towards Deva city.<br />
Table 1.The annual average number of days with rime (1961 - 2007)<br />
(Data source: Clima României, 2008)<br />
City Iaşi Timişoara ConstanŃa Deva Braşov Câmpina<br />
Annual average no. of days 66.1 59.1 28.8 45.8 55.2 71.3<br />
with rime<br />
Analysing the situation within the context of the said cities, we notice certain<br />
differences among the annual average number of days with rime, differences caused by their<br />
geographical position towards the Carpathian Curve as well as certain characteristics of the<br />
air masses dynamics.<br />
Iaşi<br />
66,1<br />
Timişoara<br />
59,1<br />
ConstanŃa<br />
28,8<br />
Deva<br />
45,8<br />
Braşov<br />
55,2<br />
Câmpina<br />
71,3<br />
0 10 20 30 40 50 60 70 80<br />
Figure 1. The annual average number of days with rime<br />
(Data source: Clima României, 2008)<br />
The lowest number of days with rime is reported to be in ConstanŃa due to the Pontic<br />
influence which has the role of a regulator on the climate. The highest number of days with<br />
rime is reported to be in Câmpina, Iaşi, Timişoara that is in the extra-Carpathian regions due<br />
to the cool air advections out North, North-West and East (figure 1). The air advection is<br />
produced by the anticyclones located in the Western and Central part of Europe when the<br />
regions in the Northern half of Romania are affected by rime while, when these advections are<br />
generated by the anticyclones located in the Scandinavian Peninsula and the Russian Field,<br />
the rime affected regions are the Eastern and South-Eastern parts of the country (Bogdan and<br />
Niculescu, 1999).
Aspects Regarding the Rime Phenomen in Deva Area 205<br />
In Deva, the lowest number of days with rime is conditioned by its specific mild<br />
climate. For the interval between 1961 - 2010, the annual average number of days with rime<br />
in Deva fluctuated between 75 days in 1965 and 16 days in 2010 (figure 3). For the analysed<br />
interval of time, high values of the number of days, with rime were recor<strong>de</strong>d in 1998 (73<br />
days) and 1997 (68 days). We have to mention that the high number of days with rime in the<br />
above-said years was conditioned by either the early invasion of anticyclonic air masses out<br />
Europe in the context of a region with low pressure in Romania, or the persistence of the<br />
anticyclonic condition during the cold season combined with the appearance of the mobile<br />
Mediterranean cyclones which raises the level of humidity.<br />
N o .o f d a y<br />
80<br />
60<br />
40<br />
20<br />
0<br />
1 9 6 1<br />
1 9 6 3<br />
1 9 6 5<br />
1 9 6 7<br />
1 9 6 9<br />
1 9 7 1<br />
1 9 7 3<br />
1 9 7 5<br />
1 9 7 7<br />
1 9 7 9<br />
1 9 8 1<br />
1 9 8 3<br />
1 9 8 5<br />
1 9 8 7<br />
1 9 8 9<br />
1 9 9 1<br />
1 9 9 3<br />
1 9 9 5<br />
1 9 9 7<br />
1 9 9 9<br />
2 0 0 1<br />
2 0 0 3<br />
2 0 0 5<br />
2 0 0 7<br />
2 0 0 9<br />
75<br />
Positive abnormalities<br />
Negative abnormalities<br />
44,6<br />
16<br />
Number of days with rime<br />
Multiannual average of days with rime<br />
Figure 2. Abnormalities of the annual number of days<br />
with rime besi<strong>de</strong> the multiannual average in Deva (1961 - 2010)<br />
(Data source: AdministraŃia NaŃională <strong>de</strong> Meteorologie)<br />
Between 1961 - 2010, the multiannual average number of days with rime is 44.6 days.<br />
Besi<strong>de</strong> this multiannual average, there were noticed positive and negative abnormalities.<br />
The highest number of days with rime was recor<strong>de</strong>d in 1965 (75 days) and the lowest number of<br />
days with rime - in 2010 (16 days with rime). The high number of days with rime recor<strong>de</strong>d in 1965 is<br />
due to certain early cooling on autumn which was caused by the invasion of arctic masses of air in the<br />
context of the mobile polar anticyclones appearance in the Northern part of Europe. Over the year of<br />
1965, the high number of days with rime in October the 7th can be noticed.<br />
The appearance of the phenomenon was favoured by the advection of cold air masses in the<br />
Northern and North-Western parts of Europe, being attracted by the minimum barometric<br />
temperature in the Black Sea pond. The maximum expansion of such masses towards our territory<br />
took place on October the 20th, 1965, as it can be noticed on the baric and geopotential field at 500<br />
hPa (figure 3). We have to mention that at Deva Meteorological Base, the minimum<br />
Temperature at soil level on October the 23th, 1965, was -6.2°C. On the 25th of October,<br />
1965, the minimum temperature at soil level was -5°C. These temperature values combined with a<br />
raised value of humidity created favourable conditions for the appearance of the rime phenomenon<br />
in the second part of October, in 1965, in Deva.<br />
In 1965, the rime phenomenon lasted until late in the spring, so that in May there were two<br />
days of rime ere recor<strong>de</strong>d. We have to mention that the map of baric and geopotential field at 500<br />
hPa highlights that on 11 th of May, 1965, there was an arctic air mass on the territory of Romania.<br />
Such a situation happened because certain cold and humid air masses moved towards Central<br />
Europe, being attracted by the minimum pressure values that were <strong>de</strong>termined by the<br />
Mediterranean cyclones in the Southern Europe (figure 4).
206<br />
Cristina Diana BRĂDĂU<br />
Figure 3. The map of baric and geopotential field at 500 hPa, on 20th October, 1965<br />
(Data source: www.wetterzentrale.<strong>de</strong>)<br />
Figure 4. The map of the baric and geopotential field at 500 hPa in 11th May, 1965<br />
(Data source: www.wetterzentrale.<strong>de</strong>)<br />
Over 70 days with rime were recor<strong>de</strong>d in 1998, as well. In 1999, over 60 days with rime<br />
were recor<strong>de</strong>d, while, in 2000, the number of days with rime was 60. The low number of days with<br />
rime was caused by the predominance of a stressed cyclonic condition in Deva because the mobile<br />
Mediterranean cyclones moved to East. A number of less than 30 days with rime was recor<strong>de</strong>d in<br />
1962 (27 days), 1978 (23 days), 1980 (29 days). In 1987, there were 25 days with rime and 20 days in<br />
2009. Between 1961 – 2010, in Deva, the lowest annual number of days without rime was recor<strong>de</strong>d in<br />
1965, 290 days, followed by 1998 with 292 days without rime. The highest annual number of days<br />
without rime was recor<strong>de</strong>d in 2010, 249 days, followed by 2009 with 345 days.
Aspects Regarding the Rime Phenomen in Deva Area 207<br />
Besi<strong>de</strong> the multiannual average of 44.6 days with rime in Deva, 26 years of positive<br />
abnormalities were recor<strong>de</strong>d, which represents 53% of the total of years taken into account,<br />
and 23 years with negative abnormalities, which represents 47% (figure 5). The highest<br />
positive abnormality was recor<strong>de</strong>d in 1965, 30 days, while in 1961 and 1964 the least positive<br />
abnormality was recor<strong>de</strong>d, 1 day. The negative abnormalities varied between 29 days in 2010<br />
(the highest) and 2 days in 1968 (the least).<br />
53%<br />
47%<br />
Negative abnormalities<br />
Positive abnormalities<br />
Figure 5. The abnormality frequency besi<strong>de</strong> the multiannual average in Deva, between 1961 - 2010<br />
(Data source: AdministraŃia NaŃională <strong>de</strong> Meteorologie)<br />
The annual variation of the number of days with rime<br />
Over a year, certain favourable conditions for the rime appearance in the interval September -<br />
May can be created. The analysis of the monthly average values of the days with rime for the interval<br />
1961 - 2010 stresses the fact that March is the month with the highest number of days with rime -<br />
8.14 - followed by November with 7.9 days, while the minimum days for the suitable time for rime<br />
appearance are recor<strong>de</strong>d in May and September, when the monthly average is less than 1 day (figure<br />
6). After the analysis of the monthly average values, we can notice that the monthly average number<br />
of days with rime is spring and autumn, not winter. In Deva, the earliest date the rime can appear is<br />
in the first part of September, and the latest is in the first part of May.<br />
Table 2. Average monthly number of days with frost and their frequency in Deva, 1961 - 2010<br />
(Data source: AdministraŃia NaŃională <strong>de</strong> Meteorologie)<br />
Month IX X XI XII I II III IV V Annual<br />
No. days 0,2 4,9 7,9 7,2 6,6 7,4 8,14 2,1 0,16 44,7<br />
Frequency 0,4 11,0 17,8 16,1 14,8 16,5 18,2 4,8 0,4 100<br />
No of day<br />
10<br />
8<br />
6<br />
4<br />
2<br />
0<br />
8,14<br />
IX X XI XII I II III IV V<br />
No. of day<br />
0,16<br />
Figure 6. The monthly average number of days with rime in Deva, 1961 - 2010<br />
(Data source: AdministraŃia NaŃională <strong>de</strong> Meteorologie)<br />
During the winter months, the number of days with rime in Deva varies between 6.6 days<br />
with a frequency of 14.77% in January and 7.36 days with a frequency of 16.47% in February. The<br />
highest frequency of the days with rime over the winter is recor<strong>de</strong>d in February - 16.47% -<br />
followed by December with a frequency of 16.15%.
208<br />
Cristina Diana BRĂDĂU<br />
Analysing the monthly frequency of the days with rime within the interval with probability<br />
for rime, we can notice that the highest frequency is recor<strong>de</strong>d in March - 18.21% - followed by<br />
November with 17.80%. The lowest frequency is recor<strong>de</strong>d in May - 0.35% - followed by<br />
September, with a frequency of 0.44% (figure 2).<br />
The high number of days with rime in March is caused by the action of the anticyclones located<br />
in the Western and Central part of Europe (Bogdan and Niculescu, 1999). The relief composition in<br />
Deva and the presence of Mureş couloir favour the cold and humid air masses to remain there, which<br />
explains the high number of days in spring and autumn months. In this respect, we mention the fact that<br />
the highest number of days with rime is not recor<strong>de</strong>d during the winter months, but in March and<br />
November, that is in spring and autumn. The lowest frequency is recor<strong>de</strong>d in September and October<br />
due to the cold and humid air masses receding towards the Northern Europe and activating the<br />
anticyclones formed in the Arabic Peninsula and Northern Africa.<br />
The earliest rime in Deva was recor<strong>de</strong>d on 14 th September and the latest on 13 th May<br />
(Clima României, 2008). These pieces of data have a crucial importance in agriculture because on<br />
the specified dates, a part of the culture is in vegetation and, un<strong>de</strong>r these circumstances, rime<br />
causes damages in culture. The average date of the first rime appearance is 16 th October, but it can<br />
be slow in coming un<strong>de</strong>r certain conditions until 16 th November. The average date of the last rime<br />
is 17 th April, but, over the years, it can disappear after 17 th March (Clima României, 2008).<br />
The risk interval represents the interval between the average and extreme date of rime<br />
appearance. Thus, between the average date of the first frost and the earliest frost in autumn<br />
represents the autumn risk interval; and between the average date of the last frost and the latest<br />
frost in spring represents the spring risk interval (Bogdan and Niculescu, 1999). In Deva, the<br />
autumn risk interval for rime is between 14 th September and 16 th October. The spring risk interval<br />
is between 17 th April and 13 th May.<br />
Rime appearance in Deva outsi<strong>de</strong> the average dates of happening for either the first rime or<br />
the last one is favoured by a certain aerospace configuration, as well as the local relief conditions.<br />
RISK ASPECTS<br />
The study on this phenomenon has a crucial importance when it happens either too early in<br />
autumn, or too late in spring. This importance comes from the negative implications in agriculture,<br />
causing serious damage in culture if it occurs during plant vegetation.<br />
Rime becomes a risk climatic phenomenon for the economy if:<br />
- it occurs 2 - 3 weeks earlier in autumn or later in spring, compared with the average<br />
dates (Gaceu, 2005);<br />
- frost appears simultaneously on the soil and in the air (Gaceu, 2005);<br />
- rime occurs at the same time with other meteorological phenomena (slush, snow, fog);<br />
- the anticyclonic condition representative for rime occurrence favours the pollutant factors<br />
persistence in the atmosphere;<br />
- the high level of humidity in the air causes discomfort for human organisms.<br />
REFERENCES<br />
Bogdan Octavian, Niculescu Elena (1999), Riscuri climatice din România, Editura Sega-InternaŃional, Bucureşti;<br />
Gaceu O. (2005), Clima şi riscurile climatice din MunŃii Bihor şi Vlă<strong>de</strong>asa, Editura UniversităŃii din Ora<strong>de</strong>a, Ora<strong>de</strong>a;<br />
Măhăra Gh. (2001), Meteorologie, Editura UniversităŃii din Ora<strong>de</strong>a, Ora<strong>de</strong>a;<br />
*** (2008), Clima României, Editura Aca<strong>de</strong>miei Române, Bucureşti.<br />
*** www.wetterzentrale.<strong>de</strong><br />
*** www.inm.ro<br />
Submitted: Revised: Accepted and published online<br />
July 20, 2011 September 19, 2011 November 09, 2011
Analele UniversităŃii din Ora<strong>de</strong>a – Seria Geografie Year XXI, no. 2/2011 (December), pp. 209-221<br />
ISSN 1454-2749, E-ISSN 2065-1619 Article no. 212106-536<br />
COMMUNITY’S ADAPTIVE CAPACITY DUE TO COASTAL<br />
FLOO<strong>DIN</strong>G IN SEMARANG COASTAL CITY, INDONESIA<br />
Muh Aris MARFAI ∗<br />
Geography Faculty, Gadjah Mada University, 55281 Yogyakarta, Indonesia.<br />
e-mail: arismarfai@gadjahmada.edu / arismarfai@yahoo.com<br />
Dyah R. HIZBARON<br />
Geography Faculty, Gadjah Mada University, 55281 Yogyakarta, Indonesia.<br />
e-mail: emmahisbaron@gmail.com<br />
Abstract: Community’s response and adaptive capacity is a one of the key roles on the<br />
disaster management and risk reduction program. This study is aimed to investigate the<br />
coastal community’s response and adaptive capacity due to tidal flood hazard in the<br />
Terboyo Wetan Village and Trimulyo Villages along the coastline of Semarang City. These<br />
two villages are suffered from tidal flood hazards, and further consequences are land<br />
subsi<strong>de</strong>nce hazards as the impact of man-ma<strong>de</strong> activity and worsened by industrial activity.<br />
The research is inductively attaining data and concluding the result as in a <strong>de</strong>scriptive<br />
manner via questionnaire. The result reveals that the local communities are aware of the<br />
tidal flood hazard, but this un<strong>de</strong>rstanding did not manage to support their <strong>de</strong>cision to leave<br />
the area. The community has adapted the tidal flood by simple physical adaptation strategy,<br />
such as increase the floor level following the water level and making small dam to blocking<br />
water enter the house. This response is not sufficient and aesthetically not proper from the<br />
environmental point of view. From the community’s perception obtained during the<br />
research, it can be said that instead of taking the tidal flood as the risk, the community in<br />
the research area tends to neglect the hazard and consi<strong>de</strong>red that the tidal flood is no longer<br />
as threat towards their wellbeing.<br />
Key word: community’s response and adaptive capacity; coastal area; tidal flood hazard;<br />
Terboyo Wetan and Trimulyo Villages; Semarang City.<br />
* * * * * *<br />
INTRODUCTION<br />
Local community response and community resilience toward hazard and natural disaster<br />
become an important subject on disaster management studies. The community resilience <strong>de</strong>fined<br />
as the evaluation towards the community competence to adapt and or to improve their current state<br />
towards particular threads (Thomalla et al., 2007; Twigg, 2007).<br />
The competence of the community generally addressed as the adaptive capacity. The<br />
community response and adaptive capacity can be in any form of economic <strong>de</strong>velopment, social<br />
capital, information or communication and or community competence. Different disaster<br />
occurrence and type provokes different level of frequency and magnitu<strong>de</strong> which in a way<br />
correspond with the availability of resource to cope with it. Thus, the nature of community<br />
∗ Corresponding Author<br />
http://istgeorelint.uora<strong>de</strong>a.ro/Reviste/Anale/anale.htm
210<br />
Mush Aris MARFAI, Dyah R HIZBARON<br />
response and adaptive capacity is unique and dynamic (Adger et al., 2004). It means that in<br />
particular area, the evaluation towards the adaptive capacity is essential to be carried out in or<strong>de</strong>r<br />
to i<strong>de</strong>ntify the existing local community resources to cope with any other disaster occurrence.<br />
Community response and adaptive capacity is illustrated in a form of culture setting, as<br />
argued by Gunawan (2001).<br />
The cultural setting correlates the human adaptation to their environmental setting. The<br />
adaptation method is not easily shifting without any cultural transition (Miller and Weitz<br />
1979; Moran, 1982; Gunawan, 2001).<br />
Inversely, the adaptive capacity in the community is <strong>de</strong>fine inclusively, <strong>de</strong>pends on the<br />
characteristics of wellbeing, existence of threads and local resource (Luers et al., 2003). In<br />
or<strong>de</strong>r to <strong>de</strong>lineate the homogenous community, scholars generally address to the village level,<br />
as the smallest unit (example: Dewi, 2007; Marfai et al., 2008).<br />
In the <strong>de</strong>veloping countries such as Indonesia, the village level (<strong>de</strong>sa/kelurahan) generally<br />
comprise of the people who share the same tradition, occupation, and sometimes borne from the<br />
same kinship. It is reasonable since the community in the village generally lacking of know how<br />
technology and less informed to any innovation. Therefore, it is argued that in this level, the<br />
adaptive capacity assumed to be homogenous since it was built from the collective un<strong>de</strong>rstanding.<br />
Series of research to i<strong>de</strong>ntify the coastal hazard management, tidal flood management and<br />
the land subsi<strong>de</strong>nce impact in the coastline along the Semarang city has been conducted (Marfai<br />
and King, 2007; Marfai and King, 2008a; Marfai et al., 2008).<br />
There are abundance of literature on the coastal hazard management in Semarang City,<br />
such as Soedarsono (1996), Kobayashi (2003), Marfai (2003, 2004a, and 2004b), Dewi<br />
(2007), Directorate of Geology and Environment of Bandung and BGR (2008), and Marfai<br />
and King (2008b).<br />
Since the 2001, it was revealed that the most common local adaptation conducted by the<br />
local community is in a form of structural or physical adaptation in their houses and any kind of<br />
building type (Arbriyakto and Kardyanto 2001). Most of the studies focus on the i<strong>de</strong>ntification of<br />
the impact of either tidal flood or land subsi<strong>de</strong>nce in Semarang City. Less of the literature provi<strong>de</strong><br />
an insight of how the local community adaptation characteristics changing from time dimension<br />
and promotes the positivism approach of the coastal hazard management.<br />
This article aimed to elaborate any significant changes towards local response in the<br />
Terboyo Wetan Village and Trimulyo Village along the coastline of Semarang coastal area.<br />
Previously, at early millennium the local adaptation is in a form of structural and physical<br />
adaptation, while there are so many up dates know- how technologies, „how is the form of<br />
adaptation changing in the community level?” The research tries to answer this question using<br />
<strong>de</strong>scriptive analysis.<br />
RESEARCH SETTING<br />
The research is conducted in the prone area of land subsi<strong>de</strong>nce and tidal flood along the<br />
coastline in the Semarang City, Central Java Province, Indonesia. There are more than twenty<br />
villages along the Semarang City coastline suffered from the coastal inundation which produce<br />
tidal flood and enhance the land subsi<strong>de</strong>nce phenomena (figure 3).<br />
Among these twenty villages, the research shall focus on the i<strong>de</strong>ntification of the local<br />
adaptive capacity in the two villages, Terboyo Wetan and Trimulyo. The i<strong>de</strong>ntification of the two<br />
villages is aimed to complete the information along the coastline in Semarang City in or<strong>de</strong>r to have<br />
complete series of data related to the community adaptation strategy.<br />
Some villages, neighboring this two villages along the coastline of Semarang, have<br />
been investigated by previous researches Kobayashi (2003), Dewi (2007), Directorate of<br />
Geology and Environment of Bandung and BGR (2008), and Marfai and King (2008b), thus<br />
this research will complete the information related the community’s response to flood hazard<br />
along the Semarang coastal area.
Community΄s adaptive capacity due to coastal flooding in… 211<br />
The location of these two villages is relatively strategic for the industrial area and other<br />
commercial type of land use. The land use of the two villages are varied, ranging from the<br />
settlement, terminal, freight terminal, middle industrial estate, hospital, and university.<br />
Figure 1. The Distribution of Hazardous Area along the coastline in Semarang City<br />
(Source: Regional Development Board, Semarang Municipality, 2002)<br />
The strategic commercial land use is signified with the <strong>de</strong>nsely populated area per<br />
hectare (table 1).<br />
Table 1. Demographic Condition of Research area<br />
Source: Regional Development Board, Semarang Municipality, 2002<br />
Village<br />
Total<br />
Inhabitant<br />
Width (Ha) Density per (Ha)<br />
Terboyo Wetan 1690 127.5 13.3<br />
Trimulyo 4135 295.9 14.0
212<br />
Mush Aris MARFAI, Dyah R HIZBARON<br />
The community occupation relatively relied upon the environmental setting such as<br />
fisherman, harbor, industrial activities, less agricultural activity and recreational activities.<br />
Administratively, these two villages are categorized as the rural area, however, from the<br />
physical i<strong>de</strong>ntification the area may be categorized as urbanized area. As argued, that there are at<br />
least four types of flooding in the urban areas: 1) localized flooding occurs in slum area because of<br />
the insufficient draining system; 2) small streams in urban areas rise very rapidly due to heavy<br />
rainfall; 3) major rivers over the critical height above the land; 4) wet season flooding.<br />
None of these category occurred in the Terboyo Wetan and Trimulyo (figure 2).<br />
Figure 2. Inundated Area along the Semarang Coastline<br />
(Source: Marfai and King 2008c)<br />
Both villages are experiencing tidal flood due to the rise of tidal sea and sea surge, affect<br />
the sea level rise over the critical height above the coastal land (Marfai et al., 2008).<br />
The tidal flood highly perceived as the frequent type of natural hazard that should be cope<br />
with. The community aware of the tidal flood, however, the severe impact of land subsi<strong>de</strong>nce is<br />
perceived mo<strong>de</strong>rately as longer terms of impact.<br />
The Terboyo Wetan village and Trimulyo village is located in the western part of the<br />
coastline (figure 3a).<br />
The elevation of the villages is relatively lower than the coast area, with the darker black<br />
color. Additionally, from the figure 3b, the darker red color to the beige yellow color indicates the<br />
unstable land (subsi<strong>de</strong> up to 8 cm per annual, Directorate of Geology and Environment of<br />
Bandung and BGR (2008)), whilst the green color express relatively stable ground (subsi<strong>de</strong> 0 cm<br />
per annual). Both of the research area is <strong>de</strong>lineated in the red color; it means that the area is<br />
suffered from worse land subsi<strong>de</strong>nce.<br />
The land subsi<strong>de</strong>nce in Semarang City is assumed as the result of the mix natural condition<br />
and induced by the human activity. It is predicted that the land subsi<strong>de</strong>nce in Semarang City was<br />
induced by the usage of groundwater, which exceeds the quantity of natural replenishment.<br />
Consequently, water level in the alluvium clay layers and sand sedimentation – composition of the<br />
coast area – is <strong>de</strong>clining causing the land subsi<strong>de</strong>nce.
Community΄s adaptive capacity due to coastal flooding in… 213<br />
Figure 3. a) Administrative boundaries and DEM data of Semarang,<br />
b) Subsi<strong>de</strong>nce in the Semarang coastal area
214<br />
Mush Aris MARFAI, Dyah R HIZBARON<br />
As noted by Marfai and King (2007), that the prediction of the land subsi<strong>de</strong>nce in<br />
Semarang City is increasing in longer terms. Subsequently after the sea level rise phenomena<br />
and exceeding groundwater usage, it is projected that the area may loss 328.5 hectare per year<br />
in 2010 and its getting worse by the year 2020 with total loss of 1464 hectare per year. It<br />
means that the area shall suffer from further economic loss and other unquantifiable loss. It<br />
was predicted that the public utilities shall suffer the most due to the land subsi<strong>de</strong>nce are<br />
transportation network, industrial area and warehouses (Kobayashi, 2003).<br />
Figure 4. Type of land use system in the coastal area of Semarang City<br />
(Source: Marfai and King 2008b)<br />
It is projected that more people will settled in the research area due to its strategic location.<br />
The typified land use system along the coastline can be seen from the figure 4.<br />
Spatially the research area is important to be protection area however the land occupation is<br />
not easy to be stopped. The juxtaposition of having the coastline productive at the same time being<br />
preserved is merely on the blueprint. The community facing serious difficulties to avoid the natural<br />
impact either sea surge, tidal inundation, or the land subsi<strong>de</strong>nce.<br />
METHODOLOGY<br />
Summarized from the previous research setting, the research area suffered from unfortunate<br />
natural condition – lied in the low land of coastline – hit by immense tidal surge which leads to<br />
tidal flooding. At the same time, to fulfill human basic necessity the groundwater keep <strong>de</strong>pleting<br />
and induce further natural catastrophe in the longer terms, such as the land subsi<strong>de</strong>nce. It means
Community΄s adaptive capacity due to coastal flooding in… 215<br />
that the current capacities in the research area should be i<strong>de</strong>ntified in or<strong>de</strong>r to provi<strong>de</strong> better insight<br />
in the coastal hazard management in the future.<br />
The research is inductively attaining data and concluding the result as in a <strong>de</strong>scriptive<br />
manner. The analytical technique applied to evaluate the data is statistic inferential, because this<br />
research simplified the population into the sampling unit. Statistic inferential or inductive statistic<br />
is a technique of statistic which applied to observe data from the sampling unit, and conclu<strong>de</strong> the<br />
result for the whole population (Sugiyono, 2007).<br />
The unit of analysis is multi level; the household are taken to represent the condition in<br />
an area respectively. The questionnaire is applied for the i<strong>de</strong>ntification of local adaptive<br />
capacity in the research area. The content of the questionnaire was adopted from previous<br />
research by Dewi (2007) and Marfai et al., (2008).<br />
The questionnaire was applied by Marfai et al., (2008) in the Bandarharjo and Tanjung Mas<br />
Villages, Semarang Coastal area. Our research is conducted in Terboyo Wetan and Trimulyo<br />
Villages. By using the similar questionnaire, we expect to have a comprehensive data along the<br />
coastline of Semarang City in the future. Detailed research method can bee seen in the figure 5.<br />
The field observation is conducted to i<strong>de</strong>ntify the real condition in the community level<br />
(village or <strong>de</strong>s a / kelurahan). The primary data are obtained via in <strong>de</strong>pth interview and semiclosed<br />
questions on the risk perceptions and the methods of response and adaptive capacity. Total<br />
respon<strong>de</strong>nt are 40 people with the assumption of validity of statistical analysis (n > 30).<br />
Figure 5. Research Method<br />
The questionnaire comprise of several important element subjected to the research goals,<br />
such as: 1) General information about the respon<strong>de</strong>nt, 2) Respon<strong>de</strong>nt perception on tidal flood<br />
hazard in their area, 3) Impact of the tidal flood hazard, 4) Affected building / supra-structure /<br />
infrastructure due to the tidal flood hazard, 5) Physical adaptation, and 6). Task force to <strong>de</strong>al with<br />
the tidal flood hazard.<br />
RESULT AND DISCUSSION<br />
CHARACTERISTIC OF THE RESPONDENT<br />
Local adaptive capacity in Terboyo Wetan and Trimulyo village are evaluated using the<br />
questionnaire. The characteristics of the respon<strong>de</strong>nt are shown in the table 2.<br />
There are 40 respon<strong>de</strong>nts which comprise of 20 respon<strong>de</strong>nts from Terboyo Wetan and 20<br />
respon<strong>de</strong>nts from Trimulyo. Based on the <strong>de</strong>mographic condition, there are 67.5% of male respon<strong>de</strong>nt,
216<br />
Mush Aris MARFAI, Dyah R HIZBARON<br />
and most of the respon<strong>de</strong>nt are in productive ages 18 – 65 years. Predominantly, the respon<strong>de</strong>nts are<br />
graduated from the secondary school (52.5%), higher education (35%) and non-education (12.5%).<br />
Responding to the characteristics of the environment, most of respon<strong>de</strong>nt work in the<br />
industry as a labor and farmer. Small share of the respon<strong>de</strong>nt is working as the government<br />
employer and other type of jobs.<br />
As noted earlier, the type of culture and existing wellbeing should be <strong>de</strong>scribe to grasp<br />
the potential resource as the origin of capacity in particular area. The type of housing also<br />
<strong>de</strong>scribed in the characteristics of respon<strong>de</strong>nt in or<strong>de</strong>r to support the wellbeing of the<br />
respon<strong>de</strong>nt <strong>de</strong>spite the type of occupation.<br />
Table 2. Characteristics of Respon<strong>de</strong>nt<br />
Characteristic Number of respon<strong>de</strong>nts Percent<br />
Sex:<br />
Male 27 67.5<br />
Female 13 32.5<br />
Age:<br />
18-25 22 55<br />
25-45 9 22.5<br />
45-65 9 22.5<br />
> 65 0 0<br />
Educational level:<br />
Non education-primary school 5 12.5<br />
Secondary school 21 52.5<br />
High school and University 14 35<br />
Occupation:<br />
Industry labor 19 47.5<br />
Farmer/Fisherman 10 25<br />
Government employer 8 20<br />
Other jobs 3 7.5<br />
Type of housing:<br />
Permanent 34 85<br />
Semi-permanent 6 15<br />
COMMUNITY’S PERCEPTION OF TIDAL FLOOD HAZARD<br />
Local communities are aware of the natural hazard especially tidal flood. But this<br />
knowledge did not manage to support their <strong>de</strong>cision to leave the area. The reason is merely on the<br />
lack of alternatives, and other classical accessibility reasoning.<br />
Table 3. Distribution of people’s perception of tidal flood<br />
People’s perception of tidal flood Number of respon<strong>de</strong>nts Percent<br />
Knowledge of tidal flood hazard:<br />
Aware that the area is subject to tidal flooding 32 80<br />
Not aware that the area is subject to tidal flooding 8 20<br />
Motivation for their continued stay: 0<br />
Have no other alternatives due to lack of capital 22 55<br />
Accessibility to city centre, industrial estate, public facilities and<br />
15 37.5<br />
close to their working place<br />
Believe related culture and they were born in the area 3 7.5<br />
The most often of tidal flood <strong>de</strong>pth: 0<br />
Community΄s adaptive capacity due to coastal flooding in… 217<br />
75-100 cm 6 15<br />
>100 cm 0 0<br />
The most often of the duration of tidal flood: 0<br />
< 3 hour 5 12.5<br />
3-6 hour 18 45<br />
6-9 hour 12 30<br />
>9 hour 5 12.5<br />
Cause of inundation: 0<br />
Land subsi<strong>de</strong>nce 18 45<br />
Poor drainage system 12 30<br />
Sea level rise 6 15<br />
Have no i<strong>de</strong>a 4 10<br />
Figure 6. Impact of tidal flood to daily activities<br />
Figure 7. Physical adaptation by respon<strong>de</strong>nts<br />
The community express that the current research area is close to city centre, industrial<br />
estate, public facilities, and to their working place. Small share of the respon<strong>de</strong>nt believes that they<br />
should stay in the area due to the bounding with the previous generations and other kinship matter.
218<br />
Mush Aris MARFAI, Dyah R HIZBARON<br />
Tidal flood in the research are often occurred for more than 3 hours, and lasted for more than 6 to<br />
9 hours. The <strong>de</strong>pth of the tidal flood is relatively from 25 cm to 75 cm.<br />
The community able to i<strong>de</strong>ntify the cause of the tidal flood, 45% reveals that land<br />
subsi<strong>de</strong>nce is the main cause of inundation, 30% express that the poor drainage system as the<br />
cause, while other 15% <strong>de</strong>em that sea level rise is the main cause of the inundation.<br />
Most of the community express that the natural system as the leading factor causing the<br />
inundation. The elaboration towards the distribution of people’s perception towards tidal<br />
flood can be seen in table 3.<br />
In addition, the tidal flood occurrence did not force the community to leave their activities,<br />
on the other hand, they continue working and doing daily activities. It means that the tidal flood<br />
generally occurred and the community did not distract over the tidal flood occurrence. Figure 6 - 7<br />
reveals the impact of tidal flood to daily activities.<br />
COMMUNITY’S RESPONSE AND ADAPTIVE CAPACITY<br />
Since the occurrence of tidal flood did not distract the daily activities, it means that the<br />
community relied upon some adaptation methods, which they believe able to rescue their<br />
belongings. The physical adaptation methods relied upon some technique, such as: put the house<br />
property on the higher place – the most economical methods – increase the yard level in<br />
surrounding house, increase the floor level and making small dam to block the water from entering<br />
the house; for the <strong>de</strong>tails see figure 8.<br />
Figure 8. a) heightened housing foundation; b) inundated house; c) small dyke in front of the house; d)<br />
heightened housing type (rumah panggung)<br />
(Source: photo courtesy: Marfai 2009)
Community΄s adaptive capacity due to coastal flooding in… 219<br />
The economical factors are essential in the preference of adaptation method. More than 50%<br />
respon<strong>de</strong>nt claimed to put their belongings on the higher place so that the tidal flood will not ruin it.<br />
Subsequently, the respon<strong>de</strong>nt is familiar with the type of increasing the yard level, since it is more<br />
efficient and relatively cheaper than increasing the floor level. At the latest or<strong>de</strong>r, the technique of<br />
making small dam to block the water is also available.<br />
As the Figure 8-a, <strong>de</strong>scribe that to heightened the housing foundation the type of house is<br />
relatively different with those house in figure 8c. The social economic condition plays an important role<br />
on how the community applied the local adaptation. The traditional and cultural setting in the<br />
community is relatively stagnant, each generation pass through some methods which are relatively<br />
applied by the next generations. These methods had been lasted for almost a <strong>de</strong>ca<strong>de</strong> it means that the<br />
methods of physical adaptation are not dynamic and quite stable as long as the cultural and socioeconomic<br />
condition did not change drastically.<br />
The physical adaptation may be very traditional, efficient and economically feasible for the<br />
community, however the adaptation technique may be classified to improper technique when it<br />
comes to aesthetic point of view and health point of view. The unhealthy environment created by<br />
the tidal flood and the improper technique is sufficient only temporal condition, however for any<br />
longer circumstance it was not fit at all. It is important that the government i<strong>de</strong>ntify the existing<br />
institutional setting to provoke better condition for the research area.<br />
Moreover, Structural measure and non-structural measure to address the problem has<br />
been initiated by the government. The structural measure inclu<strong>de</strong>s the improvement of<br />
drainage system, the pumping stations, the reshaping of land surface and land reclamation<br />
along the beach. The non structural measure inclu<strong>de</strong>s the improvement of the neighborhood<br />
by coastal planning and management (Marfai et al., 2008).<br />
Detailed task force related to tidal flood hazard can be seen in the table 4.<br />
Coastal land use<br />
Table 4. Task force related tidal flood hazard<br />
Subject Plan and measures Agencies<br />
Detail coastal master plan<br />
Monitoring land use change on the coastal area<br />
Law enforcement and implementation of the<br />
regulation system<br />
Garbage disposal<br />
Tidal flood<br />
prevention<br />
Land subsi<strong>de</strong>nce<br />
River and<br />
drainage system<br />
Improvement garbage disposal system<br />
Involving local community on the public awareness<br />
system<br />
Improving of the pol<strong>de</strong>r system<br />
Improving number of pump stations<br />
Monitoring land subsi<strong>de</strong>nce<br />
Monitoring groundwater extraction<br />
Detail drainage master plan<br />
Improving drainage capacity and reduce<br />
sedimentation on the drainage system<br />
Regional <strong>de</strong>velopment board<br />
Public work <strong>de</strong>partment<br />
Public work <strong>de</strong>partment<br />
Municipality health office<br />
Community<br />
Regional <strong>de</strong>velopment board<br />
Public work <strong>de</strong>partment<br />
Public work <strong>de</strong>partment<br />
Mining and geology<br />
<strong>de</strong>partment<br />
Regional <strong>de</strong>velopment board<br />
Public work <strong>de</strong>partment<br />
Water resources <strong>de</strong>partment<br />
The community’s response and physical adaptation strategy is fourfold respectively due to<br />
economic feasibility, level of un<strong>de</strong>rstanding and simplicity of the technique.<br />
The physical adaptation is quite stable for longer terms since it involved the other<br />
resource such as financial resource per household. Rather to have better improved<br />
environment, the community from time to time live in the <strong>de</strong>teriorating environment, which<br />
cannot support any better wellbeing. Thus, the physical adaptation is seemingly neglected and<br />
lack of any update technology.<br />
However, since the community aware of any up-date information regarding the<br />
correlation between sea level rise, tidal inundation and land subsi<strong>de</strong>nce, they appeared open
220<br />
Mush Aris MARFAI, Dyah R HIZBARON<br />
toward any empowerment program. By doing so, the government could at least approach the<br />
community to keep up to date about their <strong>de</strong>teriorating environment, thus any adaptation<br />
should not just relied on the economic feasibility but also to the health consi<strong>de</strong>ration and<br />
any aesthetic environment consi<strong>de</strong>ration.<br />
CONCLUSIONS<br />
The community is in<strong>de</strong>pen<strong>de</strong>nt in finding their solution towards the hazards in the area. The<br />
hazard is no longer consi<strong>de</strong>red as threat towards their wellbeing. Instead of taking it as the threat or risk,<br />
the community in the research area tends to neglect the hazard.<br />
The community’s response and adaptive capacity in the research area is unique, <strong>de</strong>pends<br />
on the type of the economic background and know-how technology. The coastal community has<br />
respon<strong>de</strong>d the flooding by physical adaptive capacity, which is quite stable from time to time.<br />
Therefore, such an institutional adaptive capacity, such as governmental action plan is nee<strong>de</strong>d in<br />
or<strong>de</strong>r to have a better strategy and response toward tidal flood. More training, forum group<br />
discussion, and other community empowerment will be an advantage to improve the community<br />
un<strong>de</strong>rstanding and enhance their know-how technology.<br />
ACKNOWLEDGEMENT<br />
This article is <strong>de</strong>veloped from research project on Coastal risk management in Semarang<br />
City. Part of the research is supported by Young researcher grant project, International Foundation<br />
for Science (IFS), Swe<strong>de</strong>n and Science & technology research grant, Indonesia Toray science<br />
foundation, Japan. The authors express their gratitu<strong>de</strong> to the reviewers for their helpful advice.<br />
REFERENCES<br />
Adger W. N., Brooks N., Bentham G., Agnew M., Eriksen S. (2004), New Indicators of vulnerability and adaptive<br />
capacity. Tyndall Centre for Climate Change Research;<br />
Arbriyakto D., Kardyanto D. (2001), I<strong>de</strong>ntifikasi Pengukuran Kerugian Fisik Bangunan Rumah dan Kerugian Sosial<br />
Penduduk Kawasan Pantai Kota Semarang. Kerugian pada Bangunan dan Kawasan Akibat Kenaikan Muka Air<br />
Laut pada Kota-Kota Pantai di Indonesia;<br />
Dewi A. (2007), Community-based analysis of coping with urban flooding: a case study in Semarang, Indonesia. M.Sc.<br />
thesis, ITC, Ensche<strong>de</strong>, The Netherlands;<br />
Gunawan B. (2001), Kenaikan Muka Air Laut dan Adaptasi Masyarakat. Seminar Dampak Timbal Balik Antar<br />
Pembangunan Kota dan Perumahan dan Lingkungan Global, Dampak Kenaikan Muka Air Laut pada Kota-Kota<br />
Pantai di Indonesia. Bandung.<br />
Kobayashi H. (2003), Vulnerability assessment and adaptation strategy to sea-level rise in Indonesian coastal<br />
urban areas. Tsukuba-city, Japan, National Institute for Land and Infrastructure Management; Ministry of<br />
Land, Infrastructure and Transport;<br />
Luers A., Lobell D., Sklar L., Addams C. L., Matson P. (2003), A method for quantifying vulnerability, applied to the<br />
agricultural system of the Yaqui Valley, Mexico, Global Environmental Change 13 , 255 - 267;<br />
Marfai M. A., (2003), GIS mo<strong>de</strong>lling of river and tidal flood hazard on a coastal urban Area, a case study: Semarang city,<br />
Central Java, Indonesia, M.Sc Thesis ITC, Ensche<strong>de</strong>, The Netherlands;<br />
Marfai M. A., (2004a), Tidal Flood Hazard Assessment: Mo<strong>de</strong>lling in Raster GIS, Case in Western Part of Semarang<br />
Coastal Area, Indonesian Journal of Geography, Vol 36, Number 1, June 2004. ISSN 0024-9521 Page 25-38;<br />
Marfai MA., (2004b), Spatial Mo<strong>de</strong>lling of Tidal Flood Hazard on East Semarang Coastal Area, Journal of Forum<br />
Geografi, Indonesia. Vol 18, No 1, July 2004. ISSN 0852-2682. Page 60-69;<br />
Marfai M. A., King L. (2007), Monitoring Land Subsi<strong>de</strong>nce in Semarang, Indonesia, Environmental Geology, 651 - 659;<br />
Marfai M. A.. King L. (2008a), Coastal flood management in Semarang, Indonesia, Environmental Geology 55: 1507-1518;<br />
Marfai M. A., King L. (2008b), Potential vulnerability implications of coastal inundation due to sea level rise for the<br />
coastal zone of Semarang city, Indonesia, Environemntal Geology 54: 1235-1245;<br />
Marfai A., King L. (2008c), Tidal inundation mapping un<strong>de</strong>r enhanced land subsi<strong>de</strong>nce in Semarang, Central Java<br />
Indonesia, Natural Hazards, 93 - 109;<br />
Marfai M. A., King L, Sartohadi J., Sudrajat S., Budiani S. R., Yulianto F. (2008), The impact of tidal flooding on a coastal<br />
community in Semarang, Indonesia, Environmentalist, 28: 237-248;<br />
Miller E. S., Weitz C. A. (1979), An Introduction to Anthropology, New York: Prentice Hall Inc;<br />
Moran E. F. (1982), Human adaptability: An introduction to Ecological Anthropology,Westview Press Inc: Colorado;
Community΄s adaptive capacity due to coastal flooding in… 221<br />
Soedarsono S. (1996), Impact of flood inundation due to sea level rise on the settlement area in Semarang City, (in<br />
Indonesian). Master Thesis, Geography Faculty, Gadjah Mada University, Indonesia;<br />
Sugiyono S. (2007), Meto<strong>de</strong> Penelitian Kuantitatif Kualitatif Dan R&D, Bandung: PT Alfabeta Bandung;<br />
Thomalla F., Downing T., Spranger-Siegfried E., Han G., Rockstrom J. (2007), Reducing human vulnerability to climaterelated<br />
hazards: Towards a common approach between the climate change adaptation and the disaster risk<br />
reduction communities, Swedia: SEI Risk, Livelihoods and Vulnerability Programme;<br />
Twigg J. (2007), Characteristics of a Disaster-Resilient Community: A Guidance Note, DFID Disaster Risk Reduction<br />
Interagency Coordination Group;<br />
*** (2002), Development Planning Board (DPB), Semarang city planning 2000–2010 (in Indonesian), Development<br />
Planning Board of Semarang, Government of Semarang, Indonesia;<br />
*** (2008), Directorate-of-Geology-and-Environment-of-Bandung (BGR), Detection of land subsi<strong>de</strong>nce in<br />
Semarang/Indonesia using persistent scatterer interferometry (PSI). Retrieved October 28, 2008, from<br />
http://www.bgr.bund.<strong>de</strong>/nn_337150/EN/Themen/GG__Fernerkundung/Projektbeitraege/indonesia__mitigation__g<br />
eorisks__psi.html<br />
Submitted: Revised: Accepted and published online<br />
June 24, 2011 September 07, 2011 November 22, 2011
Analele UniversităŃii din Ora<strong>de</strong>a – Seria Geografie Year XXI, no. 2/2011 (December), pp. 222-232<br />
ISSN 1454-2749, E-ISSN 2065-1619 Article no. 212107-527<br />
DOWNSTREAM VARIATION IN PARTICLE SIZE: A CASE STUDY OF<br />
THE TROTUŞ RIVER, EASTERN CARPATHIANS (ROMANIA)<br />
Dan DUMITRIU ∗<br />
„Alexandru Ioan Cuza” University of Iaşi,<br />
B-dul Carol I, no 11, 700506, Iaşi, Romania, e-mail: dndumitriu@yahoo.com<br />
Daniel CONDORACHI<br />
„Alexandru Ioan Cuza” University of Iaşi,<br />
B-dul Carol I, no 11, 700506, Iaşi, Romania, e-mail: condordan@yahoo.com<br />
Mihai NICULIłĂ<br />
„Alexandru Ioan Cuza” University of Iaşi,<br />
B-dul Carol I, no 11, 700506, Iaşi, Romania, e-mail: mn_geogr@yahoo.com<br />
Abstract: In or<strong>de</strong>r to analyze Trotuş river bed <strong>de</strong>posits granulometry 21 sampling point were<br />
chosen, located at about 7 km each other. After field and lab analysis it was noticed that there<br />
is a general downstream reduction trend for clasts size, but only if we consi<strong>de</strong>r extreme<br />
sampling points (headwaters and outflow). Trotuş midcourse display a downstream<br />
coarsening phenomenon, influenced by tributaries and slope processes that <strong>de</strong>liver much<br />
coarser materials than the ones stacked within river bed <strong>de</strong>posits.<br />
Keywords: bed sediment, grain size, median grain size, downstream fining, downstream coarsening<br />
* * * * * *<br />
INTRODUCTION<br />
The nature of river bed sediments, also bank sediments have an important influence on<br />
rivers’ morphological and hydro-dynamic characteristics. Also is involved in rivers’ solid<br />
flow formation and components. In this context, grain size analyses may bring significant<br />
information regarding solid flow, sediment sources, their behavior at river bed <strong>de</strong>posits fluvial<br />
processing, etc. That’s why reports and studies on river bed sediments size have a long<br />
tradition perhaps of their practical nature. First reports were linked of downstream fining<br />
(Leonardo da Vinci, 1504 - 1506; Guglielmini, 1697; Frisi, 1762) (Gomez et al., 2001). These<br />
reports and the next ones foun<strong>de</strong>d the law stated by Sternberg (1875) according which grain<br />
size <strong>de</strong>crease exponentially with the travel distance.<br />
Starting from this finding, many studies focused on this process of river bed particle<br />
size <strong>de</strong>crease known as downstream fining. Was consi<strong>de</strong>red that this phenomenon has as main<br />
cause one of the following processes: fine particle selective transport or selective sorting<br />
(Paola et al., 1992; Ferguson et al., 1996; Wilcock, 1997; Gasparini et al., 1999; Hoey and<br />
∗ Corresponding Author<br />
http://istgeorelint.uora<strong>de</strong>a.ro/Reviste/Anale/anale.htm
Downstream Variation in Particle Size: A Case Study of the Trotuş River … 223<br />
Bluck, 1999; Montgomery et al., 1999); abrasion (Krumbein, 1941; Bradley, 1970; Schumm<br />
and Stevens, 1973; Parker, 1991a, 1991b, 1991c; Kodama, 1994; Malarz, 2005); in situ clast<br />
weathering during storage (Bradley, 1970; Heller et al., 2001), and the spatial distribution of<br />
sources for resistant lithologies (Pizzuto, 1995).<br />
In certain cases a <strong>de</strong>viation from the normal trend of downstream fining called<br />
downstream coarsening was reported, and some factors were responsible for this: tributaries<br />
influence (Miller, 1958; Knighton, 1980; Rice, 1998, 1999); direct river channel inputs of<br />
materials by slope processes where floodplain is missing (Benda, 1990; Grant and Swanson,<br />
1995; Grimm et al., 1995; Lambert et al., 1996; Rice and Church, 1996; Church, 2002;<br />
Brummer and Montgomery, 2003; Attal and Lavé, 2006). Recent studies focused on the grain<br />
size and shape within river beds insist on relationships between source area characteristics and<br />
river bed sediments characteristics (Desloges, 1990; Mikoŝ, 1994; Ichim et al., 1998; Moussavi-<br />
Harami et al., 2004; Farrow and Sklar, 2005; Malarz, 2005; Stanley et al., 2006; Attal and Lavé,<br />
2006; Lindsey et al., 2007; Rengers and Wohl, 2007; Rădoane at al., 2007, 2008; Mureşan,<br />
2009; Miao et al., 2010; Pike et al., 2010; Venditti et al., 2010).<br />
STUDY AREA<br />
Trotuş drainage basin is located in central-eastern part of Eastern Carpathians and<br />
Moldavian Subcarpathians and has about 4,350 sqkm and a length of about 160 km (figure 1).<br />
Between headwaters and Siret confluence, the altitu<strong>de</strong> difference is about 1,290 m (from 1,360 m<br />
altitu<strong>de</strong> at headwaters to 70 m altitu<strong>de</strong> at confluence). Trotuş River is of VIII th or<strong>de</strong>r in Strahler<br />
classification. The catchment area lies on four distinct structural and lithological units: marginal<br />
syncline, carpathian flysch, pericarpathian molasse and the platform.<br />
Petrographically, in the four litho-stratigraphical units dominate the following lithology: 40%<br />
clayey silty rocks; 35% sandstones of different types; 18% quaternary <strong>de</strong>posits (gravels, sands,<br />
loams, clays); 5% crystaline schysts, limestones and dolomites; 2% menilites, disodiles etc.<br />
Average annual rainwater spans from 722 mm / yr in Trotuş Valley and almost 1,000<br />
mm/yr in higher mountains. These values drop down about 100 mm/yr in central part of<br />
Dărmăneşti Depression and towards the subcarpathians limit. Average annual discharge for<br />
Trotuş River, recor<strong>de</strong>d at Vrânceni hydrometric station, is of 33 3 /s while maximum was of<br />
3,720 m 3 /s, recor<strong>de</strong>d in 29 th of July 1991.<br />
Figure 1. Study area location
224<br />
Dan DUMITRIU, Daniel CONDURACHI, Mihai NICULIȚĂ<br />
MATERIALS AND METHODS<br />
In this study was used volumetric sampling for river channel sediments that uses sampling<br />
for surface layers or pavement layer and subsurface layer or subpavement layer (Mosley and<br />
Tindale, 1985; Church et al., 1987; Ichim et al., 1992) (figure 2). This sampling method consists in<br />
drawing of three sampling categories: surface sample (from the layer called hydraulic layer or<br />
pavement of which thickness is equal with the diameter of the largest clast); subsurface sample (or<br />
subpavement - material located un<strong>de</strong>r hydraulic layer); a global sample (obtained by summing up<br />
the previous sampling categories).<br />
Figure 2. The illustration of the arrangement mo<strong>de</strong> of the bed <strong>de</strong>posits<br />
After setting up the sampling method and sampling points (21 channel sections at a distance<br />
of 7 km of each other) (figure 3) topometric measurements were ma<strong>de</strong>, for each sampling point, to<br />
precisely assess the slope of the river channel and floodplain. Then, using the method proposed by<br />
Mosley and Tindale (1985), that states that the weight of the largest clast from sampled area is 5%<br />
from total weight of the sample, the clast with the largest diameter was i<strong>de</strong>ntified. This was<br />
weighted to know the quantity of the sampled probe area. One square meter area was chosen as<br />
being representative for the entire section, out of which were collected surface and subsurface<br />
gravel. Some of granulometric fractions were sieved directly in the field using a set of sieves with<br />
holes having diameters according to the Wentworth scale. Sieving holes were of 64 mm (-6 phi),<br />
32 mm (-5 phi), 16 mm (-4 phi), 8 mm (-3 phi). The clasts with diameters between 128 - 256 mm<br />
were measured and weighted using a special calliper. For the ones larger than 256 mm, more<br />
difficult to be weighted in the field, a diameter-weight scale conversion was used (Church et al.,<br />
1987; Ichim et al., 1992) built on the basis of the river clasts that were investigated by evaluating<br />
the weight of the biggest clasts on the basis of the B axis.<br />
Figure 3. Sediment sample point distribution<br />
After all the sampled material was weighted, from each class (piles of gravel were ma<strong>de</strong> on<br />
each class) sample clasts were taken from each class. It was randomly picked 100 clasts from<br />
classes of 16 - 32 mm and 32 - 64 mm for morphometrical and petrographical lab analysis. For the
Downstream Variation in Particle Size: A Case Study of the Trotuş River … 225<br />
material smaller than 8 mm, sieving was continued in the lab using sieves of smaller diameter (6;<br />
5; 2; 1; 0.5; 0.2; 0.1 mm). From the obtained results there were ma<strong>de</strong> assessments on differences<br />
from pavement and subpavement, on median diameter of river bed <strong>de</strong>posits, on the percentage of<br />
each granulometric fractions, clasts morphometry, lithology etc. Global samples (by summing<br />
pavement and subpavement samples) were separated in 14 granulometric classes, at 1 phi interval,<br />
on five dimensional steps, according with Wentworth scale (Church et al., 1987), as follows: a) silt<br />
+ clay (< 4 phi or 0.063 mm); b) sand (between 4 phi or 0.063 mm and - 1 phi or 2 mm); c)<br />
gravel (between - 1 phi or 2 mm and - 6 phi or 64 mm); d) cobble (between - 6 phi or 64 mm and<br />
- 8 phi or 256 mm); e) boul<strong>de</strong>r (over - 8 phi or 256 mm).<br />
RESULTS AND DISCUSSION<br />
MEDIAN DIAMETER OF BED MATERIAL<br />
Regarding median diameter of Trotus River bed particles was noticed a general ten<strong>de</strong>ncy of<br />
grain size reduction between the extreme two sampling points (from 38 mm at FăgeŃel, located at<br />
7.1 km from headwaters, to 27 mm at Burcioaia, at 160 km distance from headwaters). Out of this<br />
general ten<strong>de</strong>ncy, among main confluences or where Trotus valley becomes narrower, positive and<br />
negative <strong>de</strong>viations were recor<strong>de</strong>d. Second polynomial function fitted at best general variation<br />
ten<strong>de</strong>ncy for median diameter that helped to separate four sectors (figure 4). Therefore, upper<br />
course (downstream confluence with Valea Rece) average median diameter is around 62 mm, then<br />
down to Ciobănuş confluence to be around 92 mm. A slight reduction was reported downstream<br />
Ciobănuş confluence, but not of great importance for general features of river bed <strong>de</strong>posits from<br />
this short section between Ghimeş and Asău. Median diameter grow ten<strong>de</strong>ncy in midcourse reach<br />
a maximum downstream Asău, after which a reduction is reported within Comăneşti Depression.<br />
Median diameter (D50), mm<br />
140<br />
120<br />
100<br />
80<br />
60<br />
40<br />
20<br />
0<br />
D50 = -0,011L2 + 1,5411L + 43,287<br />
R = 0,809<br />
0 10 20 30 40 50 60 70 80 90 100 110 120 130 140 150 160<br />
Distance downstream (L), km<br />
Figure 4. Downstream variation in the median diameter of the bed material<br />
A second maximum is reported in the exit sector from Depression and entrance in<br />
subcarpathian area. Downstream Perchiu section median diameter variation records a constant<br />
reduction except a small increase after Tazlău confluence. Concluding, three sectors were separated<br />
that have the lowest median diameter (FăgeŃel - Valea Rece; insi<strong>de</strong> Comăneşti Depression; lower<br />
course downstream Tazlău confluence) and another one in mid course, in which D 50 values are, in<br />
average, above 90 mm. These high values for median diameter may be caused by sediments inputs<br />
from the short tributaries and high longitudinal slopes that <strong>de</strong>liver coarse material in Trotuş channel,<br />
on one hand, and slope feeding, on the other hand, as this sector is located in an area where is a<br />
valley narrowing at the entrance and exit from Comăneşti Depression. In this narrow areas slopes<br />
have an important role in feeding the river channel with coarse materials.<br />
SURFACE BED MATERIAL GRANULOMETRIC SPECTRUM<br />
This has a variation ten<strong>de</strong>ncy that, in general, is close to perfect, with a downstream<br />
increase share for small gravel size, where boul<strong>de</strong>rs and cobbles are replaced by gravel. It cannot<br />
be said that is an i<strong>de</strong>al distribution, as the competition is just between cobbles and gravels.<br />
Usually, in river bed <strong>de</strong>posits classes of grain size particles becomes smaller and their share
226<br />
Dan DUMITRIU, Daniel CONDURACHI, Mihai NICULIȚĂ<br />
increase exponentially downstream. In this particular case grains from silt, clay and loam classes<br />
do not record any increase in share, on the contrary, their share display a reduction. This anomaly<br />
is present for certain clasts dimension in river bed <strong>de</strong>posits. For Trotuş River, boul<strong>de</strong>r and cobble<br />
clasts are not specific, in particular, for upper course, but for midcourse sectors (figure 5).<br />
100%<br />
80%<br />
60%<br />
40%<br />
20%<br />
0%<br />
7,1 13,5 21,8 25 31,2 37 42,6 50,5 59,4 66 73,1 78 89,6 98,1 106 119 126 140 148 154 159<br />
Distance downstream, km<br />
>256 mm 64 - 256mm 2. - 64 mm 2 - 0.063 mm < 0.063 mm<br />
Figure 5. Downstream variation in the grain size distribution of the surface channel <strong>de</strong>posits<br />
Cobbles (64 - 256 mm) is the granulometric class with the largest share within pavement. In<br />
certain sampling sections (especially in the midcourse) this class share is about or over 80% (Valea<br />
Rece, Palanca, Beleghet, Ciobănuş, Asău, Păgubeni, Târgu Trotuş). As in the case of median<br />
diameter, the function that better adjusts variation ten<strong>de</strong>ncy for cobbles along longitudinal profile<br />
is the polynomial one, that i<strong>de</strong>ntifies almost the same sectors, but with a small value for Comăneşti<br />
Depression. Cobble class has a constant increase after FăgeŃel sampling point (46.67%) until<br />
Trotuş entrance in Depression (Asău - 89.44%) and after a <strong>de</strong>crease of about 15% at Comăneşti, a<br />
new sharp increase is reported downstream Uz confluence (82.1%). In subcarpathian and plateau<br />
areas cobble class loses its significant chare, but a significant anlomaly is recor<strong>de</strong>d downstream<br />
Trotuş confluence with Oituz, Caşin and Tazlău (figure 6).<br />
(%)<br />
100,00<br />
90,00<br />
80,00<br />
70,00<br />
60,00<br />
50,00<br />
40,00<br />
30,00<br />
20,00<br />
10,00<br />
0,00<br />
Dc = -0,0067L 2 + 0,7872L + 57,589<br />
R = 0,870<br />
0 20 40 60 80 100 120 140 160<br />
Distance downstream, km<br />
Figure 6. Cobble variation share within pavement along Trotuş River<br />
(%)<br />
100,00<br />
90,00<br />
80,00<br />
70,00<br />
60,00<br />
50,00<br />
40,00<br />
30,00<br />
20,00<br />
10,00<br />
0,00<br />
D = 0,0078L 2 - 0,9657L + 43,393<br />
R = 0,874<br />
0 20 40 60 80 100 120 140 160<br />
Distance downstream, km<br />
Figure 7. Gravel variation share within pavement along Trotuş River
Downstream Variation in Particle Size: A Case Study of the Trotuş River … 227<br />
Gravel class (2 - 64 mm) within pavement displays an inverse relation with cobble<br />
class along longitudinal profile. In the upper course has about 50% then <strong>de</strong>creases slowly<br />
downward to Asău (2.58%) and Mosoreni (5.66%). Outsi<strong>de</strong> mountain area, correlated with<br />
cobble share <strong>de</strong>crease, there is a constant increase for gravel clasts with a maximum value of<br />
84.41% at Adjud (figure 7).<br />
Blocks class (over 256 mm) are specific only to pavement in Trotuş midcourse, where the<br />
valley has many narrow sectors and slope materials feed directly the river channel.<br />
Sand class (2 - 0.063 mm) has a small share of only 4% in Comăneşti Depression, upstream<br />
Uz confluence, which is explained by river slope reduction that allow „gra<strong>de</strong>d” gravel formation.<br />
SUBPAVEMENT DEPOSITS GRANULOMETRIC SPECTRUM<br />
This is characterized by gravel (2 - 64 mm) and sands (2 - 0.063 mm) dominance. In the<br />
sampling sections located downstream Tazlău confluence, these two classes can hold over 90%<br />
from river bed <strong>de</strong>posits granulometric spectrum (figure 8). Out of mountain area Trotuş has no<br />
important tributaries that can significantly influence river bed <strong>de</strong>posits granulometry. Also<br />
proximity slopes to river channel and river banks <strong>de</strong>liver only fine materials and the <strong>de</strong>crease of<br />
river slope <strong>de</strong>termines a grain sorting that trigger downstream fining. Of course, in the river<br />
midcourse gravel and sand share <strong>de</strong>crease on cobble favour (50% at Ghimeş, 52.6% at<br />
Brusturoasa, 70% at Asău, 50% at Mosoreni and Târgu Trotuş). In this sector, tributaries and<br />
slopes constantly feed Trotuş river bed with much coarser materials that in most cases cannot be<br />
transported and were stocked and has un<strong>de</strong>rgone in situ processing.<br />
From figures 8 and 9 it can be said that, finally, for sub-pavement <strong>de</strong>posits it can be<br />
reported an i<strong>de</strong>al distribution, which is disturbed in river midcourse, like all other river bed<br />
<strong>de</strong>posits qualitative characteristics. Second polynomial functions <strong>de</strong>scribe at best variation<br />
ten<strong>de</strong>ncies for gravel and cobble share within pavement <strong>de</strong>posits (i.e. certain gradual<br />
„vanishing” for clasts with larger size).<br />
100%<br />
80%<br />
60%<br />
40%<br />
20%<br />
0%<br />
7,1 13,5 21,8 25 31,2 37 42,6 50,5 59,4 66 73,1 78 89,6 98,1 106 119 126 140 148 154 159<br />
Distance downstream, km<br />
>256 mm 64 - 256mm 2. - 64 mm 2 - 0.063 mm < 0.063 mm<br />
Figure 8. Subpavement granulometric spectrum<br />
100,00<br />
80,00<br />
(%)<br />
60,00<br />
40,00<br />
20,00<br />
0,00<br />
0 20 40 60 80 100 120 140 160<br />
Distance downstream, km<br />
Very coarse pebble<br />
Coarse pebble<br />
Figure 9. Cobble (64 - 256 mm) and gravel (2 - 64 mm) variation share within subpavement <strong>de</strong>posits,<br />
along Trotuş River
228<br />
Dan DUMITRIU, Daniel CONDURACHI, Mihai NICULIȚĂ<br />
RIVER BED DEPOSITS GLOBAL GRANULOMETRIC SPECTRUM<br />
River bed <strong>de</strong>posits global granulometric spectrum reflects both pavement and subpavement<br />
characteristics. The dominance of cobbles and boul<strong>de</strong>rs in pavement materials gibes<br />
Trotuş <strong>de</strong>posits a coarse facies, from headwaters to outflow, while sub-pavement sands make some<br />
„enhancement” of materials sizes, as fine materials share are increasing downstream (figure 10).<br />
100%<br />
80%<br />
60%<br />
40%<br />
20%<br />
0%<br />
7,1 13,5 21,8 25 31,2 37 42,6 50,5 59,4 66 73,1 78 89,6 98,1 106 119 126 140 148 154 159<br />
Distance downstream, km<br />
>256 mm 64 - 256mm 2. - 64 mm 2 - 0.063 mm < 0.063 mm<br />
Figure 10. Trotuş River bed <strong>de</strong>posits global granulometric spectrum<br />
In spite of this, sands barely succeed to have over 10% in several sampling sections, while silt<br />
and clay have less than 1%. In this way, cobbles and gravels, from most sampling points, hold<br />
toghether over 90% from granulometric spectrum, which allow us to put Trotuş River in the category<br />
of gravel bed river.<br />
TROTUŞ RIVER BANKS SEDIMENTS GRANULOMETRY<br />
River banks sediments (sampled in 17 out of 21 cross sections for floodplain<br />
geomorphological complex) have median diameter between 0.04 - 0.35 mm (figure 11).<br />
Median diameter, mm<br />
0,4<br />
0,35<br />
0,3<br />
0,25<br />
0,2<br />
0,15<br />
0,1<br />
0,05<br />
0<br />
0 50 100 150<br />
Distance downstream, km<br />
Figure 11. Trotuş River banks <strong>de</strong>posits median diameter variation<br />
100%<br />
gravel<br />
90%<br />
80%<br />
70%<br />
sand<br />
60%<br />
50%<br />
40%<br />
30%<br />
20%<br />
silt<br />
10%<br />
0%<br />
clay<br />
7,1 13,5 21,8 25 42,6 50,5 59,4 66 73,1 78 89,6 98,1 105,5 118,5 125,5 139,5 159<br />
Distance downstream, km<br />
Figure 12. Trotuş River banks <strong>de</strong>posits granulometric variation
Downstream Variation in Particle Size: A Case Study of the Trotuş River … 229<br />
Gravels are reported sporadically, as lenses that indicate either former river channels, or<br />
some influences ma<strong>de</strong> of some tributaries (Ciobănuş, Slănic).<br />
Along river longitudinal profile, confluences and local petrographic facies disturb the<br />
ten<strong>de</strong>ncy of granulometric size <strong>de</strong>crease. Most important influences are reported at Ciobănuş and<br />
Slănic confluences.<br />
Trotuş River banks are, in general, sandy (in most cases over 70%), but between<br />
confluences is was reported an increase of silt and clay share (40% at Beleghet and Perchiu, 32%<br />
at Burcioaia, 30% at Comăneşti) (figure 12).<br />
MODALITY OF THE GRAIN SIZE DISTRIBUTIONS<br />
Granulometric distribution can be analysed by graphics interpretation for each sampling<br />
point along the river. In this way, from graphics shape it can be assessed if granulometric<br />
distribution is unimodal, which means that the material is quasi-unifom regarding particle size (in<br />
this case can be composed only of gravel cobble blocks, or only by sand and other fine sediments)<br />
or bimodal (and in some cases poly-modal) when are present gravel and sand <strong>de</strong>posits. Linked<br />
with composition share of the two most important classes to form mixes it is consi<strong>de</strong>red that the<br />
i<strong>de</strong>al mix would be 70% gravel and 30% sand, which is i<strong>de</strong>ntical with the ones proposed by<br />
Ibbeken (1983) and Ibbeken and Schleyer (1991) for river bed <strong>de</strong>posits in their lower course for<br />
Calabrian rivers. Rădoane et al. (2001, 2006, 2008) indicate that, for the Romanian studied rivers,<br />
bimodality is <strong>de</strong>termined by un<strong>de</strong>r 25% for 1 - 20 mm fraction, which is consi<strong>de</strong>red a fundamental<br />
element in river <strong>de</strong>posits distribution formation.<br />
For Trotuş River the modality of the grain size distribution was analysed separately for<br />
surface, subsurface and for the global sample. Based on individual share for cobbles, gravels,<br />
sands and silty-clayey particles that compose river bed <strong>de</strong>posits, histogram distributions were<br />
calculated. Based on these graphs was settled that the distribution is unimodal (was noted as<br />
modality 1) or bimodal (modality 2). From figure 13 histograms one can notice that:<br />
(%)<br />
90<br />
80<br />
Cobble Gravel Sand<br />
70<br />
60<br />
50<br />
40<br />
A.<br />
30<br />
20<br />
10<br />
0<br />
-9 -8 -7 -6 -5 -4 -3 -2 -1 0 1 2 3 4
230<br />
Dan DUMITRIU, Daniel CONDURACHI, Mihai NICULIȚĂ<br />
- bimodality has a very slight increase downstream Trotuş River and has a correlation<br />
coefficient of 0.222. For the rivers of which river bed <strong>de</strong>posits are ma<strong>de</strong> of materials with very<br />
different sizes, was reported, as a general rule, that for the upper course is specific a unimodal<br />
distribution, and in lower course a bimodal distribution (Ibbeken şi Schleyer, 1991; Kodama,<br />
1992; Sambrook Smith, 1996; Ichim et al., 1998; Rădoane et al., 2001, 2006, 2008). Bimodal<br />
distribution is reported in only one section (CăiuŃi) and only for sub-pavement and global sample;<br />
- bimodality has an inverse relationship with Trotuş River channel slope. As the river slope<br />
reduces itself (within Comăneşti Depression and after Trotuş exits from mountain area) a weak<br />
bimodal distribution was reported;<br />
- bimodality has an indirect relationship with median diameter variation for river bed<br />
<strong>de</strong>posits. For Trotuş River bimodality is manifest together with D 50 <strong>de</strong>crease, explained by share<br />
reduction for cobble and gravel and increased share for fine sediments (sand and silt);<br />
- bimodality is in direct relationship with the percentage of sand, gravel and 1 - 20 mm fraction;<br />
- bimodality of granulometric distribution is different from the pavement and sub-pavement<br />
samples. Trotuş granulometric distribution for pavement <strong>de</strong>posits is exclusively unimodal. Subpavement<br />
samples, along with an increase of fine sediments display a slight bimodal ten<strong>de</strong>ncy.<br />
CONCLUSIONS<br />
The obtained results have the same consistency with the ones reported by other authors that<br />
studied different Romanian rivers (Ichim et al., 1998, Maria Rădoane et al., 2001, 2006, 2008).<br />
Their main conclusion, and verified on Trotuş River, was that large geological and<br />
geomorphological units that east Carpathian rivers cross them diagonally has as a result certain<br />
granulometric clustering along river drainage channel.<br />
This phenomenon was well emphasized by using a triangulated diagram which display a<br />
clear discrimination among cobble (> -6 phi), gravel (-6 phi -1 phi), sand (-1 phi -4 phi), silt and<br />
clay (< 4 phi). From figure 14 some conclusions can be drawn:<br />
Figure 14. The change of Trotuş granulometric spectrum in relationship with geomorphological units<br />
- carpathian area groups the sampling sections in which cobbles and boul<strong>de</strong>rs have a large<br />
share in river bed sediments composition of about 60 - 80%. The cluster from Carpathian area is<br />
well shaped in the right corner;<br />
- subcarpathian area is composed by sections where dominates gravel, and the cluster is<br />
located in the upper center part of the diagram.
Downstream Variation in Particle Size: A Case Study of the Trotuş River … 231<br />
River bed materials orting was done in a long competition process between sorting and<br />
sediment abrasion during fluvial transport. Fluvial processing rock resistance, river channel slope<br />
and the strength of fluvial transport individualized each river (Ichim et al., 1998, Maria Rădoane et<br />
al., 2001, 2006, 2008).<br />
ACKNOWLEDGMENT<br />
This work was supported by CNCSIS - UEFISCSU, project PNII - IDEI number 436/2007.<br />
REFERENCES<br />
Attal M., Lavé J. (2006), Changes of bedload characteristics along the Marsyandi River (central Nepal): Implications for<br />
un<strong>de</strong>rstanding hillslope sediment supply, sediment load evolution along fluvial networks, and <strong>de</strong>nudation in active<br />
orogenic belts. In Willett, S.D., Hovius, N., Brandon, M.T., and Fisher, D., eds., Tectonics, Climate, and<br />
Landscape Evolution: Geological Society of America Special Paper 398, 143 - 171;<br />
Benda L. E. (1980), The influence of <strong>de</strong>bris flows on channels and valley floors in the Oregon Coast Range, U.S.A. Earth<br />
Surf. Process. Landforms, 15, 457- 466;<br />
Bradley W. C. (1970), Effect of weathering on abrasion of granitic gravel, Colorado River (Texas). Geol. Soc. Am. Bull., 81, 61- 80;<br />
Brummer C. J., Montgomery D. R. (2003), Downstream coarsening in headwater channels. Water Resour. Res., 39, 10, 1294, 14 p;<br />
Church M.A., McLean D.G., Wolcott J.F. (1987). River bed gravels: sampling and analysis. In Sediment Transport in<br />
Gravel-Bed Rivers, Thorne, CR, Bathurst, JC, Hey RD (eds). Wiley: Chichester; 43 - 79;<br />
Church M. (2002), Geomorphic thresholds in riverine landscapes. Freshwater Biol., 47, 541 - 557;<br />
Desloges J. R. (1990), Sources for valley-fill alluvial sediments: Bella Coola river basin, British Columbia. Canadian<br />
Geographer , 34, 2, 98 - 109;<br />
Farrow J. W., Sklar L. S. (2005), Lithologic influence and experimental variability in gravel abrasion. Implications for<br />
predicting rates of downstream fining of river bed sediments. Geological Society of America, 37, 4, 40, 101st<br />
Annual Meeting (April 29 - May 1, 2005) San Jose, California;<br />
Ferguson R., Hoey T., Wathen S.J., Werritty A. (1996), Field evi<strong>de</strong>nce for rapid downstream fining of river gravels<br />
through selective transport. Geology, 24, 2, 179 - 182;<br />
Gasparini N. M., Tucker G. E., Bras R. L. (1999), Downstream fining through selective particle sorting in an equilibrium<br />
drainage network. Geology, 27, 12, 1079 - 1082;<br />
Gomez B., Rosser B. J., Peacock D. H., Hicks D. M., Palmer J. A. (2001), Downstream fining in a rapidly aggrading<br />
gravel bed river. Water Resour. Res., 37 (6), 1813 - 1823;<br />
Grant G. E., Swanson F. J. (1995), Morphology and processes of valley floors in mountain streams, western Casca<strong>de</strong>s,<br />
Oregon. Natural and Anthropogenic Influences in Fluvial Geomorphology: The Wolman Volume,<br />
Geophys.Monogr. Ser, 89, edited by John E. Costa et al., 83 - 101, AGU, Washington, D. C;<br />
Grimm M. M., Wohl E. E., Jarrett R. D. (1995), Coarse-sediment distribution as evi<strong>de</strong>nce of an elevation limit for flash<br />
flooding, Bear Creek, Colorado. Geomorphology, 14, 199 - 210;<br />
Heller P. L., Beland P. E., Humphrey N. F., Konrad S. K., Lynds R. M., McMillan M. E., Valentine K. E., Widman Y.<br />
A., Furbish D. J. (2001), Paradox of downstream fining and weathering-rind formation in the lower Hoh River,<br />
Olympic Peninsula, Washington. Geology, 29, 971- 974;<br />
Hoey T. B., Bluck B. J. (1999), I<strong>de</strong>ntifying the controls over downstream fining of river gravels. Journal of Sedimentary<br />
Research, 69, 1, 40 - 50;<br />
Ibbeken H. (1983), Jointed source rock and fluvial gravels controlled by Rosin’s law: a grain size study in Calabria, South<br />
Italy. Journal of Sedimentary Petrology, 53, 1213 - 1231;<br />
Ibbeken H., Schleyer R. (1991), Source and sediment. A case study of provenance and mass balance at an active plate<br />
margin (Calabria, Southern Italy). Springer Verlag, Berlin, 285 p;<br />
Ichim I., Radoane Maria, Radoane N. (1992), Eşantionarea <strong>de</strong>pozitelor <strong>de</strong> albie formate din pietrişuri şi bolovănişuri.<br />
Meto<strong>de</strong> şi analiză. Lucrările celui <strong>de</strong>-al IV-lea Simpozion PEA, Piatra NeamŃ, 30 - 47;<br />
Ichim I., Rădoane Maria, Rădoane N., Grasu C., Miclăuş Crina (1998), Dinamica sedimentelor. AplicaŃie la râul Putna-<br />
Vrancea. Editura Tehnică, Bucureşti, 191 p;<br />
Knighton A. D. (1980), Longitudinal changes in size and sorting of stream-bed material in four English rivers. Geological<br />
Society of America Bulletin, 91, 55 - 62;<br />
Kodama Y. (1992), Effect of abrasion on downstream gravel-size reduction in the Watarase River, Japan: Field work and<br />
laboratory experiments. Environmental Res. Center Papers, 15, 88p;<br />
Kodama, Y. (1994), Downstream Changes in the Lithology and Grain Size of Fluvial Gravels, the Watarase River, Japan:<br />
Evi<strong>de</strong>nce of the Role of Abrasion in Downstream Fining. Journal of Sedimentary Research, 64, 1a, 68 - 75;<br />
Krumbein W. C. (1941), The effects of abrasion on the size, shape, and roundness of rock fragments. J. Geology, 64, 336 - 368;<br />
Lambert B. C., Jones J. A., Grant G. E. (1996), The transition from hillslope to fluvial process controls on stream bed<br />
particle size in a fifth or<strong>de</strong>r mountain stream. Eos Trans. AGU, 77, 46, 250 - 251;<br />
Lindsey D. A., Langera W. H., Van Gosena B. S. (2007), Using pebble lithology and roundness to interpret gravel provenance
232<br />
Dan DUMITRIU, Daniel CONDURACHI, Mihai NICULIȚĂ<br />
in piedmont fluvial systems of the Rocky Mountains, USA. Sedimentary Geology, 199, 3 - 4, 223 - 232;<br />
Malarz R. (2005), Effects of flood abrasion of the Carpathian alluvial gravels, Catena, 64, 1 - 26;<br />
Miao X., Lindsey D. A., Lai Z., Liu X. (2010), Contingency table analysis of pebble lithology and roundness: A case study of<br />
Huangshui River, China and comparison to rivers in the Rocky Mountains, USA. Sedimentary Geology, 224, 1 - 4, 49 - 53;<br />
Mikoŝ M. (1994), The downstream fining of gravel-bed sediments in the Alpine Rhine River. Earth and Environmental<br />
Science. Dynamics and Geomorphology of Mountain Rivers. Lecture Notes in Earth Sciences, 52, 93 - 108;<br />
Miller J. P. (1958), High mountain streams: Effects of geology on channel characteristics and bed material. N. M. Inst. of<br />
Mining and Technol., Socorro, 53 p;<br />
Montgomery D. R., M. S. Panfil M. S., Hayes S. K. (1999), Channel-bed mobility response to extreme sediment loading<br />
at Mount Pinatubo. Geology, 27, 271 - 274;<br />
Mosley N. P., Tindale D. S. (1985), Sediment variability and bed material sampling in gravel-bed rivers. Earth Surf.<br />
Process. Landforms, 4, 465 - 483,<br />
Moussavi-Harami R., Mahboubi A., Khanehbad M. (2004), Analysis of controls on downstream fining along three gravelbed<br />
rivers in the Band-e-Golestan drainage basin NE Iran. Geomorphology, 61, 143 - 153;<br />
Mureşan A. (2009), Relationship between the bed material size and the amount of metamorphic and volcanic rocks in the<br />
hydrographic basins regarding two rivers from Maramureş Mountains (Eastern Carpathians-Romania).<br />
Carpathian Journal of Earth and Environmental Sciences, 2009, 4, 1, 19 - 29;<br />
Paola C., Parker G., Seal R., Sinha S. K., Southard J. B., Wilcock P. R. (1992), Downstream fining by selective <strong>de</strong>position<br />
in a laboratory flume, Science, 258, 1757 - 1760;<br />
Parker G. (1991a), Downstream variation of grain size in gravel rivers: Abrasion versus selective sorting. Fluvial<br />
Hydraulics of Mountain Regions, Lecture Notes in Earth Sciences, 37, 345-360;<br />
Parker G. (1991b), Selective sorting and abrasion of river gravel. I: Theory. J. Hydraul. Eng., 117, 131 - 149;<br />
Parker G. (1991c), Selective sorting and abrasion of river gravel. II: Applications. J. Hydraul. Eng., 117, 150 - 171,<br />
Pike A. S., Scatena F. N., Wohl E. E. (2010), Lithological and fluvial controls on the geomorphology of tropical montane<br />
stream channels in Puerto Rico. Earth Surf. Process. Landforms, 35, 12, 1402 - 1417;<br />
Pizzuto J. E. (1995), Downstream Fining in a Network of Gravel-Bed<strong>de</strong>d Rivers. Water Resour. Res. 31, 3, 753 - 759;<br />
Rădoane Maria, Rădoane N., Dumitriu D., Miclaus Crina (2006), Bimodality origin of fluvial bed sediments. Study case:<br />
East Carpathians Rivers. Carpth. J. of Earth and Environmental Sciences, Vol. I, No. 2, 13 - 38;<br />
Rădoane Maria, Rădoane N., Ichim I., Dumitriu D., Miclăuş Crina (2001), Granulometria <strong>de</strong>pozitelor <strong>de</strong> albie în lungul<br />
unor râuri carpatice. Revista Geografică, t. VIII, 70 - 77;<br />
Rădoane Maria, Rădoane N., Dumitriu D., Miclaus Crina (2008), Downstream variation in bed sediment size along the<br />
East Carpathian rivers: Evi<strong>de</strong>nce of the role of sediment sources. Earth. Surf. Process. Landforms, 33, 674 - 694;<br />
Rengers F., Wohl Ellen (2007), Trends of grain sizes on gravel bars in the Rio Chagres, Panama. Geomorphology, 83, 282 - 293,<br />
Rice S. (1998), Which tributaries disrupt downstream fining along gravel-bed rivers ? Geomorphology, 22, 39 - 56;<br />
Rice S. (1999), The nature and controls on downstream fining within sedimentary links. Journal of Sedimentary Research, 69, 1, 32-39;<br />
Rice S., Church M. (1996), Bed material texture on low or<strong>de</strong>r streams in the Queen Charlotte Islands, British Columbia.<br />
Earth Surf. Processes Landforms, 21, 1 - 18;<br />
Sambrook Smith G. (1996), Bimodal fluvial bed sediments: origin, spatial extent and processes. Progress in Physical<br />
Geography, 20, 4, 402 - 417;<br />
Schumm S. A., Stevens M. A. (1973), Abrasion in place: A mechanism for rounding and size reduction of coarse sediments<br />
in rivers. Geomorphology, 1, 37 - 40;<br />
Stanley J., So V. L. (2006), Inconsistent grain roundness and sphericity trends and the valley wall influx factor: between<br />
Alpine source and lake shore, SE France, Journal of Coastal Research, 22, 3, 547 - 560;<br />
Sternberg H. (1875), Untersuchungen über längen-und querprofil geschiebeführen<strong>de</strong>r flüss. Zeitschrift für Bauwesen, 25, 483 - 506;<br />
Venditti J. G., Dietrich W. E., Nelson P. A., Wydzga M. A., Fad<strong>de</strong> J., Sklar L. (2010), Effect of sediment pulse grain size<br />
on sediment transport rates and bed mobility in gravel bed rivers. J. Geophys. Res., 115, 19 p;<br />
Wentworth C. K., (1922), A scale of gra<strong>de</strong> and class terms for clastic sediments. J. Geology, 30, 377 - 392;<br />
Wilcock P. R. (1997), The components of fractional transport rate. Water Resour. Res., 33, 247 – 258.<br />
Submitted: Revised: Accepted and published online<br />
May 12, 2011 July 18, 2011 August 27, 2011
Analele UniversităŃii din Ora<strong>de</strong>a – Seria Geografie Year XXI, no. 2/2011 (December), pp. 233-238<br />
ISSN 1454-2749, E-ISSN 2065-1619 Article no. 212108-548<br />
SEASONAL STUDY WITH INTERPRETATION OF THE CHEMICAL<br />
CHARACTERISTICS OF WATER POND IN REFERENCE TO QUALITY<br />
ASSESSMENT: A CASE STUDY<br />
Hemant PATHAK ∗<br />
Indra Gandhi Govt. Engineering College, Department of Chemistry, India<br />
e-mail: hemantp1981@yahoo.co.in<br />
Deepak PATHAK<br />
Govt. S. L. P. College, Department of Chemistry, Gwalior, (M.P.), India<br />
e-mail: hemantp1981@yahoo.co.in<br />
Sudhir Nagesh LIMAYE<br />
„Dr. Hari Singh Gour” Central University, Sagar (M.P.) 470003, India<br />
e-mail: snl222@yahoo.co.in<br />
Abstract: Water samples were collected from different locations around Lakha banzara Lake.<br />
These water samples from 08 sampling points during three seasons were analyzed for their<br />
physicochemical characteristics, viz. pH, Colour, Odour, Hardness, Chlori<strong>de</strong>, Alkalinity, TDS,<br />
COD, Metal ion content etc. On comparing the results against water quality standards and standard<br />
values recommen<strong>de</strong>d by World Health Organization (WHO), it is found that most of the water<br />
samples are highly polluted not even bathing purposes, due to high concentration of one or the<br />
other parameter. A Systematic calculation of correlation coefficient between water quality<br />
parameters has been done with the objective of minimizing the complexity and dimensionality of<br />
large set of data. The significant correlation has been further verified by using t-test. An attempt<br />
has been ma<strong>de</strong> to find the seasonal quality of water in Lakha banzara lake, in or<strong>de</strong>r to adopt a<br />
mathematical mo<strong>de</strong>l for examine water quality.<br />
Key words: Water quality parameters, Correlation analysis.<br />
* * * * * *<br />
INTRODUCTION<br />
In India ponds, lakes, rivers and ground water are used for domestic and agricultural<br />
purposes. The quality of water may be <strong>de</strong>scribed according to their physico-chemical and<br />
micro-biological characteristics. For effective maintenance of water quality through<br />
appropriate control measures, continuous monitoring of large number of quality parameters is<br />
essential. However it is very difficult and laborious task for regular monitoring of all the<br />
parameters even if a<strong>de</strong>quate manpower and laboratory facilities are available. Therefore, an<br />
attempt based on statistical correlation, has been used to <strong>de</strong>velop mathematical relationship<br />
for comparison of physico-chemical parameters.<br />
∗ Corresponding Author<br />
http://istgeorelint.uora<strong>de</strong>a.ro/Reviste/Anale/anale.htm
234<br />
Hemant PATHAK, Deepak PATHAK, Sudhir Nagesh LIMAYE<br />
OBJECTIVES<br />
STUDY AREA AND COLLECTION OF WATER SAMPLES<br />
Water samples were collected from 8 sampling station of Lakha banzara lake in sagar city<br />
viz: 1). Ganesh Ghat; 2). Chakra Ghat; 3). Gau Ghat; 4).Ghat near Dufrin Hospitil; 5). Baria Ghat;<br />
6). Dhobi Ghat; 7). Sanjay Drive; 8). Centre of lake.<br />
At premonsoon, during monsoon and post monsoon seasons from January 2007 to January 2008.<br />
The samples were collected in clean polythene bottles without any air bubbles. The bottles were<br />
rinsed before sampling and tightly sealed after collection and labeled in the field.<br />
The temperatures of the samples were measured in the field on the spot at the time of<br />
sample collection. The samples were immediately analysed in the chemistry lab. The error due to<br />
time has been omitted for the present study.<br />
MATERIAL, METHOD AND METHODOLOGY<br />
ANALYSIS OF WATER SAMPLE<br />
All the chemicals used were of AR gra<strong>de</strong>. Analysis was carried out for various water<br />
quality parameters such as pH, total solids, Total Dissolved solids (TDS), total hardness (TH),<br />
total alkalinity, calcium, chlori<strong>de</strong> and chemical oxygen <strong>de</strong>mand (COD) were measured by using<br />
Standard methods. pH- measured using standard pH meter, total solids (TS), total dissolved solids<br />
(TDS) by standared methods, calcium content by EDTA titrimetric method, chlori<strong>de</strong> content by<br />
argentometric method, Total hardness was calculated by complexometric titration using EDTA,<br />
methyl orange alkalinity and chemical oxygen <strong>de</strong>mand (COD) by open reflux method.The<br />
statistical analysis has been performed using standard methods.Correlation coefficient (r) was<br />
calculated and correlation for significance has also been tested by applying t-test. Winks SDA<br />
6.0.5 Statistical Software was used for Statistical analysis.<br />
RESULTS AND DISCUSSION<br />
Table 1. Comparison of physicochemical parameters of Lakha banzara lakes water (In mg/L) at Pre monsoon<br />
with standard values (WHO) Physico - Chemical parameters, in mg/L (May 2007)<br />
Parameter P1 P2 P3 P4 P5 P6 P7 P8 Mean<br />
Temp.,<br />
°C<br />
WHO<br />
(Excessive<br />
limit)<br />
20 ºC 20 ºC 20 ºC 20 ºC 20 ºC 20 ºC 20 ºC 20 ºC 20 ºC -<br />
Colour Greenish Greenish Greenish Greenish Greenish Greenish Greenish Greenish Greenish Greenish<br />
Odour<br />
Total<br />
solids<br />
mg/L<br />
Bad<br />
Smell<br />
1995<br />
Bad<br />
Smell<br />
Bad<br />
Smell<br />
Bad<br />
Smell<br />
Bad<br />
Smell<br />
Bad<br />
Smell<br />
Bad<br />
Smell<br />
Bad<br />
Smell<br />
2015 1886 1970 1980 2110 1990 1760<br />
Bad<br />
Smell<br />
1963.25<br />
Unobjec<br />
tionable<br />
Ph 9.0 9.2 9.2 8.9 8.8 8.6 8.7 8.6 8.87 6.5-9.2<br />
TDS<br />
mg/L<br />
1700 1820 1560 1700 1740 1930 1800 1660 1738.75 1000<br />
Chlori<strong>de</strong><br />
mg/L<br />
TH<br />
mg/L<br />
Ca,<br />
mg/L<br />
Alkalinit<br />
y mg/L<br />
COD<br />
mg/L<br />
265 273 288 295 256 285 277 274 276.62 -<br />
1200 1240 1292 1185 1182 1280 1098 1190 1208.37 600<br />
90 96 87 83 100 90 90 94 91.25 200<br />
930 1090 1060 890 944 936 1050 1035 991.87 120<br />
265 278 266 280 285 280 255 260 271.12 255<br />
*P - indicate Sampling place<br />
1500
Seasonal Study with Interpretation of the Chemical Characteristics of Water… 235<br />
Matrix of Correlation Coefficients (Pre monsoon)<br />
TS pH TDS CHLORIDE TH Ca ALKANITY COD<br />
TS 1 .031 .773 .013 .126 -.039 -.355 .505<br />
(.942) (.024) (.976) (.766) (.926) (.388) (.202)<br />
pH 1 -.415 .066 .402 -.116 .319 .129<br />
(.307) (.877) (.324) (.784) (.441) (0.76)<br />
TDS 1 -.079 -.057 .238 -.144 .344<br />
(.853) (.893) (0.57) (.734) (.403)<br />
CHLORIDE 1 .301 -.854 -.046 -.039<br />
(.468) (.007) (.914) (.927)<br />
TH 1 -.102 .054 .395<br />
(.811) (.899) (.332)<br />
Ca 1 .285 .217<br />
(.494) (.605)<br />
ALKANITY 1 -.483<br />
COD 1<br />
Key: Correlation<br />
(p-value)<br />
Table 2. Comparison of physicochemical parameters of Lakha banzara lakes water (In mg/L) at Monsoon<br />
with standard values (WHO) Physico - Chemical parameters, in mg/L (Sep. 2007)<br />
Parameter P1 P2 P3 P4 P5 P6 P7 P8 Mean WHO<br />
Temp.,<br />
ºC<br />
24 ºC 24 ºC 24 ºC 24 ºC 24 ºC 24 ºC 24 ºC 24 ºC 24 ºC -<br />
Colour Greenish Greenish Greenish Greenish Greenish Greenish Greenish Greenish Greenish -<br />
Odour<br />
Bad<br />
Smell<br />
Bad<br />
Smell<br />
Bad<br />
Smell<br />
Bad<br />
Smell<br />
Bad<br />
Smell<br />
Bad<br />
Smell<br />
Bad<br />
Smell<br />
Bad<br />
Smell<br />
Bad<br />
Smell<br />
Unobjec<br />
tionable<br />
Total<br />
solids<br />
2012 2180 1980 2230 2210 2260 2135 2070 2134.62 1500<br />
pH 9.1 9.1 9.3 8.8 8.5 8.6 8.7 8.6 8.83 6.5-9.2<br />
TDS 1740 1970 1670 1860 1850 1990 1870 1730 1835 1000<br />
Chlori<strong>de</strong> 256 270 268 275 276 280 286 269 272.5 600<br />
TH<br />
mg/L<br />
Ca<br />
mg/L<br />
Alkaliny<br />
mg/L<br />
900 940 1100 1010 950 980 990 1070 992.5 600<br />
95 92 108 97 120 124 116 121 109.12 200<br />
915 1050 960 930 910 870 950 960 943.12 120<br />
COD 272 280 286 285 290 295 265 270 280.37 255
236<br />
Hemant PATHAK, Deepak PATHAK, Sudhir Nagesh LIMAYE<br />
Matrix of Correlation Coefficients (monsoon)<br />
TS PH TDS CHLORIDE TH Ca ALKANITY COD<br />
TS 1 -.139 .837 .072 -.619 .527 -.451 .618<br />
(.607) ( 0.0) (0.79) (.011) (.036) (.079) (.011)<br />
pH 1 -.286 -.173 .078 -.393 .395 .099<br />
(.283) (.523) (.775) (.132) (0.13) (.715)<br />
TDS 1 .088 -.488 .345 -.219 .457<br />
(.746) (.055) (.191) (.415) (.075)<br />
CHLORIDE 1 .284 -.114 -.004 -.05<br />
(.286) (.675) (.988) (.854)<br />
TH 1 -.533 .357 -.273<br />
(.034) (.175) (.306)<br />
Ca 1 -.387 .398<br />
(.139) (.127)<br />
ALKANITY 1 -.521<br />
(.039)<br />
COD 1<br />
Key: Correlation<br />
(p-value)<br />
Table 3. Comparison of physicochemical parameters of Lakha banzara lakes water (In mg/L) at Post<br />
monsoon with standard values (WHO) Physico - Chemical parameters, in mg/L (Jan. 2008)<br />
Paramet<br />
er<br />
P1 P2 P3 P4 P5 P6 P7 P8 Mean WHO<br />
Temp.,<br />
ºC<br />
10 ºC 10 ºC 10 ºC 10 ºC 10 ºC 10 ºC 10 ºC 10 ºC 10 ºC -<br />
Colour Greenish Greenish Greenish Greenish Greenish Greenish Greenish Greenish Greenish Greenish<br />
Odour<br />
Total<br />
solids<br />
Bad<br />
Smell<br />
Bad<br />
Smell<br />
Bad<br />
Smell<br />
Bad<br />
Smell<br />
Bad<br />
Smell<br />
Bad<br />
Smell<br />
Bad<br />
Smell<br />
Bad<br />
Smell<br />
Bad<br />
Smell<br />
Unobjec<br />
tionable<br />
1750 2080 1785 1834 1880 1897 1750 1825 1850.12 1500<br />
pH 9.4 9.0 9.1 8.4 8.5 8.4 8.8 8.5 8.76 6.5-9.2<br />
TDS 1715 1990 1750 1800 1860 1830 1710 1790 1805.62<br />
1000<br />
Chlori<strong>de</strong><br />
, mg/L<br />
TH,<br />
mg/L<br />
Ca,<br />
mg/L<br />
260 268 270 280 282 285 290 272 275.87 -<br />
880 910 960 850 885 950 920 970 915.62 600<br />
92 88 95 85 96 105 94 88 92.87 200<br />
Alkalinit<br />
y<br />
925 1010 970 945 960 940 960 1070 972.5 120<br />
COD 282 285 290 292 289 292 276 278 285.5 255
Seasonal Study with Interpretation of the Chemical Characteristics of Water… 237<br />
Matrix of Correlation Coefficients (Post monsoon)<br />
TS PH TDS CHLORIDE TH Ca ALKANITY COD<br />
TS 1 -.019 .634 -.012 .075 .505 -.256 .082<br />
(.931) (.001) (.957) (.728) (.012) (.228) (.703)<br />
pH 1 -.137 -.313 .025 -.349 .26 .057<br />
(.522) (.137) (.907) (.094) (0.22) (.792)<br />
TDS 1 .054 -.381 .237 -.108 .415<br />
(.803) (.066) (.265) (.617) (.044)<br />
CHLORIDE 1 .141 -.044 -.04 -.009<br />
(0.51) (.838) (.852) (.965)<br />
TH 1 -.149 .255 -.475<br />
(.486) (0.23) (.019)<br />
Ca 1 -.381 .161<br />
(.066) (.451)<br />
ALKANITY 1 -.353<br />
(0.09)<br />
COD 1<br />
Key: Correlation<br />
(p-value)<br />
A total of 8 water samples from Lakha banzara lake used by people of Sagar City were collected<br />
in clean polythene bottles and brought to the laboratory. The samples were chemically preserved by the<br />
addition of 3 - 5 ml concentrated HNO 3 per litre of the sample. he standard and observed values of<br />
physico-chemical parameters of experimental water samples are presented in table 1 - 3. The chemical<br />
data were complied further to know location wise distribution. The data revealed that there were<br />
consi<strong>de</strong>rable variations in the examined samples from different sources with respect to their chemical<br />
characteristics. The results indicate that the quality of water consi<strong>de</strong>rably varies from location to<br />
location. Correlation is the mutual relationship between two variables. Direct correlation exists when<br />
increase or <strong>de</strong>crease in the value of one parameter is associated with a corresponding increase or<br />
<strong>de</strong>crease in the value of the other. The correlation is said to be positive when increase in one parameter<br />
causes the increase in the other parameter and it is negative when increase in one parameter causes the<br />
<strong>de</strong>crease in the other parameter. orrelation coefficients (r) among various water quality parameters were<br />
calculated and the values of the correlation coefficients (r) are given in above correlation matrix table.<br />
At Pre-Monsoon<br />
The observed pH values ranging from 8.6 to 9.2 (table 1) shows that, the present water<br />
samples are slightly alkaline. The Weak positive correlationship found between Total solid and Ph<br />
(-.139), Total solid and Chlori<strong>de</strong> (.013), Total solid and Total Hardness (.126), similarly in<br />
between (pH, Chlori<strong>de</strong>), (pH, TH), (pH, alkalinity), (pH, COD), (TDS, Ca), (TDS, COD),<br />
(Chlori<strong>de</strong>, TH), (TH, alkalinity), (TH, COD), (Chlori<strong>de</strong>, TH), (Ca, alkalinity), (Ca, COD). The<br />
Mo<strong>de</strong>rate positive correlationship found between (TS, TDS) and (TS, COD). The Weak Negative<br />
correlationship found between (TS, Ca), (TS, alkalinity), (pH, Tds), (pH, Ca), (Tds, alkalinity),<br />
(Chlori<strong>de</strong>, alkalinity), (Chlori<strong>de</strong>, COD), (TDS, TH), (TDS, Chlori<strong>de</strong>), (TH, Ca), (alkalinity, COD).<br />
The Strong Negative correlationship exist between (Chlori<strong>de</strong>, Ca).<br />
At Monsoon<br />
The Strong positive correlationship found between (TS, TDS). The Mo<strong>de</strong>rate positive<br />
correlationship exist between (TS, COD), (TS, Ca). The Weak positive correlationship exist between<br />
(TH, alkalinity), (pH, COD), (TDS, Ca), (TDS, COD), (pH, TH), (pH, alkalinity), (TS, Chlori<strong>de</strong>),<br />
(TDS, Chlori<strong>de</strong>), (Chlori<strong>de</strong>, TH), (Ca, COD). The Mo<strong>de</strong>rate Negative correlationship exist between
238<br />
Hemant PATHAK, Deepak PATHAK, Sudhir Nagesh LIMAYE<br />
(TS, TH), (TH, Ca), (alkalinity, COD). The Weak Negative correlationship exist between (Chlori<strong>de</strong>,<br />
alkalinity), (Total solid and pH), (Total solid and alkalinity), (pH, TDS), (pH, Chlori<strong>de</strong>), (pH, Ca),<br />
(Tds, alkalinity), (Tds, TS), (Ca, COD), (TH, COD), (Ca, alkalinity).<br />
At Post Monsoon<br />
The Mo<strong>de</strong>rate positive correlationship found between (TS, Tds), (TS, Ca). The Weak positive<br />
correlationship found between (TS, TH), (TS, COD), (pH, TH), (pH, alkalinity), (pH, COD), (TDS,<br />
Chlori<strong>de</strong>), (TDS, Ca), (TDS, COD), (Chlori<strong>de</strong>, TH), (TH, alkalinity), (Ca, COD). The Weak Negative<br />
correlationship found between ((TS, pH), (TS, Chlori<strong>de</strong>), (TS, alkalinity), (pH, TDS), (pH, Chlori<strong>de</strong>),<br />
(pH, Ca), (TDS, TH), (Tds, alkalinity), (Ca, Chlori<strong>de</strong>), (Chlori<strong>de</strong>, alkalinity), (Chlori<strong>de</strong>, COD), (TH,<br />
Ca), (TH, COD), (Ca, alkalinity), (alkalinity, COD). A large number of factors and geological<br />
conditions influence the correlations between different pairs directly or indirectly. An appreciable<br />
significant strong positive correlation have been recor<strong>de</strong>d for total solid and total dissolved solid (at<br />
monsoon). A strong negative correlation was found between Chlori<strong>de</strong> and Ca.<br />
CONCLUSION AND RECOMMENDATION<br />
All the physico-chemical water quality parameters of Lakha banzara lakes water in sagar<br />
city are out of the highest <strong>de</strong>sirable limit or maximum permissible limit set by WHO except pH,<br />
Chlori<strong>de</strong> and Ca which recor<strong>de</strong>d high values. Hence these sample water can not be much fit for<br />
drinking, irrigation and domestic used. The statistical analysis of the experimentally estimated<br />
water quality parameters on water samples yiel<strong>de</strong>d the range of the variation, mean, standard<br />
<strong>de</strong>viation and co-efficient of variation. Since the correlation coefficient gives the interrelationship<br />
between the parameters, correlation coefficients were calculated. Results of correlation analysis<br />
show that, at Premonsoon, monsoon,Postmonsoon all applied water quality parameters are beyond<br />
the maximum permissible limit set by WHO. The average of alkalinity has excee<strong>de</strong>d the <strong>de</strong>sirable<br />
Limits which are due to improper drainage system. In conclusion from the results of the present<br />
study it may be said that the Lakha banzara lakes water of Sagar is not fit for domestic As well as<br />
bathing purpose need treatments to minimize the contamination especially the alkalinity. It is<br />
recommen<strong>de</strong>d that lakes water analysis should be carried out from time to time to monitor the rate<br />
and kind of contamination. It is need of human to expand awareness among the people to maintain<br />
the cleanness of lakes water at their highest quality and purity levels.<br />
REFERENCES<br />
Pathak H. (2011), Doctoral thesis (submitted), Dr. H. S. Gour central university, Sagar, M.P., India;<br />
Pathak H., Limaye S. N. (2011), Study of seasonal variation in ground Water quality Chemical parameters of Sagar city<br />
(M.P.) by principal component analysis and evaluation, E- Journal of chemistry, 8(4), 2000-2009;<br />
Shyamla R., Shanthi M., Lalitha P. (2008), Physicochemical Analysis of Bore well Water Samples of Telungupalayam Area<br />
in Coimbatore District, Tamilnadu, India, E-Journal of Chemistry, 5(4), 924-929;<br />
*** APHA (1992), Standard Methods for the Examination of Water and Wastewater, American public health association<br />
publication, 18th edition, Washington DC, ISBN 0-87553-131-8, ISSN 8755-3546;<br />
*** W.H.O (1984), Gui<strong>de</strong>lines for drinking water quality, Recommendations WHO, Geneva, Vol.1, www.whoindia.org/;<br />
*** WINKS SDA software, Version 6, Web site at www.texasoft.com.<br />
Submitted: Revised: Accepted and published online<br />
August 09, 2011 Octomber 22, 2011 November 27, 2011
Analele UniversităŃii din Ora<strong>de</strong>a – Seria Geografie Year XXI, no. 2/2011 (December), pp. 239-247<br />
ISSN 1454-2749, E-ISSN 2065-1619 Article no. 212109-542<br />
DRINKING WATER SUPPLY AND CONSUMPTION TERRITORIAL<br />
DISPARITIES IN THE TIMIŞ PLAIN<br />
Bianca MITRICĂ ∗<br />
Romanian Aca<strong>de</strong>my, Institute of Geography, D. RacoviŃă Street, 12, Bucharest, Romania,<br />
e-mail: biancadumitrescu78@yahoo.com<br />
Irena MOCANU<br />
Romanian Aca<strong>de</strong>my, Institute of Geography, D. RacoviŃă Street, 12, Bucharest, Romania,<br />
e-mail: mocanitai@yahoo.com<br />
Abstract: The aim of the paper is to analyse the territorial disparities of the drinking water<br />
infrastructure in the Timiş Plain. The article intends to highlight the data-base on NUTS V<br />
level (TEMPO Online time series, National Institute of Statistics) and to map the main<br />
changes registered by the statistical indicators used for the analysis: the number of territorialadministrative<br />
units (ATU) connected to the drinking water network, the length of the<br />
drinking water infrastructure, the capacity of installations to produce drinking water, the<br />
consumption of water by the different types of consumers). In Timiş Plain, the access to<br />
running water hasn’t registered important regional disparities, the expansion of the rural<br />
settlements connected to drinking water network being generalized in territory. The capacity<br />
of installations to produce drinking water had <strong>de</strong>creased, especially because of the drop of the<br />
installation situated in Timişoara Municipality, and in the other small towns, this trend being<br />
linked with the <strong>de</strong>crease (with 45%) of the quantity of drinking water distributed to<br />
consumers, especially to the economic agents.<br />
Keywords: territorial features, the drinking water infrastructure, Timiş Plain.<br />
* * * * * *<br />
INTRODUCTION<br />
Water supply is a major indicator of the level of civilization in an area, and of<br />
<strong>de</strong>velopment opportunities for the respective human communities.<br />
The issue of water supply to population and industry calls for a wi<strong>de</strong>-ranging approach<br />
capable to outline the numerous socio-cultural, <strong>de</strong>mographic and economic implications of<br />
benefiting from water supply in a centralized system and the real possibility of its daily use.<br />
Research into the quality of life and the living standard also emphasizes that water<br />
plays an important role in the daily life of the population (ENVIS Centre on Human<br />
Settlements, 2009; Eberhardt and Pegram, 2000; Chiriac et al., 2001; WQEHH, 2008;<br />
CWHW, 2010; PBWQ, 2011), improving the public health protection (WQEHH, 2008),<br />
reducing the child mortality (Günther, 2011) etc.<br />
∗ Corresponding Author<br />
http://istgeorelint.uora<strong>de</strong>a.ro/Reviste/Anale/anale.htm
240<br />
Bianca MITRICĂ, Irena MOCANU<br />
In Timiş Plain, the access to running water doesn’t shows great regional disparities. The<br />
proportion of settlements, short of running water is two or three times lower in the central and the<br />
western counties of Romania than in those located in south-western, southern and western parts of<br />
the country. The statistical returns of the last census (2002) reveal that the Timiş County partially<br />
overlapping the Timiş Plain boundaries rank in the superior half of the national hierarchy for<br />
indicators regarding: „the proportion of households without sewerage per the total number of<br />
households” (Timiş - 34%) and „the proportion of households with bath-rooms per the total<br />
number of households in the rural area” (Timiş - 25%) (ADPSRN, 2003).<br />
DATA SOURCES<br />
This study intends to highlight the data-base on NUTS V database (TEMPO Online timeseries<br />
published by the National Institute of Statistics).<br />
The main changes (between 2000 - 2008, with updates to 2010 whenever possible)<br />
registered by the statistical indicators and used in this analysis focus on the number of territorialadministrative<br />
units - ATUs - connected to the drinking water network, the length of the drinking<br />
water infrastructure, the capacity of drinking water production plants and water consumption by<br />
types of consumers. They are represented on a series of maps using GIS techniques.<br />
HISTORICAL, ECONOMIC AND SOCIO-DEMOGRAPHIC BACKGROUNDS<br />
In 1552, the first tower for water was documentary attested in Timişoara City; during<br />
the XVIII century were attested the first mechanic installation for the water transportation<br />
from Bega river in the City (1732) and an installation for water supply (1778). In Timişoara<br />
Municipality, the first water treatment plant had started to function on June 1, 1914 (figure 1).<br />
From 1916, the industrial water plant operates in Timişoara Municipality; after forty years a<br />
new water treatment plant has become functional, the Water Treatment Plant no. 2 capturing and<br />
treating the water from Bega River (the initial capacity was 115.7 l/s).<br />
Figure 1. Territorial coverage of the Timiş Plain with Aquatim Company's services<br />
(Source: Aquaştiri, http://www.aquatim.ro/uploads/file/<strong>de</strong>%20actualitate/Aquastiri_iunie%202010.pdf)
Drinking Water Supply and Consumption Territorial… 241<br />
The existing water treatment plants were exten<strong>de</strong>d during the last two <strong>de</strong>ca<strong>de</strong>s of the<br />
XX century: the Water Treatment Plants no. 2, exten<strong>de</strong>d with Water Treatment Plants no. 4<br />
(1982), a new front capture (40 new drilling, in 1990) for the Water Treatment Plants no. 5<br />
(1991). From the second half of the ’90, the different programmes and sources for financing<br />
were used for the <strong>de</strong>velopment of water infrastructure (1995 - Municipal Utilities<br />
Development Programme, 11.9 millions USD, 2002 – Instrument for Structural Policies for<br />
Pre-Accession (ISPA) Programme for the wastewater treatment plant rehabilitation and the<br />
upgrading of the sewerage network, 45 millions euros).<br />
The Timiş Plain is situated in Timiş County, which constitutes a driving force for the<br />
Romanian economy, the GDP coming third after that of Bucharest and of Ilfov County, the<br />
great many small and medium-sized enterprises representing an important contributor to the<br />
area’s GDP (by over 40%), due to commercial and import-export activities. In present<br />
Timişoara Municipality is a great polarizer for the industry and services sectors, concentrating<br />
60% of all of the Timiş County industrial units.<br />
The economic structure of the Timiş Plain is influenced by the evolutions seen in<br />
Timişoara Municipality, the city supplying 96% of the entire workforce to the 12 settlements<br />
from the plain. The total number of employees registered a sinuous evolution and beginning<br />
with the last <strong>de</strong>ca<strong>de</strong>, was observed a constant increase, due to the <strong>de</strong>velopment of a viable<br />
entrepreneurial sector based mostly on small and medium-sized enterprises, and the attraction<br />
of foreign investments in particular.<br />
The positive dynamics of the socio-economic life is due primarily to its geographical<br />
position at the cross-roads between the Carpathian realm and the Pannonian Basin. Timiş<br />
County, especially the Timiş Plain, is an area of major economic importance and a gateway to<br />
Central Europe and Balkan Europe; in addition, the Timişoara City lies in a zone of vast<br />
European convergence and penetration, featuring big transport and communication axes.<br />
The main <strong>de</strong>mographic particularities of the Timiş Plain are the followings: total population<br />
is 346,818 inhabitants, population structure: 89.8% urban population, 10.2% rural population,<br />
<strong>de</strong>mographic size of the settlements is 1,429 inh. (BucovăŃ) and 311,586 inh. Timişoara City and<br />
population <strong>de</strong>nsity is 341.7 inh./sq km.<br />
In some of the Timiş Plain communes, the <strong>de</strong>crease trend of the population had been visible<br />
even before 1989, <strong>de</strong>population setting in due to the rural-urban migration, <strong>de</strong>spite the restrictive<br />
measures to stop this phenomenon by closing the large urban centres new incomers. Over the past<br />
20 years, the Timiş Plain lost 13,467 inhabitants, the <strong>de</strong>crease culminating in 2002, and improving<br />
slightly between 2006 and 2009.<br />
The historic region of Banat was even in the past (un<strong>de</strong>r communism) a space characterised<br />
by temporal and <strong>de</strong>finitive immigration mainly for people from Moldavia and Oltenia, and after<br />
1990 also from some parts of Arad, Hunedoara and Teleorman counties.<br />
The main economic actor in the water supply filed is Aquatim, which represents the<br />
regional operating company of the public water and wastewater services for Timişoara<br />
Municipality and 40 other localities from Timiş County (figure 1).<br />
TERRITORIAL DISTRIBUTION OF DRINKING WATER INFRASTRUCTURE<br />
The human settlements network connected to drinking water supply was in a<br />
continuous extension because of the connection of rural communes. In 1990, 66.6% of total<br />
administrative territorial units (ATU) of the Timiş Plain were connected to the drinking water<br />
supply and in 2009 (91.6%) (figure 2).<br />
The length of drinking water network increased continuously in the interval 1990 - 2009,<br />
with 41.3% (with 30.5% over 2000 - 2009), being correlated with the extension of the localities<br />
network connected to drinking water supply (the most significant in Timişoara Municipality and in<br />
the rural communes of Giroc, Şag, Uivar and BucovăŃ, localised in the neighborhood of the<br />
Timişoara Municipality) (figure 3).
242<br />
Bianca MITRICĂ, Irena MOCANU<br />
Figure 2. The ATU connected to drinking water supply (1990 and 2009)<br />
Figure 3. The length of drinking water network. Territorial characteristic
Drinking Water Supply and Consumption Territorial… 243<br />
Field investigations conducted in the Timiş - Bega Interfluve pilot area revealed the<br />
situation of the settlements connected to the drinking water network shows: a good coverage with<br />
water services, yet been clearly differentiated between rural and urban ATU in terms of length of<br />
drinking water network, share of households with water supply, quantity of water distributed to the<br />
consumers. In the pilot-area Timiş-Bega Intefluve, the total length of drinking water network is<br />
836.6 km (2010), 73.9% being concentrated in Timişoara Municipality.<br />
The territorial disparities between the villages from the pilot-area Timiş-Bega Intefluve<br />
outlines the greater length of drinking water network in the rural settlements in the<br />
neighborhoods of Timişoara Municipality (the case of Giroc and Chişoda villages, which have<br />
the water network connected with the network of Timişoara Municipality) that in the villages<br />
localized at the periphery of the Timiş County.In the pilot-area Timiş-Bega Intefluve, in 2010,<br />
the total number of househol<strong>de</strong>rs is 343,826, and 98.07% from these are connected to the<br />
drinking water network (100% in urban area and 46.4% in rural area) (figure 4).<br />
Figure 4. The households connected to the drinking water network<br />
In February, 2011, the financing of the project „Extension and mo<strong>de</strong>rnization of water supply<br />
and sanitation in Timiş County“ was signed. The project has a value of 118.87 million euros and it is<br />
financed from the Cohesion Fund, by Sectoral Operational Programme Environment.<br />
QUANTITATIVE ASPECTS CONCERNING THE PRODUCTION AND THE<br />
CONSUMPTION OF DRINKING WATER<br />
The capacity of installations to produce drinking water had <strong>de</strong>creased with 22.9%. The<br />
<strong>de</strong>crease was caused by the drop of capacity to produce drinking water specific for the installations<br />
situated in Timişoara Municipality, Deta, Sânnicolau Mare and Lovrin (figures 5, 6).<br />
In Timişoara Municipality, in 2008, Aquatim SA supplied an average of 2.63 million<br />
liter/hour (Raport anual Aquatim (RAQ), 2008). The city relies mostly on river water supplied<br />
by the Bega treatment plant, but also on groundwater supplied from 56 water drills by the<br />
Urseni and Ronat treatment plants. The river water/groundwater ratio has been maintained<br />
constant in the last years to protect the natural, resources (RAQ, 2008).
244<br />
Bianca MITRICĂ, Irena MOCANU<br />
Figure 5. Dynamic of installations capacity to produce drinking water<br />
Figure 6. The capacity of installations to produce drinking water. Territorial disparities (2009)<br />
In terms of territorial differentiation, the major changes in response time consist in the<br />
increasing of the quantity of drinking water distributed to consumers in 2 different areas:<br />
-in the western part (Lenauheim, Tomnatic, Gottlab, Comoloşu Mare, Lovrin);<br />
-in the eastern part of Timişoara Municipality (figure 7).
Drinking Water Supply and Consumption Territorial… 245<br />
The quantity of drinking water distributed to all consumers <strong>de</strong>creased by 56.4%<br />
(between 2000 and 2009). The two types of consumers shows the same negative dynamic,<br />
household consumption dropping by only 19.8%, compared to 77.3% in the case of the other<br />
consumers (figure 8).<br />
Figure 7. The quantity of drinking water distributed to consumers by types of consumers (2009)<br />
inhab.<br />
350000<br />
thou.cubic cm<br />
25000<br />
300000<br />
20000<br />
250000<br />
200000<br />
15000<br />
150000<br />
10000<br />
100000<br />
50000<br />
5000<br />
Figure 8. The quantity of drinking water<br />
distributed to consumers by type of<br />
consumers<br />
0<br />
2000 2001 2002 2003 2004 2005 2006 2007 2008 2009<br />
urban population rural population urban consumption rural consumption<br />
Figure 9. The consumption of drinking water of the urban<br />
and rural population<br />
0
246<br />
Bianca MITRICĂ, Irena MOCANU<br />
The quantity of drinking water supplied to population fell over the 2000 - 2009 period<br />
(figure 9) because of population <strong>de</strong>crease, the implementation of water measurement system and<br />
the increase of drinking water costs. Between 2020 - 2100 the quantity of drinking water<br />
supplied to the population is expected to increase in the county-si<strong>de</strong> due to improvements in the<br />
drinking water supply length (11.0% in 2050 and 11.6% in 2100) and in town due to increase of<br />
population (15% in 2050 and 20% in 2100).<br />
GENERAL ANALYSIS OF THE WATER PRICE<br />
Between 2000 and 2009, the cost of water rose by 5.8 times, from 0.42 to 2.46 lei (Raport anual<br />
Aquatim (RAQ), 2008). Water consumption and cost increases over the studied period were<br />
closely correlating (figure 10).<br />
Figure 10. The quantity of drinking water distributed to population and water costs<br />
Figure 11. Cost of water distributed (2010)<br />
The cost of water distributed in the territory varied significantly from one locality to another,<br />
prices staying high in Uivar, Timişoara, Giroc and MoşniŃa Nouă with lowest values at Becicherecu<br />
Mic and Giulvăz, settlements situated in the south-west of the Timiş Plain (figure 11).
Drinking Water Supply and Consumption Territorial… 247<br />
CONCLUSIONS<br />
In Timiş Plain, the access to running water doesn’t shows important regional disparities.<br />
The expansion of the human settlements network connected to drinking water supply is<br />
accompanied by the <strong>de</strong>crease of the capacity of installations to produce drinking water (with<br />
23.4%, especially because of the drop of the installation situated in Timişoara Municipality, Deta,<br />
Sânnicolau Mare and Lovrin) and of the quantity of drinking water distributed to consumers (with<br />
45%, the two types of consumers having the same dynamic (negative) but the consumption of the<br />
households had drop less, compared with 70.6% specify for the other consumers.<br />
Field investigations conducted in 2010 in the Timiş Plain pilot area, revealed a good<br />
coverage with water services: 343,826 households and 98.07% from these are connected to the<br />
drinking water network. It is obvious the differentiation between rural and urban administrativeterritorial<br />
units, in terms of length of drinking water network, share of households with water<br />
supply, quantity of water distributed to the consumers.<br />
The drinking water prices increased, in the context of the <strong>de</strong>creasing of the quantity of drinking<br />
water distributed to the population, because of the <strong>de</strong>creasing of the total number of population.<br />
The present study un<strong>de</strong>rlines the weaknesses in systems of water supply in Timiş Plain: the<br />
insufficient water supply networks territorial expantion in the rural area, the low level water<br />
metering to customers, the high level of losses due to wear of the systems, the <strong>de</strong>gree of metering<br />
an low cost coverage by tariffs, the rural environment does not benefits the wastewater collection<br />
system and the wastewaters are discharged unpurified or poorly treated.<br />
REFERENCES<br />
Chiriac D., Humă Cristina, Tudor Cristina, (2001), Impactul socio-economic al apei asupra calităŃii vieŃii populaŃiei din<br />
România, Calitatea VieŃii, XII, nr. 1- 4, Bucureşti;<br />
Eberhardt R., Pegram G. (2000), The water sector. a position paper, Deutsche Gesellschaft für Technische<br />
Zusammenarbeit, GmbH, World Wi<strong>de</strong> Fund for Nature, Development Bank of Southern Africa;<br />
Günther, Isabel, Günther, F., (2011), Water and Sanitation to Reduce Child Mortality. The Impact and Cost of Water and<br />
Sanitation Infrastructure, Policy Research Working Paper, no. 5618, The World Bank, Development Economics<br />
Prospects Group.<br />
Qilin L., Dueñas-Osorio L., Raciny I. (2009), Sustainable water infrastructure for improving public health protection. A<br />
look at centralized, <strong>de</strong>centralized and hybrid water systems, http://shellcenter.rice.edu/Content.aspx?id=59;<br />
*** (2003), Aspecte privind <strong>de</strong>zvoltarea, populaŃia şi sănătatea reproducerii la nivel naŃional şi studii <strong>de</strong> caz. România<br />
(ADPSRN), UNFPA, Bucureşti;<br />
*** (2008), Water Quality for Ecosystems and Human Health (WQEHH), 2nd edition, UNEP, ERCE, UNESCO,<br />
http://www.unwater.org/wwd10/downloads/water_quality_human_health.pdf;<br />
*** (2008), Raport anual Aquatim (RAQ), http://www.aquatim.ro/uploads/file/rapoarte_anuale/aquatim-raport-anual-<br />
2008.pdf;<br />
*** (2008), Aquaştiri, anul 2, nr. 6, http://www.aquatim.ro/uploads/file/<strong>de</strong>%20actualitate/Aquastiri_iunie%202010.pdf;<br />
*** (2010), Raport anual Aquatim (RAQ), http://www.aquatim.ro/uploads/file/rapoarte_anuale/raport-anual-2010-<br />
aquatim.pdf<br />
*** (2010), World Water Day „Clean Water for a Healthy World" (CWHW), UN-Water, UNEP, FAOWater,<br />
http://www.unwater.org/wwd10/downloads/WWD2010_LOWRES_BROCHURE_EN.pdf;<br />
*** (2011), Policy Brief on Water Quality (PBWQ), UN-Water, http://www.unwater.org/downloads/waterquality_policybrief.pdf.<br />
*** (2009), Monograph in Quality of Life Indicators, ENVIS Centre on Human Settlements, Department of Environmental<br />
Planning, School of Planning and Architecture, New Delhi.<br />
Submitted: Revised: Accepted and published online<br />
July 14, 2011 September 28, 2011 November 23, 2011
Analele UniversităŃii din Ora<strong>de</strong>a – Seria Geografie Year XXI, no. 2/2011 (December), pp. 248-255<br />
ISSN 1454-2749, E-ISSN 2065-1619 Article no. 212110-532<br />
CONTRIBUTIONS TO THE KNOWLEDGE OF THE ASSOCIATION OF<br />
FESTUCO DRYMEJAE-FAGETUM FROM LĂZĂRENI HILLS<br />
(NORTH-WESTERN ROMANIA)<br />
Laura Mariana LACATOŞ (HERMAN) ∗<br />
University of Ora<strong>de</strong>a, Faculty of Sciences, Biology Department,<br />
PhD Stu<strong>de</strong>nt, Ora<strong>de</strong>a, Romania, e-mail:lauralacatos@yahoo.com<br />
Grigore Vasile HERMAN<br />
University of Ora<strong>de</strong>a, Department of Geography, Tourism and Territorial Planning – TSAC,<br />
1 University St., 410087, Ora<strong>de</strong>a, Romania, e-mail: grigoreherman@yahoo.com<br />
Abstract: The importance and relevance of the present study emerges from the analysis and<br />
characterization for the first time of an association of Festuco drymejae-Fagetum (Morariu et<br />
al., 1968) in an unchartered territory from this point of view. The very existence of this<br />
association that is specific to the mountain area adds something new. Human impact on<br />
vegetation from this space took various types and forms, among which stands out: burning of<br />
vegetation, overgrazing, <strong>de</strong>forestation and not at least air and waters pollution. Deciduous<br />
forests in general in Piedmont Lăzăreni suffered in recent years (1990 - 2008) because of the<br />
economic <strong>de</strong>gradation that caused serious damage to the exploitation of timber.<br />
Key words: association, phytocoenologic study, ecological factors, floristic elements<br />
* * * * * *<br />
INTRODUCTION<br />
The area studied (Lăzăreni Hills), is located in terms of space in the central southern part of<br />
Bihor County, between Crişul Repe<strong>de</strong> River to the north and Crişul Negru River to the south (figure 1).<br />
From the geographic point of view this area represents a subsystem of the orographic system of the<br />
Western Hills. In its turn, this subsystem behaves as a system consisting of several physical and<br />
geographical units among which we mention: Tăşad Hills, Betfiei Hills, Hidişel Hills, Calea Mare Hills<br />
etc. Over time, Lăzăreni Hills were treated in the specialized literature from the following points of<br />
view: orographic (Pop, 2005), geological (łicleanu, 2008), climatic (Dragotă, 2006; Dumiter, 2007),<br />
pedological (Sabău et al., 2002) and biogeographic (Burescu and Cheregji, 2002; Burescu et al., 2002;<br />
Burescu and Lacatoş, 2010; Lacatoş and Burescu, 2010; Lacatoş, 2010a; Lacatoş, 2010b) etc. And in<br />
our country, this association has been <strong>de</strong>scribed in North-Western Romania (Ar<strong>de</strong>lean, 2002; Groza,<br />
2008; PăşcuŃ and Burescu, 2010; Pop et al., 2002), in Oltenia (RăduŃoiu, 2006), in Moldova (Gurău,<br />
2004), in South Western Romania (Nicolim and Imrea, 2009) etc<br />
In a careful analysis of the specialized bibliographic literature focused on this area, it is<br />
noted the absence of scientific gaps aimed at various components of the environment. This study<br />
comes in completing and improving information about an anthropic area, in full process of<br />
<strong>de</strong>gradation due to the actions and activities of man.<br />
∗ Corresponding Author<br />
http://istgeorelint.uora<strong>de</strong>a.ro/Reviste/Anale/anale.htm
Contributions to the Knowledge of the Association of Festuco Drymea-Făgetum… 249<br />
Figure 1. Geographical location of Lăzăreni Hills<br />
(Source: processing after Pop, 2005)<br />
-<br />
MATERIALS AND METHODS<br />
In the study of vegetation cover a total of 52 phytocoenologic lifts were ma<strong>de</strong>, during 2008<br />
- 2010, of which 10 more representative surveys entered into the composition of the<br />
phytocoenologic table (table 1), according to the methodology used in scientific research work by<br />
Borza and Boşcaiu (1954), Borhodi (1996), Braun-Blanquet and Pavillard (1928), Marian (2008),<br />
Pott (1995) and Sanda (2008). Flora inventoried in the 10 surveys comprise a total of 54 species<br />
which are grouped in the phytocoenologic table on probative and characteristic species, differential<br />
or of recognition, which are subordinated to the sub-alliance, alliance, or<strong>de</strong>r and class.<br />
The synthetic table contains information about the species inclu<strong>de</strong>d in the floristic composition of<br />
the association, biological form, floristic elements, ecological indices (humidity, temperature, soil chemical<br />
reaction), karyotype, serial number of the survey, altitu<strong>de</strong> (m.s.m.), exposition, slope, tree height (m),<br />
diameter of the trees (cm), canopy, grassy layer cover (%), surface (sqm).<br />
Overall coverage of each species participating in the association table was ma<strong>de</strong> with the<br />
in<strong>de</strong>x of abundance-dominance and besi<strong>de</strong>s it was calculated and noted the constancy (K)<br />
according to its evaluation system Braun-Blanquet. At the bottom of the table there were listed the<br />
species occurring in a single survey, place and the date of the surveys.<br />
Data from the phytocoenologic and environmental study of the association Festuco<br />
drymejae-Fagetum were plotted as a spectrum of biological shapes, of floristic elements,<br />
ecological indices and karyotype.<br />
RESULTS<br />
Beech forests studied are located along some streams, the valley and extend to the coast<br />
slopes with gradients ranging from 8º - 25º. Above them, on the plateau, there is a mixture of<br />
hornbeam and beech (Carpino-Fagetum), oak with hornbeam (Querceto petraeae-Cărpinetum),
250<br />
Mariana Laura LACATOŞ (HERMAN), Grigore Vasile HERMAN<br />
holm with hornbeam (Carpino-Quercetum cerris), holm with Turkey oak (Querco petraeaecerris),<br />
etc. They love moisture and are mostly located in the northern, north-western slopes.<br />
The association Festuco drymejae-Fagetum (figure 2) was i<strong>de</strong>ntified in the following<br />
places: Miheleu, Gepiş, Lăzăreni, Holod, Sititelec, Oşand, Mierlău, Chijic and Copăcel, places<br />
whose pedological substrate is characterized by profound and intense moist soils up to damp - wet<br />
soils where air humidity is sufficient for the beech to find conditions favorable to life.<br />
Figure 2. Festuco drymejae-Fagetum BiŃişagului Valley (Lăzăreni village-Bihor County)<br />
The flora of the phytocoenoses studied in this area is rich summing up a total of 54 species<br />
(table 1), including a beautiful forest orchid Cephalanthera damassonium (Oprea, 2005), as well<br />
as the species Fagus sylvatica and Festuca drymejae which are species characteristic and dominant<br />
for the association analyzed.<br />
Tree layer is well represented by Fagus sylvatica having a general coverage of 75%, a<br />
maximum consistency (K=V), and the herbaceous layer is given by Festuca drymeja with an<br />
average coverage of 36.5%, a maximum consistency (K=V).<br />
Among the species i<strong>de</strong>ntifying the sub-aliance Symphyto-Fagenion, alliance Symphyto<br />
cordati-Fagion and or<strong>de</strong>r Fagetalia sylvaticae we mention: Cardamine glanduligera, Euphorbia<br />
amygdaloi<strong>de</strong>s, Lamium galeobdolon, Asarum europaeum, Carex digitata, etc. And of the class<br />
Querco-Fagetea: Anemone nemorosa, Aposeris foetida, Athyrium filix–femina, Brachypodium<br />
sylvaticum, Campanula persicifolia etc.<br />
N o. of species (% )<br />
70<br />
60<br />
59.2<br />
50<br />
40<br />
30<br />
20<br />
10<br />
0<br />
5.5<br />
1.8<br />
Life form s<br />
H Th C h G M Ph nPh<br />
22.2<br />
Figure 3. The spectrum of life form in the association Festuco drymejae-Fagetum,<br />
where: H = hemicryptophytes; Th =Annual terophytes; Ch= Chamaephytes; G = geophytes; MPh =<br />
Megaphanerophytes; nPh = Nanophanerophytes;<br />
9.8<br />
1 .8
Contributions to the Knowledge of the Association of Festuco Drymea-Făgetum… 251<br />
The analysis of the spectrum of biological forms (figure 3), highlights the predominance of<br />
hemicryptophytes (59.2%), followed at a great distance by geophytes (22.2%) and woody species (11.6%).<br />
In the spectrum of floral elements (figure 4), it is shown that the majority are Eurasian<br />
species (46.3%), European (29.6%) and Central European (9.2%).<br />
No. of species (%)<br />
50 46.3<br />
40<br />
30<br />
20<br />
10<br />
0<br />
9.2<br />
29.6<br />
3.7<br />
Floristic elements<br />
Eua Ec E Carp-B Alt-Med Cp Cosm<br />
3.7<br />
1.8<br />
5.5<br />
Figure 4. Spectrum of floristic elements of the association Festuco drymejae-Fagetum,<br />
where: Eua= Eurasian; Ec=Central European; E=European; Carp-B=Carpathian-Balkanic; Atl-Med=Atlantic-<br />
Mediterranean; Cp=Circumpolar Cosm=Cosmopolitan;<br />
N o. of species (% )<br />
70<br />
60<br />
50<br />
40<br />
30<br />
20<br />
10<br />
0<br />
1 1,5 2 2,5 3 3,5 4 4,5 5 0<br />
E cological factor<br />
U T R<br />
Figure 5. Diagram of ecological factors for the Festuco drymejae-Fagetum,<br />
where: U= humidity, T= temperature, R= the chemical reaction of the soil.<br />
No. of species (%)<br />
60 51.8<br />
50<br />
42.6<br />
40<br />
30<br />
20<br />
10<br />
3.7<br />
1.8<br />
0<br />
D P D.P<br />
Karyological spectum<br />
CN<br />
Figure 6. The spectrum of karyological in the association Festuco drymejae-Fagetum, where:<br />
D=dyploid; P=polyploid; D.P=Dyplo-polyploid; CN= karyotype is not knows.
252<br />
Mariana Laura LACATOŞ (HERMAN), Grigore Vasile HERMAN<br />
Ecological factors (figure 5), emphasizes in terms of moisture the high number of<br />
mesophilous plants (68.5%), followed by xero-mesophilous (16.6%), which has values close to<br />
mezo-higrophyle (13.8%). Compared to the heat factor micro-mesothermal species distinguish<br />
(68.4%) as well as micro-thermal (16.6%). Depending on the chemical reaction most species are<br />
acid-neutrophilous (38.9%), followed by weak acid-neutrophilous (29.6%), at a very small<br />
distance by amphitolerant species (27.8%).<br />
From the karyological analysis (figure 6), the high number of diploid species come off<br />
(51.8%), followed at a small difference by polyploids (42.6%). The diplo-polyploid couple (3.7%)<br />
is poorly represented in the association, as the species with unknown karyotype (1.8%). Diploids<br />
in<strong>de</strong>x has a value of 1.2.<br />
DISCUSSIONS<br />
Making a comparison between the work „Contributions to the phytocoenologic study in<br />
pure European beech stand forests in Codru-Moma mountains (North-Western Romania)” and this<br />
work from Lăzăreni Hills, we find that the first work comprises a large number of 104 species in<br />
Codru-Moma Mountains, while in Lăzăreni Hills we have a halved number of only 54 species, of<br />
which 36 species are common in the two areas studied.<br />
Differences in excess of the dominance of biological forms in association, of floristic elements<br />
and ecological factors are not too many; comparing them, we note a certain similarity in that:<br />
In Codru-Moma Mountains, live forms are represented by hemicriptophyte (H=50%),<br />
geophyte (G=23.6%) and megafanerophyte (MPh=13%), and in Lăzăreni Hills we have<br />
hemicriptophyte (H=59.2%), geophyte (G=22.2%) and megafanerophyte (MPh= 9.8%).<br />
In terms of floristic elements Codru-Moma Mountains are dominated by the Eurasian species<br />
(Eua=47.7%), European (E=18.7%) and circumpolar (Cp=8.4%), and in Lăzăreni Hills first places are<br />
held by the Eurasian (Eua=46.3%), European (E=29.6%) and Central European (Ec=9.2%).<br />
Behavior to environmental factors both in Codru-Moma Mountains and Lăzăreni Hills,<br />
phytocoenoses are of mesophilic character (67% in Codru-Moma Mountains, 68.5% in<br />
Lăzăreni Hills) and xero-mesophilic (12% in Codru-Moma Mountains, 16.6% in Lăzăreni<br />
Hills). Compared to temperature they are micro-mesothermal (75.9% in Codru-Moma<br />
Mountains, 68.4% in Lăzăreni Hills) and microthermal (12% in Codru-Moma Mountains,<br />
16.6% in Lăzăreni Hills). Soil chemical reaction capitalized through acid-neutrophil species<br />
(37% in Codru-Moma Mountains, 38.9% in Lăzăreni Hills) and low-acid neutrophil (37% in<br />
Codru-Moma Mountains, 29.6% in Lăzăreni Hills).<br />
Comparative analysis with work 11 illustrates the large number of species (70 species)<br />
found in similar associations from Pădurea Craiului Mountains for the small number of species (54<br />
species) which are part of the same phytocoenoses from Lăzărenilor Hills. 26 species are common<br />
for both situations. After live forms, are dominant hemicryptophytes (H=34% in Pădurea Craiului<br />
Mountains, H=59.2% in Lăzărenilor Hills), geophytes (G=23% in Pădurea Craiului Mountains,<br />
G=22.2% in Lăzărenilor Hills) and megaphanerophytes (Mph=11% in Pădurea Craiului Mountains,<br />
Mph=9.8% in Lăzărenilor Hills). In terms of florist elements found in Pădurea Craiului Mountains,<br />
the most representative species are the European species (E=30%), the Eurasian species (Eua=24%)<br />
and Central European species (Ec=21%) and, in Lăzărenilor Hills, the most representative are the<br />
Eurasian species (Eua=46.3%) and the Central European species (Ec=9.2%).<br />
Compared to ecological factors, species from Pădurea Craiului Mountains and from<br />
Lăzărenilor Hills have a mesophilic character (74.2% those from Pădurea Craiului Mountains and<br />
68.5% those from Lăzărenilor Hills).<br />
In terms of temperature, there are 77.1% micro-mesothermal in Pădurea Craiului<br />
Mountains and 68.4% in Lăzărenilor Hills. Chemical reaction shows acid-neutrophil species<br />
and weak acid-neutrophil species (67.1% in Pădurea Craiului Mountains and 38.9% in<br />
Lăzărenilor Hills), followed by euro-ionic species (22.8% in Pădurea Craiului Mountains and<br />
27.8% in Lăzărenilor Hills).
Contributions to the Knowledge of the Association of Festuco Drymea-Făgetum… 253<br />
A relatively similar situation is presented by species from Festuco drymejae-Fagetum<br />
association analyzed in works „Flora şi vegetaŃia din <strong>de</strong>presiunea Caşin-Oneşti (sectorul CăiuŃi-<br />
Oituz)”, „Flora şi vegetaŃia ju<strong>de</strong>Ńului Satu-Mare”, „VegetaŃia Ju<strong>de</strong>Ńului Cluj. (Studiu<br />
fitocenologic, ecologic, bioeconomic şi ecoprotectiv)” and „Caracterizarea sinecologică a<br />
principalelor fitocenoze lemnoase din łara Oaşului (ju<strong>de</strong>Ńul Satu-Mare)”. Differences and<br />
similarities are generated by their spatial location.<br />
As a conclusion, Festuco drymejae-Fagetum association, analyzed in the above-mentioned<br />
works, is located, from orographic point of view, in mountain region, while, in this study, it is<br />
<strong>de</strong>scribed in hills region. In the mountain region, the association has a much higher number of<br />
species, it is often doubled (for example, in work „Contributions to the phytocoenologic study in<br />
pure European beech stand forests in Codru-Moma mountains (North-Western Romania)”,<br />
compared to Lăzărenilor Hills. Making a comparison between the analysis of live forms, of<br />
floristic elements and of ecological factors <strong>de</strong>scribed in Lăzărenilor Hills, and the works from the<br />
mountain region, it appears a certain similitu<strong>de</strong> between them.<br />
L.f. F. e. U. T. R. 2n<br />
Tabel 1. As. Festuco drymejae-Fagetum (Morariu et al. 1968)<br />
Nr. Land Surveys 1 2 3 4 5 6 7 8 9 10 K AD<br />
m<br />
Altitu<strong>de</strong> (m.s.m.) 250 290 260 280 240 260 280 210 230 220<br />
Exposition N NV N E NE NV N V NV SE<br />
Slope (º) 20 25 20 20 25 18 20 9 10 8<br />
Trees high (sqm) 19 20 22 21 17 20 18 23 21 22<br />
Trunk diam. (cm) 35 40 50 45 30 40 50 55 45 60<br />
Consistency of tree layer 0.8 0.95 0.7 0.8 1 0.7 0.8 0.9 1 0.9<br />
The grass layer (%) 60 55 35 75 45 95 60 55 35 80<br />
Surface (sqm) 400 400 400 400 400 400 400 400 400 400<br />
MPh E 3 3 0 D Fagus sylvatica 4 5 4 4 5 4 4 5 5 5 V 75<br />
G Carp-B 4 2 3 D Festuca drymeja 3 3 2 3 2 4 3 3 2 4 V 36,5<br />
Symphyto-Fagenion; Symphyto cordati-Fagion; Fagetalia sylvaticae<br />
G Carp-B 4 2.5 4 P Cardamine glanduligera + + . . . + . + + + III 0,3<br />
Ch E 3 3.5 4 D Euphorbia amygdaloi<strong>de</strong>s + + + + + . + + + + V 0,45<br />
H Ec 3 0 4 D Lamium galeobdolon + + + 1 . + + + + + V 0,9<br />
H Eua 3.5 3 4 D Asarum europaeum + + + . . + + + + . IV 0,35<br />
H E 3 3 3 P Carex digitata + + + + . . + + + + IV 0,4<br />
H E 3.5 3 4 P Carex sylvatica + + . + 1 + + . + + IV 0,85<br />
G Eua 3.5 3 4 D Circaea lutetiana + + + 1 + . + . + . IV 0,8<br />
G Ec 2.5 3 3 P Galium schultezii + + + + + + . . + + IV 0,4<br />
H Eua 3 3 3 D Lathyrus vernus + . + + + + . + . + IV 0,35<br />
H Eua 3.5 3 3 DP Myosotis sylvatica + + + . + + . + . + IV 0,35<br />
H Cp 4 3 3 D Oxalis acetosella + . + + . + + . + + IV 0,35<br />
H E 3.5 3 3 D Pulmonaria officinalis + . + + + + . + + + IV 0,4<br />
H E 3 2.5 3 P Rubus hirtus + + + . + . + . + + IV 0,35<br />
H Atl-Med 3.5 3 4 D Sanicula europaea . + + + . + . + + + IV 0,35<br />
H Eua 3 3 0 P Symphytum tuberosum + + . + + . + + . + IV 0,35<br />
G Ec 3 3 4 P Cardamine bulbifera + . + + . . + + . + III 0,3<br />
G Eua 3 3 3 P Galium odoratum + . + . + + 1 + . . III 0,75<br />
G Eua 3 3 0 P Maianthemum bifolium . + . + + . + + + . III 0,3<br />
H Eua 3.5 0 4 P Paris quatrifolia . + . + + + + + . . III 0,3<br />
Querco-Fagetea<br />
G E 3.5 4 0 P Anemone nemorosa + + . + + . + . + + IV 0,35<br />
H Ec 3 2.5 3 D Aposeris foetida + + + . + . + + + . IV 0,35<br />
H Cosm 4 2.5 0 P Athyrium filix–femina + + . + + . . + + + IV 0,35<br />
H Eua(Med) 2.5 4 4 D Brachypodium sylvaticum . + + . + + + . + + IV 0,35<br />
H Eua 3 3 0 D Campanula persicifolia + + + . + . + + + + IV 0,4<br />
H E 4.5 3 3 P Carex remota + . + . + . + + + + IV 0,35<br />
H Eua 3 2 2 DP Cruciata glabra . + . + + + . + + + IV 0,35<br />
H Cosm 4 3 0 P Dryopteris fili–mas + . + 1 1 2 + + + . IV 3<br />
H Eua 4 3 2 P Festuca gigantea . + + + + + . . + + IV 0,35<br />
H Eua 3 2.5 0 D Fragaria vesca + + . + + . + . + + IV 0,35<br />
Th Eua 3 2 0 D Galeopsis speciosa + . + . . + + + + + IV 0,35<br />
H Eua(Med) 3 3 4 P Geum urbanum + + . + . + + + + . IV 0,35<br />
nPh Atl-Med 3 3 3 P He<strong>de</strong>ra helix + + + 1 + . + + . + IV 0,85<br />
Th Eua(Med) 2.5 3 3 D Lapsana communis . . + + + + + + . + IV 0,35<br />
H Eua 3 0 4 D Melica nutans + + + . . + + + + + IV 0,4<br />
H E 2.5 3 4 D Melica uniflora + . + + + + + . + . IV 0,35<br />
H E 3 3 0 D Mycelis muralis + + + + + . . + + + IV 0,4
254<br />
Mariana Laura LACATOŞ (HERMAN), Grigore Vasile HERMAN<br />
G Eua 3.5 0 3 CN Platanthera bifolia + . . + + + + + . + IV 0,35<br />
H Eua 3 3 0 D Stellaria holostea + + + + + . . + . + IV 0,35<br />
H Eua 3 3 4 D Astragalus glycyphyllos . + + + . + + + . . III 0,3<br />
G E(Med) 2.5 3 4 P Cephalanthera + . + . + . + + . . III 0,25<br />
damassonium<br />
G E 2.5 3 3 D Convallaria majalis + . + . + + + . + . III 0,3<br />
Th Cosm 3.5 3 3 P Geranium robertianum . . + . + . + . + + III 0,25<br />
H Eua 3 3 0 P Poa nemoralis . + + . . + + . + + III 0,3<br />
G Eua(Med) 2 3 4 D Polygonatum odoratum + + . + . . + + + . III 0,3<br />
MPh E 3 3 3 D Prunus avium . + + . . + + + . + III 0,3<br />
MPh E 2.5 3 0 D Quercus petraea + . . + + . . + . + III 0,25<br />
H Eua 3.5 0 0 P Stachys sylvatica . + + + . + . + + . III 0,3<br />
H Eua 3 3 3 P Viola reichembachiana + + . + . + . + + . III 0,3<br />
MPh E 2.5 3 3 D Acer campestre . . + . + + . + . . II 0,2<br />
MPh E 3 3 3 P Carpinus betulus . + . + . + . . + . II 0,2<br />
Accompanying<br />
H Eua 3 0 3 D Galium molugo + + + . . + + . + + IV 0,35<br />
H Ec 4.5 2 0 D Chaerophyllum hirsutum . . . + . . + + + . II 0,2<br />
L.f. = life forms; H = hemicryptophytes; Th = Annual terophytes; Ch = Chamaephytes; G = geophytes; MPh =<br />
Megaphanerophytes; nPh = Nanophanerophytes; F.e.= floristic elements; Eua = Eurasian; Ec = Central European; E =<br />
European; Carp-B = Carpathian-Balkanic; Atl-Med = Atlantic-Mediterranean; Cp = Circumpolar Cosm = Cosmopolitan; U<br />
= humidity, T = temperature, R = the chemical reaction of the soil; 2n = karyological spectrum; D = dyploid; P = polyploid;<br />
D, P = Dyplo-polyploid; CN = karyotype is not knows.<br />
Species that occur in a single releve: Cruciata laevipes, Equisetum maximum.<br />
Place and date of mapping: 1. Briciu Valley - Miheleu village, 25.07.2009; 2. Gepişanului<br />
Valley - Gepiş village, 31.05.2009; 3. Luncile Valley - Lăzăreni village, 02.06.2009; 4. BiŃişagului<br />
Valley - Lăzăreni village, 02.06.2009; 5. Hodişel Valley - Holod village, 28.06.2009; 6.<br />
Şumugiului Valley – Sititelec village, 28.05.2009; 7. Surupa Valley - Oşand village, 22.08.2009;<br />
8. Forest Şumugiu - Mierlău village, 22.08.2009; 9. Forest Dumbrava - Mierlău village,<br />
25.07.2009; 10. Forest Gruiului - Copăcel village, 07.06.2009.<br />
The presence of Festuco drymejae-Fagetum association in these hills was conditioned by local<br />
specific topoclimatic conditions, generated by the existence of some orographic thermal inversions.<br />
The explanation for the existence of beech in Lăzăreni Hills is closely linked to physical<br />
and geographical conditions encountered in this area. Although beech vegetates at altitu<strong>de</strong>s above<br />
1200 m in the latitudinal range of conditions between 40º - 45º, we will see that here it is an<br />
exception to the rule mentioned above. The scientific explanation of this is attributed to thermal<br />
inversions occurring at the level of topoclimate along the valleys such as: Gepişanului Valley,<br />
Luncile Valley, BiŃişagului Valley, Şumugiului Valley, Surupa Valley etc., cold air masses taking<br />
refuge along them generating conditions conducive to the emergence and <strong>de</strong>velopment of beech.<br />
Deciduous forests in general in Piedmont Lăzăreni suffered in recent years (1990 - 2008)<br />
because of the economic <strong>de</strong>gradation that caused serious damage to the exploitation of timber.<br />
The result of human impact is that a large number of species, some of them having en<strong>de</strong>mic<br />
value, disappeared or will disappear.<br />
ACKNOWLEGMENTS<br />
This contribution was partially suported by POSDRU/59/1.5/S/1 research project. The<br />
authors acknowledge to anonymous reviewer for their throughtful suggestions and comments.<br />
REFERENCES<br />
Ar<strong>de</strong>lean A. (2002), Conserving the vegetation of the Codru-Moma Mountains, one of the last afforested karst in the<br />
Europe. Proceedings of the Symposiom Restoration Ecology. Editura Orizonturi Universitare, Timişoara;<br />
Borhidi A. (1996), Critical revision of the Hungarian plants communities, Janus Pannonius University, Pécs, pp. 43-94;<br />
Borza A., Boşcaiu N. (1965), Introducere în studiul covorului vegetal. Editura Aca<strong>de</strong>miei Române, Bucureşti;<br />
Braun-Blanquet J. (1964), Pflanzensoziologie. Spinger Verlag, Wien-New-York, 3, Aufl, pp. 12 – 24;
Contributions to the Knowledge of the Association of Festuco Drymea-Făgetum… 255<br />
Braun-Blanquet J., Pavillard J. (1928), Vocabulaire <strong>de</strong> Sociologie Végétale. 3 th edition, Imprimérie Lemair-Ardres, pp. 15 – 18;<br />
Burescu P., Cheregi V. (2002), Flora pădurilor cu funcŃie recreativă componentă fundamentală a calităŃii mediului şi a<br />
vieŃii din staŃiunea balneoclimaterică Băile 1 Mai Ora<strong>de</strong>a), Analele UniversităŃii din Craiova, Editura<br />
UniversităŃii din Craiova, 7: 155-159;<br />
Burescu P., DoniŃă N., Burescu L. (2002), Flora pădurilor <strong>de</strong> şleau <strong>de</strong> pe Dealurile Hidişelului (Ocol Silvic Ora<strong>de</strong>a)<br />
Ju<strong>de</strong>Ńul Bihor, Analele UniversităŃii din Ora<strong>de</strong>a, Fascicula Silvicultură, Editura UniversităŃii din Ora<strong>de</strong>a, Ora<strong>de</strong>a;<br />
Burescu P., Lacatoş L. (2010), Contributions to the knowledge of hornbeam and beech forests, from Lăzăreni Hills (NW<br />
Romania), Analele UniversităŃii din Ora<strong>de</strong>a, Fascicula Biologie, No. 1, TOM XVII, Editura UniversităŃii din<br />
Ora<strong>de</strong>a, Ora<strong>de</strong>a;<br />
Dragotă C. (2006), PrecipitaŃiile exce<strong>de</strong>ntare în România, Editura Aca<strong>de</strong>miei Române, Bucureşti;<br />
Dumiter Aurelia (2007), Clima şi topoclima oraşului Ora<strong>de</strong>a. Editura UniversităŃii din Ora<strong>de</strong>a, Ora<strong>de</strong>a;<br />
Groza Gh. (2008), Flora şi vegetaŃia MunŃilor Pădurea Craiului. Editura Risoprint, Cluj-Napoca;<br />
Gurău M. (2004), Flora şi vegetaŃia din <strong>de</strong>presiunea Caşin-Oneşti (sectorul CăiuŃi-Oituz). PhD thesis: „Alexandru Ion<br />
Cuza” University, Faculty of Biology, Iaşi, Romania;<br />
Karácsonyi C. (1995), Flora şi vegetaŃia ju<strong>de</strong>Ńului Satu-Mare, Editura Muzeului Sătmărean, Satu-Mare;<br />
Lacatoş (Herman) Mariana Laura, Burescu P. (2010), Phytocoenological research concerning the grasslands of Lăzăreni<br />
Hills (North-Western Romania), Analele UniversităŃii din Ora<strong>de</strong>a, Fascicula Biologie, No. 1, TOM XVII, Editura<br />
UniversităŃii din Ora<strong>de</strong>a, Ora<strong>de</strong>a;<br />
Lacatoş (Herman) Mariana Laura (2010a), Description of Tilia tomentosae-Carpinetum betuli Association from Lăzăreni<br />
Hills (Northwestern Romania), Analele UniversităŃii din Ora<strong>de</strong>a, Fascicula ProtecŃia Mediului, Vol. XIV, Anul 15,<br />
Editura UniversităŃii din Ora<strong>de</strong>a, Ora<strong>de</strong>a;<br />
Lacatoş (Herman) Mariana Laura (2010b), Phytocoenological Researches on the grasslands of Lăzăreni Hills<br />
(Northwestern Romania, Analele UniversităŃii din Ora<strong>de</strong>a, Fascicula ProtecŃia Mediului, Vol. XIV, Anul 15,<br />
Editura UniversităŃii din Ora<strong>de</strong>a, Ora<strong>de</strong>a;<br />
Marian M. (2008), Flora şi vegetaŃia Culmii Codrului, Editura UniversităŃii <strong>de</strong> Nord Baia-Mare, Baia-Mare;<br />
Nicolin A., Imbrea M. (2009), Aspects of the Flora end Vegetation of the „Izvorul Bigăr” Nature Reserve (South Western<br />
Romania. Notulae Botanicae Horti Agrobotanici, Cluj-Napoca, 37(1): 54-58;<br />
Oprea A. (2005), Lista critică a plantelor vasculare din România, Editura UniversităŃii „Al. I. Cuza”, Iaşi;<br />
PăşcuŃ C., Burescu P. (2010), Contributions to the phytocoenologic study in pure European beech stand forests in Codru-<br />
Moma mountains (North-Western Romania), Analele UniversităŃii din Ora<strong>de</strong>a, Fascicula Biologie, No. 1, TOM<br />
XVII, Editura UniversităŃii din Ora<strong>de</strong>a, Ora<strong>de</strong>a;<br />
Pop Gr. (2005), Dealurile <strong>de</strong> Vest şi Câmpia <strong>de</strong> Vest, Editura UniversităŃii din Ora<strong>de</strong>a, Ora<strong>de</strong>a;<br />
Pop I., Cristea V., Hodişan I. (2002), VegetaŃia Ju<strong>de</strong>Ńului Cluj. (Studiu fitocenologic, ecologic, bioeconomic şi<br />
ecoprotectiv), ContribuŃii Botanice, Cluj-Napoca, 35(2): 5-254;<br />
Pott R. (1995), Pflanzengesellschaften Deutschlands, 2 Aufl., Ulmer Verlag, Stuttgart, pp. 124-128;<br />
RaŃiu O., Gergely I. (1979), Caracterizarea sinecologică a principalelor fitocenoze lemnoase din łara Oaşului (ju<strong>de</strong>Ńul<br />
Satu-Mare), ContribuŃii Botanice, Cluj-Napoca, pp. 85-118;<br />
RăduŃoiu D. (2006), Flora şi vegetaŃia bazinului Cernei <strong>de</strong> OlteŃ, PhD thesis: University of Agricultural Sciences and<br />
Veterinary Medicine, Faculty of Horticulture, Bucharest, 278 p;<br />
Sabău N., DomuŃa C., Berchez O. (2002), Geneza, <strong>de</strong>gradarea şi poluarea solului, Editura UniversităŃii din Ora<strong>de</strong>a,<br />
Ora<strong>de</strong>a;<br />
Sanda V., Öllerer K., Burescu P. (2008), Fitocenozele din România, sintaxonomie, structură, dinamică şi evoluŃie, Editura<br />
Ars Docendi Bucureşti;<br />
łicleanu N. (2008), Geologie generală, EdiŃia II-a Revizuită, Editura Universitară Bucureşti.<br />
Submitted: Revised: Accepted and published online<br />
May 28, 2011 July 29, 2011 Octomber 07, 2011
Analele UniversităŃii din Ora<strong>de</strong>a – Seria Geografie Year XXI, no. 2/2011 (December), pp. 256-266<br />
ISSN 1454-2749, E-ISSN 2065-1619 Article no. 212111-533<br />
GENESIS AND DYNAMICS OF A GEO-DEMOGRAPHIC<br />
SINGULARITY. A CASE STUDY - THE GIPSY COMMUNITY OF<br />
TOFLEA (BRĂHĂŞEŞTI COMMUNE, GALAłI COUNTY) 1<br />
Ionel MUNTELE ∗<br />
„Alexandru Ioan Cuza” University of Iaşi, Faculty of Geography and Geology,<br />
Department of Geography, Carol I Avenue, no 11, 700506, Iaşi, România, e-mail: imuntele@yahoo.fr<br />
Raluca HOREA-ŞERBAN<br />
„Alexandru Ioan Cuza” University of Iaşi, România, Faculty of Geography and Geology,<br />
Department of Geography, Carol I Avenue, no 11, 700506, Iaşi, Romania, e-mail: ralusel@yahoo.com<br />
Abstract: During the last two <strong>de</strong>ca<strong>de</strong>s Romania has experienced one of the most serious<br />
<strong>de</strong>mographic crises in its history. But regardless of this context, certain communities manage<br />
to preserve their <strong>de</strong>mographic vitality at the local level in close connection to their cultural<br />
and social features. It is the case of Brăhăşeşti commune in GalaŃi County, known for the<br />
large gipsy community living in Toflea, one of its component villages. Its recent <strong>de</strong>mographic<br />
evolution extending over the last <strong>de</strong>ca<strong>de</strong>s points out its strong differentiation within the<br />
county. Being characterized by ten<strong>de</strong>ncies which are opposed to the general ones, this<br />
community manages not only to keep its exceptional <strong>de</strong>mographic potential but also to<br />
produce, by means of migration, a real dissemination in a relatively vast space comprising the<br />
whole south-eastern part of Moldavia. The main conclusion of the research is that this<br />
community has become not only the main population reservoir of the whole north-western<br />
part of GalaŃi county but also the principal source of serious social problems as a consequence<br />
of the dimension of certain specific phenomena.<br />
Key words: <strong>de</strong>mographic singularity, gypsies, dynamics, cultural features, territorial<br />
distribution<br />
* * * * * *<br />
INTRODUCTION<br />
The present study, part of a larger project meant to i<strong>de</strong>ntify the genesis and effects of the<br />
multiple differentiations existing in the Moldavian rural space, is inten<strong>de</strong>d to advance a diachronic<br />
analysis of the way in which a community (the gypsies of Toflea-Brăhăşeşti in our case) manifests<br />
its personality at the <strong>de</strong>mographic level. The way in which cultural peculiarities bring about<br />
<strong>de</strong>mographic cleavages is apparently simple, being triggered by various socio-cultural or economic<br />
phenomena such as: marginalization, i<strong>de</strong>ntitary withdrawal, discrimination etc. In this direction,<br />
the case of gypsy communities is exemplary, any place that records a consi<strong>de</strong>rable concentration<br />
1 This study refers to western part of historical Moldavia, part of Romania (8 counties of the North-East of this country).<br />
For disambiguation, in the text was used also the term Western Moldavia.<br />
∗ Corresponding Author<br />
http://istgeorelint.uora<strong>de</strong>a.ro/Reviste/Anale/anale.htm
Genesis and Dynamics of a Geo-Demographic Singularity. A Case Study - The Gipsy… 257<br />
of people belonging to this minority experienceng a significant <strong>de</strong>mographic differential. This<br />
finds expression in the preservation of a more traditionalist <strong>de</strong>mographic behaviour and the<br />
manifestation of certain life quality <strong>de</strong>ficiencies (smaller values of life expectancy at birth, higher<br />
rates of infant mortality, specific evolutions of the morbidity rate etc). Generally regar<strong>de</strong>d as a<br />
<strong>de</strong>licate matter, the gypsy-like special nature cannot be compared, at least within the Romanian<br />
space, to that of other (ethnical or religious) communities. Neither can it be generalized as long as<br />
gypsy collectivities find themselves in diverse stages of social and economic mo<strong>de</strong>rnization,<br />
integration, assimilation etc.<br />
At this point of the analysis the term „geo-<strong>de</strong>mographic singularity” needs to be accurately<br />
<strong>de</strong>fined. It <strong>de</strong>signates the situation in which a component of a territorial (geographical)<br />
<strong>de</strong>mographic system records an evolution that is singular, exceptional to the general trends that<br />
take place within that subsystem. Such a singularity can represent the starting point of a new<br />
ten<strong>de</strong>ncy which, by diffusion, can conquer larger and larger areas. As a matter of fact, all<br />
<strong>de</strong>mographic phenomena score a more or less singular manifestation at the beginning. However, in<br />
the present case, this singularity is doubled by a series of social, cultural and economic features<br />
which completely differentiate the analysed community both from the territorial-administrative<br />
and physical geographical systems it is integrated into.<br />
The case study we carried out focuses on the largest community of this type in Moldavia,<br />
lying in a peripherical, relatively isolated area in the southern part of Tutova Hills, a geographical<br />
region that shelters some other similar communities, too, communities which are inserted in a<br />
system of settlements traditionally dominated by the small peasant property 2 . This geographical<br />
area is known by its profoundly rural nature and scarcity of subsistential resources, elements that<br />
triggered a massive participation in the internal migratory flows of the communist period.<br />
Nowadays, Brăhăşeşti commune, situated in the extreme north of GalaŃi county, comprises<br />
four villages: two bigger ones (Brăhăşeşti and Toflea) and two smaller ones (Corcioveni and<br />
CosiŃeni). The gypsy community of Toflea (counting two thirds of the total commune population<br />
of about 8,900 inhabitants) represents the main object of our research but, for statistical reasons,<br />
we shall make use of the information on the commune as a whole, its geo-<strong>de</strong>mographic specificity<br />
being <strong>de</strong>eply marked by it. The first remark to make is that the self i<strong>de</strong>ntification with the gypsies<br />
is of absolutely recent date, the census of 2002 being the first to massively record this affiliation.<br />
While the other villages of the commune <strong>de</strong>rive from old free hol<strong>de</strong>r’s communities<br />
gradually integrated in feudal structures, Toflea village is relatively recent, the first documentary<br />
mention being that recor<strong>de</strong>d in the first catagraphy of Moldavia 3 , drawn up in the year 1803, which<br />
speaks of „the tax-payers in Toflea hermitage” (Codrescu, 1886). The forest area covering the<br />
higher part of Nicoreşti Piedmont, still well afforested nowadays, used to accommodate more<br />
hermitages and monasteries, some of them still existing today (such as Buciumeni, Sihastru etc).<br />
Without forming a proper locality, the monastic settlement experienced an expanding evolution,<br />
being marked on the Russian map of 1828 as a hamlet with 5 up to 20 houses near which, on the<br />
present precincts of the village, to the south-east, there was another hamlet, bigger than the former<br />
(comprising 36 houses), called Rufeşti. The first mo<strong>de</strong>rn census in Moldavia, carried on in 1859 -<br />
1860, revealed a number of 1,242 inhabitants for Toflea village (2,995 inhabitants for the whole<br />
commune), a spectacular leap for only several <strong>de</strong>ca<strong>de</strong>s, whose explanation resi<strong>de</strong>s in the fact that,<br />
during the period of time between the two censuses, a numerous collectivity of gypsies settled<br />
down in the area. By 1948 (for nearly a century), the <strong>de</strong>mographic evolution (as much as we can<br />
infer from exploring the population dynamics) was not very much different from that of the<br />
2 The most well-known communities are those in Băcioi (Corbasca commune, Bacău county) and Homocea commune<br />
(Vrancea county), during the interwar period both of them being inclu<strong>de</strong>d (just like Toflea-Brăhăşeşti) into Nicoreşti<br />
“plasa”, Tecuci county. As a matter of fact, that “plasa” was recor<strong>de</strong>d by certain scientific papers of the time (Obreja, 1943)<br />
to have the greatest percentage of gipsies in Moldavia (the word “plasa” refers to a former Romanian territorial<br />
administrative unit ranking below “county” and above “commune”).<br />
3 In Romanian it is called „Condica Liuzilor”, representing a sort of tax-payers’ registry book.
258<br />
Ionel MUNTELE, Raluca HOREA-ŞERBAN<br />
neighbouring settlements, being relatively slow: 1,513 inhabitants in 1912 (out of the 3,484 people<br />
of the commune); 1,914 inhabitants in 1941 (out of the 4,444 people living in the whole<br />
commune). Instead, the post war evolution was subject to a continuous ten<strong>de</strong>ncy of singularization<br />
in comparison to the general specificities of the rural environment of the county (figure 1).<br />
1912=100<br />
300<br />
200<br />
Toflea village<br />
Brăhăşeşti<br />
commune<br />
GalaŃi county<br />
(rural area)<br />
100<br />
1912 1930 1941 1948 1956 1966 1977 1992 2002<br />
Figure 1. Comparative analysis of the number of inhabitants<br />
according to the censuses carried out from 1912 to 2002<br />
(Source: The censuses taken between 1912 - 2002 in Romania)<br />
This ten<strong>de</strong>ncy became more and more conspicuous with every intercensus period until<br />
1977, when the direction changed the other way round: while the rural environment passed<br />
through a <strong>de</strong>mographic <strong>de</strong>cline (an evolution which was quite normal from the perspective of the<br />
consequences of the rural exodus), Toflea village experienced a contrary <strong>de</strong>velopment,<br />
materialized in a stronger and stronger ten<strong>de</strong>ncy of explosive <strong>de</strong>mographic increase. The<br />
population grew from only 2,504 inhabitants in 1956 to 3,667 in 1992 and 5,479 in 2002 census.<br />
This means that from 1941 to 2002 (that is six <strong>de</strong>ca<strong>de</strong>s) this village faced a threefold increase of its<br />
total population <strong>de</strong>spite the combined influences of the last world war, the drought in 1946 - 1947<br />
(which worked havoc in the area) and the rural exodus which massively involved the population of<br />
this commune (only from 1966 to 1989 the migratory balance recor<strong>de</strong>d a <strong>de</strong>ficit of 2,366<br />
inhabitants, the annual average rate being of -1.9%, clearly superior to the national one). The more<br />
and more prominent growth after 1990 can also be ascribed to the massive rural return, the<br />
migratory balance rising to 1,540 people between 1990 - 2002, subsequently reaching a relative<br />
equilibrium between arrivals and <strong>de</strong>partures. In this way a significant part of the previous exodus<br />
managed to be counteracted in a relatively short period of time. This significant return can hardly<br />
be explained taking into consi<strong>de</strong>ration the more than precarious natural offer and the extremely<br />
high subsistential <strong>de</strong>nsity of the area (3,053 ha out of the 4,361 ha of the commune have an<br />
agricultural use - arable lands, pastures etc, causing a level of about 300 inhabitants / 100 hectares<br />
of agricultural land). The spectacular withdrawal of a significant part of the people who had<br />
formerly left their birth locality can also be granted extra explanations which refer to: the previous<br />
dispersion connected to the traditional practices of gypsy communities, the <strong>de</strong>structuring of a life<br />
style based on the peddling of the products resulted from specific handcraft activities (producing<br />
or repairing metal containers), the adherence to the Pentecostal cult of an important part of the<br />
population after the year 2001 (586 followers in 2002, more than 1,000 at the present according to<br />
official estimations), all of them superposed on the effects of transition.
Genesis and Dynamics of a Geo-Demographic Singularity. A Case Study - The Gipsy… 259<br />
Interesting and contradictory at the same time, this evolution can arouse a special interest in<br />
the context of the discordance with the major social and economic evolutions experienced all over<br />
the country after 1990.<br />
BRĂHĂŞEŞTI COMMUNE AND THE GEO-DEMOGRAPHIC DISPARITIES IN<br />
GALAłI COUNTY DURING THE LAST TWO DECADES<br />
A first analysis meant to highlight the extreme specificity of the case study was performed on<br />
the components of the natural balance at the level of the basic administrative units of GalaŃi county.<br />
The collected official information was processed in typological classifications with the help<br />
of Statlab program, using the birth, mortality and general fertility indicators of the feminine<br />
population. We kept 6 types of evolution of the components of the natural balance which<br />
emphasize the existence of a general ten<strong>de</strong>ncy of strong <strong>de</strong>crease of the fertility indicators in all<br />
the administrative units of the county except one: Brăhăşeşti commune, which clearly stands out,<br />
forming a special singular type.<br />
Having a birth rate which initially complied with the general <strong>de</strong>cline trend installed after<br />
1990 but which rapidly recovered to values sometimes exceeding 30‰ towards the middle of the<br />
90’s and with a generally <strong>de</strong>creasing mortality rate with constant values of less than 10‰, this<br />
commune <strong>de</strong>finitely diverges from the others. After the year 2000 the phenomenon has<br />
strengthened un<strong>de</strong>r the circumstances in which the whole county has been facing a speeding<br />
<strong>de</strong>cline triggered by the effects of the international migration of the labour force. The drawn up<br />
classification partially emphasizes the influence of the presence of the gypsy communities which<br />
enforce a certain resistance to the <strong>de</strong>cline ten<strong>de</strong>ncy of births in those areas where they hold a<br />
consi<strong>de</strong>rable share (of at least 5% of the total population).<br />
The urban centres and the peri-urban area of GalaŃi also stand out due to a perceptibly<br />
different behaviour characterized by a permanent low level of both indicators which finds<br />
expression in a natural balance close to 0 and a recent timid recovery ten<strong>de</strong>ncy of birth values.<br />
There can also be noticed a convergent evolution of birth rates, once more with the exception of<br />
Brăhăşeşti commune: the noteworthy differences at the beginning of the period gradually vanish<br />
after the year 2000. However, this does not stand true in the case of the evolution of the mortality<br />
rate, which experienced a contrasting manifestation: the rapidly rising ten<strong>de</strong>ncy of the 90’s was<br />
followed by a quasi-stagnation (at high values) resulting in a profoundly negative natural balance<br />
in compliance with a gradient going from the west to the north-east of the county, already caught<br />
in the trap of an irreversible <strong>de</strong>vitalisation. Nevertheless certain localities represent exceptions to<br />
this evolution: Tecuci and GalaŃi municipalities- due to a still favourable population structure; the<br />
peri-urban areas and the commune that represents the object of the present case study - Brăhăşeşti<br />
(figures 2 and 3). Its extreme vitality, undoubtedly imputable to the strong gypsy community<br />
living in Toflea, can bear the following explanations:<br />
- the end of the birth <strong>de</strong>cline in the middle of the 90’s is the result of a complex<br />
combination between the rural return, the preservation of some numerically significant contingents<br />
of young feminine population and the resistance <strong>de</strong>rived from a traditionalist <strong>de</strong>mographic<br />
behaviour generally specific to gypsy communities, especially to compact ones;<br />
- the relative isolation of the commune cannot be taken into account as long as people who<br />
practise certain activities are predisposed to an intense mobility on large areas (itinerant<br />
commerce, collecting reusable materials);<br />
- the relative absence of a completely mo<strong>de</strong>rnized behaviour pattern can also be called<br />
forth, the Romanian population itself in the area later entering the more advanced phases of<br />
transition (however it crossed them very rapidly as it is proved by the analysis of the evolution of<br />
the feminine population fertility).<br />
This hypothesis is also taken into account by certain studies financed by the European<br />
Commission which certify the existence of a <strong>de</strong>phased, divergent <strong>de</strong>mographic pattern of the<br />
gypsy communities in Europe (Gabriella Fésüs et al., 2008, p.13-14);
260<br />
Ionel MUNTELE, Raluca HOREA-ŞERBAN<br />
Figure 2. Typology of the evolution of the natural balance components between 1990 - 2009<br />
(Source: according of Anuarul Statistic al ju<strong>de</strong>Ńului GalaŃi, 2010, Database „Tempo Online” of INS, Bucarest, found in sept.2010)<br />
- after the 2000 year the increase of the number of Pentecostal followers has brought about<br />
additional consequences. Known for its moral rigour in respect of family values, this cult was<br />
introduced in the gypsy community of Toflea in 1992, gradually gaining numerous supporters. The<br />
field surveys point out that generally Pentecostal families are consi<strong>de</strong>rably more numerous without<br />
necessarily belonging to more disfavoured categories. As a matter of fact, the commune as a whole<br />
is not inclu<strong>de</strong>d in the category of the least <strong>de</strong>veloped communes in GalaŃi county, these ones being<br />
preferably situated in its north-eastern part (Sandu, 1999, p. 208);<br />
- the lack of progress in the direction of the social and cultural integration of the gypsy community;<br />
- the majority of the population is practically semi-literate, school abandonment is<br />
significant (especially after the primary level of education more than half of the pupils gradually<br />
give up attending secondary studies) in opposition to a minority attending high schools in Tecuci<br />
and especially universities. Social contrasts get <strong>de</strong>eper and <strong>de</strong>eper: we <strong>de</strong>al, on the one hand, with<br />
a pick involved in various (not necessarily illicit) businesses and displaying an ostentatious life<br />
style and, on the other hand, with a majority which is practically <strong>de</strong>prived of any means of<br />
subsistence in the context of the quasi-absence of agricultural lands and of a weak propensity for<br />
agricultural work. This situation is also due to the fact that most families have never been put in
Genesis and Dynamics of a Geo-Demographic Singularity. A Case Study - The Gipsy… 261<br />
possession of land by virtue of the semi-nomadic character of their life style. The most part of the<br />
population can be <strong>de</strong>finitely inclu<strong>de</strong>d into the category of vulnerable communities which have a<br />
high <strong>de</strong>gree of social risk (Guran and Turnock, 2000, p. 139 - 150).<br />
‰<br />
40,0<br />
30,0<br />
Type 1 (Brăhăşeşti commune)<br />
birth rate<br />
mortality rate<br />
‰<br />
40,0<br />
30,0<br />
Type 2<br />
birth rate<br />
mortality rate<br />
20,0<br />
20,0<br />
10,0<br />
10,0<br />
0,0<br />
1990<br />
‰<br />
40,0<br />
30,0<br />
1993<br />
1996<br />
1999<br />
Type 3<br />
birth rate<br />
2002<br />
2005<br />
2008<br />
mortality rate<br />
0,0<br />
‰<br />
40,0<br />
30,0<br />
1990<br />
1993<br />
1996<br />
1999<br />
2002<br />
Type 4<br />
birth rate<br />
2005<br />
2008<br />
mortality rate<br />
20,0<br />
20,0<br />
10,0<br />
10,0<br />
0,0<br />
1990<br />
‰<br />
40,0<br />
30,0<br />
1993<br />
1996<br />
1999<br />
Type 5<br />
birth rate<br />
2002<br />
2005<br />
2008<br />
mortality rate<br />
0,0<br />
‰<br />
40,0<br />
30,0<br />
1990<br />
1993<br />
birth rate<br />
1996<br />
1999<br />
2002<br />
Type 6<br />
2005<br />
2008<br />
mortality rate<br />
20,0<br />
10,0<br />
0,0<br />
1990<br />
1993<br />
1996<br />
1999<br />
2002<br />
2005<br />
2008<br />
20,0<br />
10,0<br />
0,0<br />
1990<br />
1993<br />
1996<br />
1999<br />
2002<br />
2005<br />
2008<br />
Figure 3. Profile of the types of evolution of the natural balance components<br />
(Source: according of Anuarul Statistic al ju<strong>de</strong>Ńului GalaŃi, 2010)<br />
Another point that needs to be cleared up is whether this strong personalization of<br />
Brăhăşeşti commune is also due to its extremely favourable structure by age groups in comparison<br />
to most communes in the county which were subject to a much stronger migration of the young<br />
population during the last <strong>de</strong>ca<strong>de</strong>s of the communist period.<br />
For this purpose we also analysed the evolution of the feminine population’s (aged 15 - 49)<br />
general fertility rate during the same period of time. The specific statistical information was<br />
corroborated with the results of the population censuses of 1992 and 2002. In or<strong>de</strong>r to avoid the<br />
variability of the dynamics of this indicator, which is sometimes subject to circumstantial<br />
ten<strong>de</strong>ncies, the analysis ma<strong>de</strong> use of the averages of the four periods of the last two <strong>de</strong>ca<strong>de</strong>s. We<br />
observed the importance of the existence of the gypsy community to the evolution of this indicator<br />
by comparing Brăhăşeşti commune to the average of a group ma<strong>de</strong> up of 9 communes in which<br />
this minority holds a significant share (at least 5% of the total population according to the census<br />
of 2002) and to the average of the other 44 communes of the county, thus acknowledging the high<br />
originality <strong>de</strong>gree of the <strong>de</strong>mographic evolution of Brăhăşeşti commune (figure 4).
262<br />
Ionel MUNTELE, Raluca HOREA-ŞERBAN<br />
‰<br />
150,0<br />
125,0<br />
100,0<br />
1990-1994 1995-1999<br />
2000-2004 2005-2009<br />
75,0<br />
50,0<br />
25,0<br />
0,0<br />
Brahasesti<br />
commune<br />
communes with<br />
at least 5%<br />
gypsies<br />
other communes<br />
Figure 4. Evolution of the fertility of the feminine population (aged 15 - 49) from 1990 to 2009<br />
(Source: according of Anuarul Statistic al ju<strong>de</strong>Ńului GalaŃi, 2010)<br />
While all over the whole county this indicator records a continuous <strong>de</strong>cline (stronger in the<br />
case of those communes that do not have important gypsy minorities), the commune that<br />
represents the object of the present study stands out by two distinct stages <strong>de</strong>limited by an attempt<br />
at rowing up to the general trend of the rural environment of the county (around the years 1999 -<br />
2000). The last <strong>de</strong>ca<strong>de</strong> even faces a light recovery (especially after the year 2005) up to values that<br />
have been exceedingly rare in Romania for a long period of time (125 - 130 ‰). This situation can<br />
also be ascribed to the numerous generation born at the beginning of the 90’s, superposed on an<br />
extremely favourable structure by age groups, in the context of preserving a high marriages rate<br />
and a small average age at first marriage, a phenomenon which is typical of gypsy communities on<br />
the whole. The analysis by age groups of the fertility rate could highlight a possible ten<strong>de</strong>ncy of<br />
continuation of the transitory processes that seemed to be ongoing, slowly but surely until the year<br />
1990, as the evolution of the young population’s share shows (the population aged 0 - 14): 39.1%<br />
in 1966, 38.3% in 1977, and 29.7% in 1992. In the year 2002 this indicator is significantly higher<br />
(32.9%), the structure by age groups being even more favourable than during the previous period.<br />
The keeping of a high fertility rate is certainly connected to the „rejuvenation” of <strong>de</strong>mographic<br />
structures but also to the absence or precarity of adjustment to the national and regional<br />
<strong>de</strong>mographic pattern, in contrast with the conclusions advanced by certain authors, which stand<br />
true only at a regional or zonal scale but not at the local one (Trebici and Ghinoiu, 1986, p. 117).<br />
The performed summary surveys point out a certain ten<strong>de</strong>ncy of consi<strong>de</strong>rable <strong>de</strong>crease of the<br />
family size within the young generation (aged 20 - 30 years) in close connection to their<br />
educational level. We can state that this community is still ruled by mentalities which are typical<br />
of a traditional <strong>de</strong>mographic regime, at least from the perspective of the importance and values<br />
they attach to the phenomenon of birth, the transition to a more advanced <strong>de</strong>mographic pattern<br />
usually assuming a price meant to provi<strong>de</strong> the young generation’s education and professional<br />
formation (according to the i<strong>de</strong>as set forth by Bacci, 2003, p. 217).<br />
The investigation of Brăhăşeşti commune within the framework of the whole county<br />
reveals that during the last two <strong>de</strong>ca<strong>de</strong>s it has become the main „reservoir” of rural population. Its<br />
share in the evolution of the county <strong>de</strong>mographic balance has consi<strong>de</strong>rably increased (figure 5).<br />
Thus, while from 1990 to 1995 it provi<strong>de</strong>d 4% of the total number of rural live-births, after the<br />
year 2004 it has constantly excee<strong>de</strong>d the value of 7% (and even that of 12% in the year 2009) in<br />
the context in which the <strong>de</strong>cline of births has worsened in most county communes. Its share in the
Genesis and Dynamics of a Geo-Demographic Singularity. A Case Study - The Gipsy… 263<br />
total number of the rural population has remained relatively constant all throughout this period<br />
(about 3%) due to the consi<strong>de</strong>rable migratory flow it has generated as an expression of its<br />
un<strong>de</strong>niable <strong>de</strong>mographic pressure.<br />
12<br />
10<br />
% of total life<br />
births<br />
8<br />
6<br />
4<br />
2<br />
0<br />
1990<br />
1993<br />
1996<br />
Figure 5. Evolution of Brăhăşeşti commune’s share in the total number of live-births in the rural environment<br />
of GalaŃi County, between 1990 - 2009<br />
(Source: according of Anuarul Statistic al ju<strong>de</strong>Ńului GalaŃi, 2010)<br />
Beyond this apparent paradox, we must accept the i<strong>de</strong>a that this community will play the<br />
role of a population supplier not only for the areas situated in its close vicinity but also for the<br />
others. The qualitative analysis resulted from direct field observation correlated with statistical<br />
information certifies the shaping in time of a diffusion area of this population which has brought<br />
its contribution either to the repopulation of some boroughs which had been left by Jew people (as<br />
it is the case of Iveşti, GalaŃi county, where the community that came into being in this manner<br />
already represents more than one fourth of the locality population, or of Podu Turcului - but here<br />
in a smaller number), or to the setting up of some new communities within settlements in which<br />
gypsies had not previously existed (Munteni, Umbrăreşti - Deal, Lieşti etc, getting to shares of 5 -<br />
15% of the total population), or joining small contingents of gypsies, often at relatively large<br />
distances, as it is the case of Grajduri and Lunca CetăŃuii communes in Iaşi county (figure 6).<br />
Brăhăşeşti village represents a particular case - the actual territorial fusion with Toflea<br />
supplied it with a significant flow of population, so that the gypsies’ percentage as recor<strong>de</strong>d by the<br />
census of 2002 excee<strong>de</strong>d 13%, the value being certainly un<strong>de</strong>restimated. This quantitative<br />
contribution also reflects itself in a higher illiteracy rate in comparison to the other villages of<br />
comparative size in the area: 10.1% in opposition to 2 - 3% in łepu, Gohor, Buciumeni etc. This<br />
value is undoubtedly imputable to the gypsy population which represents 35.3% of the total<br />
population of Toflea, this percentage being comparable to that of a neighbouring commune lying<br />
in Vrancea county Homocea, which holds an important partially assimilated gypsy community.<br />
This melting ten<strong>de</strong>ncy experienced by Brăhăşeşti can gradually project itself into an inversion of<br />
the ethnic ratios as a consequence of the prolification of the gypsy community.<br />
Their diffusion area has also inclu<strong>de</strong>d a series of se<strong>de</strong>ntary gypsy communities (such as<br />
those in the communes of Ghidigeni - Gefu and Tălpigi villages, Movileni and Barcea - Podoleni<br />
village) with whom they have <strong>de</strong>veloped family relationships, many times established in the urban<br />
centres of the region. However their level is low because of the fact that Toflea gypsies preserve a<br />
certain specific i<strong>de</strong>ntity which makes them be regar<strong>de</strong>d as a distinct category in the area.<br />
1999<br />
2002<br />
2005<br />
2008
264<br />
Ionel MUNTELE, Raluca HOREA-ŞERBAN<br />
Figure 6. Dispersion of Toflea population and its connections to other gypsy communities in the South-<br />
Eastern part of Moldavia<br />
(Source: censuses taken in 1930, 1992 and 2002 in Romania)<br />
Another favourite <strong>de</strong>stination is represented by the neighbouring towns: first and foremost<br />
Tecuci but also Mărăşeşti and Adjud - towns that play the role of railway junction stations; Bârlad<br />
and especially GalaŃi - the county capital city. The affiliation of a part of the population to the<br />
Pentecostal cult has recently allowed relationships with similar communities in Transylvania.<br />
Their main diffusion area practically overlaps the space within which they used to traditionally<br />
practice an itinerant commerce and carry out services in the field of repairing various containers<br />
and installations of domestic use (especially alembics). This activity has greatly narrowed after<br />
1990, gypsies being replaced by numerous private firms that <strong>de</strong>al with collecting recyclable<br />
materials, this situation being favoured by the <strong>de</strong>structing of the industrial activities in the nearby
Genesis and Dynamics of a Geo-Demographic Singularity. A Case Study - The Gipsy… 265<br />
towns and by the restriction of rail activities in Tecuci, Mărăşeşti and Adjud. They have also<br />
established privileged (many times illegal) relationships with the iron and steel works in GalaŃi,<br />
recycling activities getting them in touch with other active gypsy communities in the area. In<br />
certain cases, the accumulation of a significant financial capital allowed them to <strong>de</strong>velop<br />
commercial activities (more than 33 officially registered commercial associations according to the<br />
information provi<strong>de</strong>d by Brăhăşeşti mayoralty) or even to get involved in privatising certain<br />
industrial or service-carrying out units. This latest ten<strong>de</strong>ncy has shaped a new point of attraction:<br />
the capital city of the country, which houses societies set up by some of the most flourishing<br />
entrepreneurs in the village. However these outliving strategies prove to be precarious as a<br />
consequence of the impossibility of breaking free from the spiral of a chronic un<strong>de</strong>r<strong>de</strong>velopment.<br />
The <strong>de</strong>epening of the intracommunity discrepancies superposed on the population explosive<br />
increase are susceptible of „feeding” both the internal tensions and the pressures <strong>de</strong>rived from the<br />
relationships they <strong>de</strong>velop with the population in the neighbouring villages.<br />
Any summary prevision drawn up by extrapolation of the present ten<strong>de</strong>ncies inevitably<br />
leads to the preservation of an extremely important increasing potential, at least for the next two<br />
<strong>de</strong>ca<strong>de</strong>s, in spite of the population erosion which has been triggered by permanent migration. The<br />
overpopulation critical threshold has been undoubtedly surpassed if we dwell on the subsistential<br />
<strong>de</strong>nsity, the community of Toflea disposing of only about 500 hectares of agricultural land<br />
(according to field estimations) un<strong>de</strong>r the circumstances in which just a small part of the<br />
inhabitants own agricultural lands and practice agriculture.<br />
If, against all reasons, the population migration were stopped, the number of inhabitants of<br />
Brăhăşeşti commune would increase at least with 60% by the year 2030 in the context of the<br />
preservation of the present increase rate which, as shown by means of the analysis of the general<br />
fertility rate, does not show signs of <strong>de</strong>cline. The migration process is not liable to ero<strong>de</strong> the<br />
exceptional <strong>de</strong>mographic vitality as long as it <strong>de</strong>als with a family, collective rather than individual<br />
migration. This ensures a surplus of originality to this commune and especially to the gypsy<br />
community in Toflea which dominates it from the <strong>de</strong>mographic point of view.<br />
CONCLUSION<br />
The analysis we carried out by means of direct observation and processing the information<br />
provi<strong>de</strong>d by specialized institutions, prove the strong originality of the <strong>de</strong>mographic evolution of<br />
the investigated commune, an evolution which is practically fully opposed to the general<br />
ten<strong>de</strong>ncies experienced by the Romanian society. Whether at the local level it can be regar<strong>de</strong>d as<br />
singular, it is possible that similar situations exist at the national level, too. In the eastern part of<br />
the country, the commune of Slobozia Bradului situated in Vrancea county, at the north of<br />
Râmnicu Sărat, has recor<strong>de</strong>d, up to a certain point, an almost i<strong>de</strong>ntical evolution; a similar<br />
ten<strong>de</strong>ncy is also typical of certain gypsy communities in Bacău, Suceava and Iaşi counties. Some<br />
of them are generally smaller and do not induce effects which resemble those of our case study,<br />
quite often finding themselves in a more advanced integration stage. Certain studies point out a<br />
strong correlation between the integration level and the <strong>de</strong>mographic evolution of gypsy<br />
communities - it is the case of an ample research on the gypsies in Slovakia published by<br />
Potančoková et al. 2008. Thus, the socio-economic specificity of these communities is doubled by<br />
a geo-<strong>de</strong>mographic specificity illustrated by distinct spatial and reproductive behaviours that<br />
scientists have quite rarely approached (Costachie et al., 2010).<br />
However the present investigation also highlights another reality: although touched by the<br />
<strong>de</strong>mographic crisis Romania still needs, strictly at the local level, <strong>de</strong>natalist <strong>de</strong>mographic policies<br />
which are specific to <strong>de</strong>veloping countries. Any <strong>de</strong>lay in the enforcement of some measures able to<br />
aim at mo<strong>de</strong>rnizing the <strong>de</strong>mographic behaviour of such communities can contribute to the<br />
sharpening of certain serious social problems such as those pictured by a valuation report drawn up<br />
by the World Bank, which bears testimony to the very strong correlation that exists between<br />
illiteracy and poverty within the gypsy communities in East Europe and particularly in Romania
266<br />
Ionel MUNTELE, Raluca HOREA-ŞERBAN<br />
(Revenga et al., 2002, p. 13 - 14). The actual integration of such communities as the one<br />
investigated by us also implies an adjustment to the exigencies of a contemporary society as<br />
regards the management of human resources.<br />
ACKNOWLEGMENTS<br />
This contribution presents some results from research projects, entitled „The quality of<br />
transport infrastructure as a premise of rural spaces differentiation in Moldavia”, financed by the<br />
CNCSIS research program PNCD-IDEI (co<strong>de</strong> ID-1987). The authors acknowledge while to<br />
anonymous reviewer for their thoughtful suggestions and comments.<br />
REFERENCES<br />
Codrescu Th. (1886), Condica Liuzilor <strong>de</strong> la 1803, Uricariul, vol VIII, Iaşi;<br />
Costachie S., Dieaconu D., Teodorescu Camelia (2010), Several socio-economic and <strong>de</strong>mographic aspects of the Gypsies<br />
(Roma) from their first presences in the Romania and until the Second World War, Revista Română <strong>de</strong> Geografie<br />
Politică, vol.XII, no.1, p.91-97;<br />
Fésüs Gabriella, Rillaers Alexandra, Poelman H., Gáková Zuzana (2008), Demographic Challenges for European Regions,<br />
Directorate General for Regional Policy, Bruxelles;<br />
Guran Liliana, Turnock D. (2000), A preliminary assessment of social risk in Romania, Geojournal, Springer,<br />
vol.50, no.2-3, p.139-150;<br />
Livi Bacci (2003), PopulaŃia în istoria Europei, Editura Polirom, Iaşi;<br />
Obreja Al. (1943), ObservaŃii asupra răspândirii Ńiganilor în Moldavia, Lucrările seminarului „Dimitrie Cantemir”, nr. 3, Iaşi;<br />
Potančoková Michaela, Vaňo B., Pilinská Viera, Jurčová Danuša (2008), Slovakia: Fertility between tradition and<br />
mo<strong>de</strong>rnity, Demographic Research, vol.19, p.973-1018, Rostock;<br />
Revenga Ana, Ringold Dena, Tracy W.M. (2002), Poverty and Etnicity, A Cross Country Study of Roma Poverty in Central<br />
Europe, World Bank, Washington;<br />
Sandu D. (1999), SpaŃiul social al tranziŃiei, Editura Polirom, Iaşi;<br />
Trebici Vl., Ghinoiu I. (1986), Demografie si etnografie, Editura ştiinŃiifică şi enciclopedică, Bucureşti;<br />
*** Recensământul populaŃiei şi locuinŃelor din18.03.2002 în România, baza <strong>de</strong> date a INS, Bucureşti;<br />
*** Anuarul statistic al ju<strong>de</strong>Ńului GalaŃi, DJS GalaŃi, 2010;<br />
*** Tempo-Online, Baza teritorială <strong>de</strong> date, www.insse.ro.<br />
Submitted: Revised: Accepted and published online<br />
June 02, 2011 August 29, 2011 September 14, 2011
Analele UniversităŃii din Ora<strong>de</strong>a – Seria Geografie Year XXI, no. 2/2011 (December), pp. 267-275<br />
ISSN 1454-2749, E-ISSN 2065-1619 Article no. 212112-534<br />
THE VILLAGES FROM SĂLAJ IN THE EASTERN PART OF JIBOU<br />
LOCALITY – DEMOGRAPHIC POTENTIAL -<br />
Oana - Andreia PUIA ∗<br />
University of Bucharest, Faculty of Geography, „Simion MehedinŃi" Doctoral School,<br />
N. Bălcescu Blvd., No.1, sect.1, Bucharest, Romania, e-mail: oana76puia@yahoo.com<br />
Abstract: The present analysis follows the natural dynamic of population during the 1990-<br />
2010 interval using statistical data provi<strong>de</strong>d by the National Institute of Statistics (NIS), DSJ<br />
Sălaj, and data from local level. For the analysed territory, <strong>de</strong>mographic risks are represented<br />
by the unbalanced sex structure of population, the <strong>de</strong>scendant evolution of natality, to which<br />
the political-economic factor adds, an in consequence all administrative units are affected by<br />
<strong>de</strong>mographic ageing. The values of the ageing coefficient show that Băbeni and Letca are<br />
communes which belong to the fifth <strong>de</strong>mographic risk category (maximum) and the viability<br />
of these settlements is endangered.<br />
Key words: <strong>de</strong>mographic risk, population dynamic, communes, ageing, Sălaj<br />
* * * * * *<br />
INTRODUCTION<br />
Essential part of the Planning Territorial Unit Some Valley from Sălaj County (SCDP, 2006;<br />
DSPTUSV, 2009), the analysed geographic space is characterised by a high <strong>de</strong>gree of rurality, marked<br />
by the absence of urban settlements. The analysed unit unfolds between the counties Cluj (to the south<br />
and east); Maramures (to the north) and the rest of the Sălaj County to the west of the allignment of the<br />
localities Benesat - Surduc - Gârbou. The 14 communes and 83 constituent villages occupy a total<br />
surface of 852,64 sqkm and comprises 25,818 inhabitants, their number continuously <strong>de</strong>creasing by<br />
41.6% compared to the year 1992, when population was of 43,956 inhabitants (figure 1).<br />
Figure 1. The evolution of the number of inhabitants during the interval 1912 - 2010<br />
∗ Corresponding Author<br />
http://istgeorelint.uora<strong>de</strong>a.ro/Reviste/Anale/anale.htm
268<br />
Oana - Andreia PUIA<br />
The dynamic of population in the studied area emphasizes two evolution ten<strong>de</strong>ncies,<br />
clearly <strong>de</strong>limitated: an ascending ten<strong>de</strong>ncy until 1956, when the maximum number of inhabitants<br />
is reached (51,632); and a <strong>de</strong>scending ten<strong>de</strong>ncy, until present, whose increase rate, with a negative<br />
value, largely excee<strong>de</strong>d the <strong>de</strong>mographic growth from the first half of the XX-th century, leading<br />
to the present situation, of <strong>de</strong>mographic retrogression.<br />
Within the terittorial profile, the numeric evolution of the population presents the<br />
same characteristics, the difference being given by the rhythm in which the <strong>de</strong>crease of the<br />
number of inhabitants in the interval 1912 - 2010 produced, even if for short intervals of<br />
time some communes registered insignificant increases of population. In table no. 1 it can<br />
be noticed that the value of the increase rate of the population presents very large<br />
fluctuations, between -3.7% (Surduc) and -60% (Zalha), most of the studied communes -<br />
46% having an increase rate of -40%; -50%.<br />
Table 1. Increase rate (%) during the period 1912 - 2010<br />
(Data source: calculated by INS, DJS Sălaj)<br />
Name of locality<br />
Period<br />
Băbeni<br />
Benesat<br />
CristolŃ<br />
Gâlgău<br />
Gârbou<br />
Ileanda<br />
Letca<br />
Lozna<br />
Năpra<strong>de</strong>a<br />
Poiana<br />
Blenchii<br />
Rus<br />
Şimişna<br />
Surduc<br />
Zalha<br />
1912-1956 26,9 26,6 32,8 1,0 5,2 4,6 26,9 22,9 13,3 16,8 14,0 - 47,6 23,1<br />
1956-2010 -51,9 -33,6 -43,4 -42,6 -57,7 -36,8 -54,1 -56,4 -32,0 -44,8 -55,0 - -32,9 -62,6<br />
1912-2010 -42,5 -15,2 -25,1 -44,3 -55,9 -44,4 -49,1 -54,9 -29,1 -41,1 -48,7 - -3,7 -60,0<br />
Population <strong>de</strong>nsity, the direct expression of its territorial distribution, presented in figure<br />
2, un<strong>de</strong>rlines the higher concentration of population within the commune Bensat (55.4 inhabitants /<br />
sqkm), followed by Surduc (51.7 inhabitants / sqkm), and reduced values of the population are<br />
registered in Lozna (16.9 inhabitants / sqkm) and Zalha (18.6 inhabitants / sqkm).<br />
On the whole, the population of the analysed territory continues its <strong>de</strong>scending trajectory,<br />
started in the year 1956, with a rather alert rhythm after the year 1990, enframing in the national<br />
ten<strong>de</strong>ncy of <strong>de</strong>mographic evolution which is characteristic to the countries in transition towards a<br />
<strong>de</strong>veloped economy. In general, this numerical <strong>de</strong>crease of population is <strong>de</strong>termined by the natality<br />
<strong>de</strong>crease, mortality increase, rural-urban migration, which led to unbalances within the population<br />
structure and to the apparition of the phenomenon of <strong>de</strong>mographic ageing, to which historical and<br />
environment local factors add (Sorocovschi et al., 2009).<br />
The study of the natural movement of population starts from the number of births and<br />
<strong>de</strong>aths, these being indicators whose action upon the population of a territory is quantitatively<br />
shown by natality (or natality rate quantified by the number of births per 1000 inhabitants)<br />
and mortality (or mortality rate quantified by the number of <strong>de</strong>aths per 1000 inhabitants).<br />
The present analysis follows the structural dynamic of population during the interval<br />
1990 - 2009, using statistical data provi<strong>de</strong>d by NIS, DSJ Sălaj, the communes’ fiche and the<br />
local mayor’s offices.<br />
Natality at the level of the analysed territory presents relatively low values, a situation<br />
which characterises the entire country, having oscillations in time from 11.18‰ in 1990 to<br />
9.25‰ in 2005, and at the level of the year 2009 the number of births increased to 267 people,<br />
and the value of natality became 10.26‰.<br />
In the territory, the birth rate is different from one commune to another, the highest<br />
values being in Ileanda (17.3‰), Gârbou, Poiana Blenchii and Rus, and the lowest values are<br />
characteristic to the communes Băbeni, CristolŃ and Şimişna. We also notice that for<br />
approximately 57% of the administrative units, the number of births <strong>de</strong>creased, if we compare<br />
them between 2005 and 2009 (figure 3).
The Villages from Sălaj in the Eastern Part of Jibou Locality… 269<br />
Figure 2. The distribution of population <strong>de</strong>nsity
270<br />
Oana - Andreia PUIA<br />
Figure 3. Population natality between 1990 and 2010<br />
Instead, mortality registers high values of <strong>de</strong>aths, enframing, in its turn, in the national<br />
evolution trend. If natality <strong>de</strong>creased until 2005, and in 2009 it rectified, mortality had an inversed
The Villages from Sălaj in the Eastern Part of Jibou Locality… 271<br />
evolution, increasing its value from 18.7‰ (1990) to 21.9‰ (2005), and in the year 2009 mortality<br />
rate reduced almost insignificantly, with only 0.4‰, due to the diminishing of the number of<br />
<strong>de</strong>aths, to 559 people, in comparison with the year 2005 (figure 4).<br />
Figure 4. Population mortality between 1990 and 2010
272<br />
Oana - Andreia PUIA<br />
In territorial profile, mortality shows values significantly differentiated at the administrative unit<br />
level, starting from 36.6‰ in Zalha and 31.6‰ in Gârbou and up to 11.9‰ in Şimişna and 15.1‰ in<br />
Benesat, approximately 43% of the communes being situated in the value interval 10 - 20‰.<br />
National augmentation, the expression of the difference between natality and mortality, has<br />
negative values, both at the level of the entire territory and at national level, oscillating betwwen -<br />
1.6‰ (Poiana Blenchii) and -26.9‰ (Zalha). This situation has an important weight upon the<br />
numerical dynamic of the population, substantially contributing to the <strong>de</strong>scendant ten<strong>de</strong>ncy of the<br />
inhabitants of the analysed territory, thus <strong>de</strong>termining population losses and endangering rural<br />
<strong>de</strong>velopment by the reducing of the human resource.<br />
As regards the population territorial movement, this indicator offers us the image of the<br />
inputs and outputs of a space <strong>de</strong>mography, comparing cumulated value of the establishment and<br />
immigrations in the territory with the leaving and emmigrations from the territory. In general, the<br />
balance of the population territorial movement is negative, except the years 2000 and 2005, due to<br />
the people who established their domicile in the analysed area (in the year 2000 there were<br />
recor<strong>de</strong>d 424 persons). At the level of the year 2009, in most communes (64%) there were<br />
recor<strong>de</strong>d population losses, due to the leaving from the locality, the most important loss was<br />
supported by the commune Poiana Blenchii (-10.5‰). At the opposite pole there is the commune<br />
Ileanda, which benefited of the input of 64 arrived persons, which contoured a proportion arrived /<br />
<strong>de</strong>partured of 12.2‰ (table 2).<br />
Table 2. The rate of the establishment and leaving of inhabitants (‰)<br />
(Data source: INS, DJS, Sălaj)<br />
1990 1995 2000 2005 2010<br />
Locality<br />
Imigration<br />
rate<br />
Emigration<br />
rate<br />
Imigration<br />
rate<br />
Emigration<br />
rate<br />
Imigration<br />
rate<br />
Emigration<br />
rate<br />
Imigration<br />
rate<br />
Emigration<br />
rate<br />
Imigration<br />
rate<br />
Emigration<br />
rate<br />
Băbeni 6,11 46,86 9,32 15,39 14,49 13,97 9,85 11,41 18,87 15,54<br />
Benesat 3,46 22,78 0,00 16,88 21,03 12,01 17,83 8,61 11,95 10,69<br />
CristolŃ 11,65 46,08 7,59 28,05 80,01 11,10 4,62 10,57 5,70 12,12<br />
Gâlgău 14,54 51,42 14,24 16,38 23,79 6,12 8,26 9,76 11,32 21,43<br />
Gârbou 5,09 73,29 19,69 24,70 7,90 13,83 10,78 13,81 14,20 23,36<br />
Ileanda 10,57 36,99 32,53 24,39 19,85 13,23 17,56 10,03 27,11 14,83<br />
Letca 2,46 39,73 16,38 12,78 16,40 10,19 14,22 12,84 8,83 15,70<br />
Lozna 20,05 52,74 34,85 30,70 27,58 9,78 8,27 25,73 23,18 19,32<br />
Năpra<strong>de</strong>a 5,58 33,85 32,78 17,75 16,19 10,46 12,76 8,73 11,53 16,78<br />
Poiana Blenchii 6,44 46,89 9,33 18,66 7,30 16,80 7,77 10,87 17,78 28,29<br />
Rus 0,97 61,11 13,58 17,16 13,78 12,20 20,51 6,83 20,92 12,73<br />
Simişna 0,00 0,00 0,00 0,00 0,00 0,00 0,73 2,20 8,79 14,38<br />
Surduc 12,03 35,85 25,07 23,62 9,78 7,34 15,78 13,19 15,75 19,22<br />
Zalha 1,23 67,94 21,44 29,58 8,43 14,33 6,45 8,30 8,23 10,28<br />
The population structure represents its division into several categories and groups taking<br />
into account a series of <strong>de</strong>mographic characteristics, and the study and control of their evolution<br />
represents the main condition of social <strong>de</strong>velopment, and also of the limitation of the effects of<br />
some possible unbalances which might appear in the given territory (Vert, 2001).<br />
The indicators regarding age and sex are essential <strong>de</strong>mographic traits, the structure on age<br />
and sex groups having a major importance in un<strong>de</strong>rstanding other phenomena (natality, mortality<br />
etc) with a special impact upon economic activities, and the <strong>de</strong>tailed knowledge about these<br />
structures offers us useful information about the ten<strong>de</strong>ncies of population evolution. For the<br />
analysed geographic space, the structure of population per age groups in the year 2010 (figure 5)
The Villages from Sălaj in the Eastern Part of Jibou Locality… 273<br />
was analysed, and from its interpreting it contours the phenomenon of population ageing,<br />
emphasized with the help of the indicator of <strong>de</strong>mographic ageing. The value of this indicator is<br />
given by the direct relationship between old population (60 years old and over) and young<br />
population (0 - 20 years old) and it is 1.68 at the level of the entire analysed territory.<br />
Figure 5. The population structure per age group of the eastern Sălaj communes, 2010<br />
(Data source: INS, DJS, Sălaj)<br />
In the territory, critical situations are met in the communes Băbeni (259 young persons<br />
against 780 persons with age of 60 and over), Şimişna (183 young persons against 509 old<br />
persons) and Letca (324 young persons against 874 old persons). It is worrying the fact that the<br />
indicator of <strong>de</strong>mographic ageing has supraunitary values in all the analysed communes, varying<br />
from 1.06 (Năpra<strong>de</strong>a) to 3.01 (Băbeni), existing 4 administrative units where the percentage of old<br />
population exceeds 40% out of the total of population.<br />
The population structure on sexes (2010) shows a slowly increased percentage of the<br />
female population of 51.7% (figure 6) the eastern - Sălaj analysed space exceeding by this value<br />
the normal unbalance of 1 - 2 percentages in favour of the female population, due to the higher life<br />
expectancy of women. In the territory, the same dominance of the female population can be<br />
noticed, except the commune Zalha where there is a balance between the two indicators, also<br />
mentioning the fact that the commune Băbeni <strong>de</strong>taches as the administrative unit with the lowest<br />
number of male population (45.9%).<br />
Figure 6. The population structure on sexes in the year 2010
274<br />
Oana - Andreia PUIA<br />
In the specialised literature it contours more and more clearly the notion of risk,<br />
<strong>de</strong>fined by several authors as Bogdan and Niculescu (1999), Ianoş (2000), Cocean (2007) etc.,<br />
in whose vision risk represents the possibility of the apparition of a phenomenon or process<br />
with negative consequences. Cocean (2007), quoted by David and collaborators (2010)<br />
un<strong>de</strong>rlined that: if in case of natural risks it can appear as events less predictable, wich<br />
manifest through intempestive leaps from one state to another, in the moment when critical<br />
energetic threshold are excee<strong>de</strong>d, the events in the category of <strong>de</strong>mographic risks, analysed in<br />
the present paper, have got a gradual manifestation. By adding, we also mention the <strong>de</strong>finition<br />
of <strong>de</strong>mographic risk offered by Surd (2001) ... „an extreme social process (phenomenon),<br />
dangerous for the individual and society in its whole, whose consequences are materialized in<br />
social disasters, measured also in the number of victims.” Surd and collaborators (2007)<br />
conclu<strong>de</strong>d that, most of the times, the notion of <strong>de</strong>mographic risk ressembles a manifestation<br />
of negative type which endangers society, and the higher the number of actions, the closer the<br />
producing of turbulences to the release phase is.<br />
In the analysed territory, <strong>de</strong>mographic risks can be due to the cumulated action of the<br />
<strong>de</strong>mographic ageing process (by the modifying of the population structure per ages in favour of<br />
those old people) as a long term ten<strong>de</strong>ncy, with the unbalance of the structure per sexes of the<br />
population and with the <strong>de</strong>scending evolution of natality, to which we can also add the national<br />
socio-economic context of a country in transition, which finds itself within the phase of the<br />
unfolding of the process of joining the EU. On the whole, all the analysed administrative units are<br />
affected by <strong>de</strong>mographic ageing, a process i<strong>de</strong>ntified by the calculation of the ageing coefficient,<br />
and in almost 93% of the communes the female population dominates numerically the male<br />
population (table 3, figure 7, figure 8).<br />
Table 3. Demographic coefficients (2010)<br />
(Data source: calculated by INS, DJS Sălaj)<br />
Administrative units<br />
Ageing coefficient<br />
Feminization coefficient<br />
number of women per 100 men<br />
Băbeni 4.06 117.7<br />
Benesat 2.09 106.9<br />
CristolŃ 2.69 100.7<br />
Gâlgău 2.13 106.5<br />
Gârbou 1.73 101.7<br />
Ileanda 1.58 114.0<br />
Letca 3.34 117.3<br />
Lozna 2.95 113.3<br />
Năpra<strong>de</strong>a 1.40 105.8<br />
Poiana Blenchii 2.24 102.1<br />
Rus 1.95 106.5<br />
Simişna 3.69 109.8<br />
Surduc 2.07 104.6<br />
Zalha 2.76 100.0<br />
By corroborating the two coefficients, the conclusion is that the analysed space<br />
comes un<strong>de</strong>r the median class of <strong>de</strong>mographic risk, but <strong>de</strong>taching the communes Băbeni and<br />
Letca which belong to the fifth category of <strong>de</strong>mographic risk (maximum), where the<br />
settlements’ viability is endangered.<br />
It is mentioned that the <strong>de</strong>scending ten<strong>de</strong>ncy of <strong>de</strong>mographic factor in most of the localities<br />
from the Eastern part of Sălaj may <strong>de</strong>termine in the future the insufficiency of the necessary of<br />
human resources for covering the jobs. At present, the analysed space confronts problems like this,<br />
therefore the authorities from Sălaj should draw up viable economic strategies to create jobs and<br />
their occupying by local active work power.
The Villages from Sălaj in the Eastern Part of Jibou Locality… 275<br />
Figure 7. The <strong>de</strong>mographic ageing coefficient<br />
(2010)<br />
Figure 8. Feminization coefficient (2010)<br />
ACKNOWLEDGMENT<br />
This work was supported by the project POSDRU/88/1.5/S/61150 „Doctoral Studies in the<br />
field of life and earth sciences", a project co-financed through Sectorial Operational Program for<br />
the Development of Human Resources, 2007-2013, from European Social Fund.<br />
REFERENCES<br />
Bogdan O., Niculescu E. (1999), Riscurile climatice din România, Aca<strong>de</strong>mia Română, Institutul Geografic, Compania<br />
Sega - International;<br />
Cocean P., Vartanoff Adriana and collaborators (2007), Synthetic Approach of the Romanian Tisa Basin, III, 1, Editura<br />
Presa Universitară Clujeană, Cluj-Napoca;<br />
David Nicoleta, Filip S., Bilaşco Şt., Gligor V. (2010), The <strong>de</strong>mographic potential of Tăşnad micro-region, Geographia<br />
Napocensis, anul IV, nr. 2;<br />
Ianoş I. (2000), Territorial systems – a geographic approach, Editura Tehnică, Bucureşti;<br />
Sorocovschi V., Horvat C., Bilasco St., Schreiber W. (2009) I<strong>de</strong>ntificarea așezărilor rurale din Podişul Someşan în<br />
ve<strong>de</strong>rea evaluării vulnerabilităŃilor, Geographia Napocensis, anul III, nr. 2;<br />
Surd V. (2001), Geo-<strong>de</strong>mography, Editura Presa Universitară Clujeană, Cluj-Napoca;<br />
Surd V., Puiu V., Zotic V., Moldovan C. (2007), Demographic risk in the Apuseni Mountains, Editura Presa Universitară<br />
Clujeană, Cluj-Napoca;<br />
Vert Ctin. (2001), Geografia populaŃiei – teorie şi terminologie, Editura Mirton, Timişoara;<br />
*** Date statistice oferite <strong>de</strong> INS, DSJ Sălaj, fişa comunelor;<br />
*** (2006), Sălaj County Development Plan (SCDP);<br />
*** (2009), Development strategy of the Planning Territorial Unit Some Valley (DSPTUSV).<br />
Submitted: Revised: Accepted and published online<br />
June 07, 2011 September 05, 2011 September 16, 2011
Analele UniversităŃii din Ora<strong>de</strong>a – Seria Geografie Year XXI, no. 2/2011 (December), pp. 276-285<br />
ISSN 1454-2749, E-ISSN 2065-1619 Article no. 212113-551<br />
COMMUNITIES BETWEEN PRESERVATION AND DISAPPEARANCE:<br />
THE DEMOGRAPHIC HAZARD IN BEIUŞ LAND<br />
Claudiu FILIMON ∗<br />
University of Ora<strong>de</strong>a, Department of Geograpy, Tourism and Territorial Planning,<br />
1 Universitatii st., 410087, Ora<strong>de</strong>a, Romania, e-mail: filimonpunct@yahoo.fr<br />
LuminiŃa FILIMON<br />
University of Ora<strong>de</strong>a, Department of Geograpy, Tourism and Territorial Planning,<br />
1 Universitatii st., 410087, Ora<strong>de</strong>a, Romania, e-mail: palelumi@yahoo.com<br />
Abstract: The <strong>de</strong>mographic hazard issue has been more and more approached in the<br />
geograhpic literature of the last <strong>de</strong>ca<strong>de</strong>s, being relevant for a community viability and<br />
vulnerabilty. The present study is proposing an analysis of the <strong>de</strong>mographic hazard of<br />
Beiuş area which should mainly highlight those vulnerable areas that have a problematic<br />
<strong>de</strong>mographic status. In or<strong>de</strong>r to achieve the proposed goal, we have methodologically<br />
used the already known indicators: the <strong>de</strong>mographic dimension of the settlements, the<br />
feminization coefficient, the <strong>de</strong>mographic ageing coefficient, the economic <strong>de</strong>pen<strong>de</strong>ncy<br />
coefficient etc. As a result of this study, there has been highlighted the existence, as<br />
regards the intensity of the <strong>de</strong>mographic hazard, of several types of settlements:<br />
settlements in a critical situation, on the verge of extinction, settlements of mo<strong>de</strong>rate<br />
<strong>de</strong>mographic hazard and of discreet, sequential <strong>de</strong>mographic hazard. The question that<br />
arises is: the critical <strong>de</strong>mographic status of some settlements in Beiuş area is suggesting<br />
the necessity to intervene in their support (having in mind the „authenticity” <strong>de</strong>rived<br />
from the preservation of the archaic lifestyle as opposed to globalization) or needs to be<br />
regar<strong>de</strong>d as a normal evolution of a system with limited <strong>de</strong>velopment potential.<br />
Key words: <strong>de</strong>mographic hazard, viability, vulnerability, Beiuş land<br />
* * * * * *<br />
INTRODUCTION<br />
A settlement's viability, or, on the contrary, vulnerability is best ren<strong>de</strong>red by the human<br />
component. Within any territorial system, its adaptation to the complex <strong>de</strong>velopment potential of a<br />
territory is represented by the migration of young population and labour force from the problematic<br />
areas towards the more attractive ones. The direct consequences of such a phenomenon are clearly<br />
ren<strong>de</strong>red by the <strong>de</strong>mographic hazard, one of the specific markers of a settlement's viability.<br />
The specialized literature in Romania has pretty recently and consecutively approached the<br />
more complex issue of human hazards, either in papers approaching the hazards of the geographic<br />
systems (Ianoş, 1994), or in specific papers, mostly approaching the social hazard field: Surd et<br />
Ar<strong>de</strong>lean (1993), Guran et Turnok (2001). An integrated approach of the human hazard belongs to<br />
∗ Corresponding Author<br />
http://istgeorelint.uora<strong>de</strong>a.ro/Reviste/Anale/anale.htm
Communities between Preservation and Disappearance: The Demographic Hazard… 277<br />
Bene<strong>de</strong>k (2002). In 2002, Ramona RaŃiu <strong>de</strong>alt with the natural and social-economic potential in or<strong>de</strong>r<br />
to assess the vulnerability of the rural settlements in the Someş river field. More recently (in 2010),<br />
Sorochovschi analyzed the vulnerability of the rural settlements through its <strong>de</strong>fining indicators<br />
(spatial, physical, social-economic and environmental), the <strong>de</strong>mographic vulnerability being one of<br />
those. An overall view of the <strong>de</strong>mographic hazards is given by Rotariu's paper (2004). Surd and al.<br />
(2007) worked out a complex paper approaching the <strong>de</strong>mographic hazard in the Apuseni Mountains.<br />
The <strong>de</strong>mographic hazard issue in Beiuş land is one of the many aspects regarding the<br />
viability or, on the contrary, vulnerability of some settlements in this specific area. One of the<br />
„land-type” regions specific to Romania, Beiuş land, functionally overlaps the area polarized by<br />
its traditional center, Beiuş, being administratively composed of four towns (Beiuş, Ştei, Vaşcău,<br />
Nucet) and 21 communes. Geographically, Beiuş land coinci<strong>de</strong>s with Pocola Depression (the<br />
internal compartment of Beiuş Depression) separated by Holod Depression (the external<br />
compartement of Beiuş Depression) through the Crişul Negru Gorge (Filimon, 2007).<br />
The natural status of semi-closed <strong>de</strong>pression has triggered, over the centuries, its<br />
preservation in a relative isolation which allowed the fractionation between the human component<br />
and its living territory and the individualization of this area with relation to the neighbouring ones.<br />
As a result, it triggered the emergence of the „land” status un<strong>de</strong>r various aspects which can be<br />
capitalized in the territorial planning through a territorial <strong>de</strong>velopment strategy focused on its<br />
establishment as project territory (Filimon et al., 2010).<br />
The <strong>de</strong>mographic components of Beiuş land are as follows: the total amount of population<br />
(2002): 83921 inhabitants; the general population <strong>de</strong>nsity (2002): 42.34 inhab / sqkm; negative<br />
natural increase -7.2‰; negative migratory increase -1.8‰. The settlements in Beiuş area are<br />
129, of which 4 towns and 125 villages grouped in 21 communes.<br />
The most important aspect of originality of these settlements is the high <strong>de</strong>gree of<br />
disintegration into small and very small villages, at a short distance range, morphology being the<br />
one that imposed the structure and texture type of the villages of Beiuş.<br />
The conventional village in Beiuş land has 485 inhabitants, thus being in the category of<br />
small villages. In these relatively small communities appeared the social space of Beiuş land, that<br />
certain „genre <strong>de</strong> vie” in the French literature, as an element of regional individuality. Due to this<br />
dimensional aspect and the social-economic context of the last <strong>de</strong>ca<strong>de</strong>s, some of these settlements<br />
are on the verge of extinction, the main goal of the present study being their i<strong>de</strong>ntification.<br />
OBJECTIVES AND METODOLOGY<br />
The present study has as its objective the highlighting of the <strong>de</strong>gree of vulnerability of Beiuş<br />
communities with relation to the <strong>de</strong>mographic hazard. The outline of some possible ways of settlement<br />
recovery where the <strong>de</strong>mographic hazard is high is also another objective of this particular study.<br />
The metodology used in the working out of this study is the one already established for this<br />
kind of analyses. We started from the <strong>de</strong>finition of the <strong>de</strong>mographic hazard suggested by Surd and<br />
al. (2007), according to which: „...the <strong>de</strong>mographic hazard resi<strong>de</strong>s in the incapacity of some<br />
human collectivities, varying in number, to sufficiently exploit (self-sufficiency) their control and<br />
affiliation area, thus turning into backed and/or <strong>de</strong>pen<strong>de</strong>nt collectivities” (Surd et al., 2007, p. 75).<br />
In or<strong>de</strong>r to achieve the first objective we analyzed the <strong>de</strong>mographic hazard at locality<br />
level. The used indicators to highlight this phenomenon have been: the <strong>de</strong>mographic<br />
dimension of the settlements, the feminization coefficients, the amount of the el<strong>de</strong>rly of the<br />
total population, the amount of the young population, the <strong>de</strong>mographic ageing parameter (old<br />
/ young ratio), the economic <strong>de</strong>pen<strong>de</strong>ncy parameter (inactive/active ratio), each and every one<br />
of them highlighting the favourable and critical situations.<br />
In the case of village geo-<strong>de</strong>mographic dimension we used the already established<br />
figures: un<strong>de</strong>r 500 inhabitants - small villages, 501 - 1500 inhabitants - medium villages and<br />
over 1500 inhabitants - large villages. The data source was the population and habitation<br />
census (2002), at locality level.
278<br />
Claudiu FILIMON, Luminița FILIMON<br />
THE ANALYSIS OF THE DEMOGRAPHIC HAZARD MARKERS IN BEIUŞ LAND<br />
THE DEMOGRAPHIC DIMENSION OF THE SETTLEMENTS<br />
Within an area of 195,3 sqkm and a population of 83,921 inhabitants, Beiuş land comprises<br />
129 localities. The 125 rural localities cumulate 60,712 inhabitants, while the 4 towns have a total of<br />
23,209 inhabitants, representing 27.6% of the total population in Beiuş area. The <strong>de</strong>mographic<br />
dimension of the settlements in Beiuş land, due to the numerical evolution of the population and the<br />
social-political factors, represent a geographical feature of this area. The importance of this marker in<br />
any analysis of the human component is significant, the settlement dimension highlighting, even<br />
though indirectly, both the habitat potential of the area and the quality features of the population. The<br />
particularity of Beiuş land, from this perspective, is the high weight factor of small localities (80),<br />
which is 62% of the total amount of settlements (figure 1). These settlements are mainly subject to<br />
the <strong>de</strong>mographic hazard by the small number of inhabitants which leads to <strong>de</strong>population.<br />
Figure 1. Beiuş Land. Demographic dimension of settlements<br />
(Source: Data from DJS Bihor)<br />
In the second category, the medium settlements, there are 42 (32.5%), mainly located at the<br />
limit between the <strong>de</strong>pression hearth and the mountain frame. The large settlements are 2.3% of the<br />
total, respectively 3: Budureasa, Finiş şi Roşia. In conclusion, although there is a pretty large number<br />
of settlements, <strong>de</strong>pending on the dominant geo-<strong>de</strong>mographic size, their geo-<strong>de</strong>mographic potential is<br />
reduced. The human hazard is triggered by the <strong>de</strong>mographic dimension of the locality itself.
Communities between Preservation and Disappearance: The Demographic Hazard… 279<br />
THE FEMINIZATION COEFFICIENT<br />
The feminization coefficient of the population in Beiuş land is part of the recor<strong>de</strong>d general<br />
trend at national level and clearly indicates situations <strong>de</strong>rived from the local area features.<br />
This coefficient has an average rate of 104.2 women / 100 men, close to the one recor<strong>de</strong>d<br />
at national level (105 women / 100 men). The minimum and maximum rate ranges from 79.5<br />
women / 100 men in Lacu Sărat and 150 women / 100 men in Cucuceni.<br />
Depending on this average rate there were established 4 distinctive classes (figure 2) which<br />
divi<strong>de</strong> the localities into favourable or disadvantageous situations.<br />
Figure 2. Beiuş Land. Feminization coefficient<br />
(Source: Data from DJS Bihor)<br />
Most of the localities belong to the class of 100.1 - 110 women / 100 men (44.1% of<br />
the total number of localities) and over 110 women / 100 men (24%) (figure 2). By these rates<br />
and the rural particularity of the area, one can assess that the largest part of the settlements are<br />
in a disadvantageous situation.<br />
A specific feature is the dominance of the male population in the case of the towns of<br />
Ştei, Nucet şi Vaşcău and of most of the settlements in their vicinity, as a result of the<br />
industrial activity.<br />
In the class of un<strong>de</strong>r 90 women / 100 men and 90.1-100 / 100 men there are 41<br />
settlements. They are mainly located in the <strong>de</strong>pression hearth and less in the vicinity of some<br />
industrialized areas.
280<br />
Claudiu FILIMON, Luminița FILIMON<br />
THE WEIGHT FACTOR OF THE ELDERLY POPULATION OF THE TOTAL AMOUNT<br />
Given by the average rate of this coefficient, 27.3%, Beiuş land is much higher than the<br />
national rate (19.4%), the threshold of <strong>de</strong>mographic ageing (12 - 14%) being excee<strong>de</strong>d by almost<br />
all localities, except for BăiŃa-Plai and Şoimi (6%, respectively 10%). Although both BăiŃa-Plai<br />
and Brusturi are part of the very small localities class, they hold the extreme rates of the<br />
<strong>de</strong>pression when it comes to this coefficient. The former has the lowest number of old persons<br />
(6%) while the latter is entirely populated (100%).<br />
Figure 3. Beiuş Land. The weight factor of the el<strong>de</strong>rly population of the total amount<br />
(Source: DJS Bihor)<br />
The fall of the localities into one of the four established classes has been done according to<br />
the weight factor of the el<strong>de</strong>rly population of the total amount of population. A large number of<br />
localities belongs to the third class, 20.1% - 30% old population, respectively 75 settlements. To this,<br />
there comes yet another large number of settlements (33, including the town of Vaşcău) where the<br />
el<strong>de</strong>rly are 30% (figure 3). Together, the two classes hold over 83% of the total number of<br />
settlements in the <strong>de</strong>pression and certify the high <strong>de</strong>gree of <strong>de</strong>mographic ageing process. In the other<br />
two classes there are 21 settlements, of which only BăiŃa-Plai, Şoimi, Şuncuiuş and the town of Beiuş<br />
are in the first class. The high weight factor of the el<strong>de</strong>rly population is the result of the <strong>de</strong>velopment<br />
in time of these small rural localities with reduced economical potential which did not allow the<br />
preservation or the drawing in of the young population.<br />
THE DEMOGRAPHIC AGEING COEFFICIENT<br />
By its numerical rates, it confirms the <strong>de</strong>mographic ageing process. The average rate of 2<br />
old / 1 young recor<strong>de</strong>d in the area un<strong>de</strong>r analysis exceeds the rate of 0.42 old / 1 young. This rate is
Communities between Preservation and Disappearance: The Demographic Hazard… 281<br />
the result of the numerous old population, doubled by very little young population. The towns of<br />
Beiuş, Ştei, Nucet and 18 villages have a rate of 0.42 old / 1 young. Most of the localities (figure<br />
4), i.e. 93 belong to the class of 1 - 3 old / 1 young. The localites in which the coefficient rate<br />
ranges between 3.1 old / 1 young and 5 old / 1 young arises a serious question regarding their long<br />
and short term viability. The most critical situation is recor<strong>de</strong>d in 7 localities (Bâlc, Brusturi,<br />
Câmp MoŃi, Călugări, Coleşti, Criştioru <strong>de</strong> Sus and Sânicolau <strong>de</strong> Beiuş) with 5 old / 1 young. All<br />
these are small localities, located in a natural framework with limited habitat potential.<br />
Figure 4. Beiuş Land. Demographic ageing coefficient<br />
(Source: Data from DJS Bihor)<br />
THE WEIGHT FACTOR OF THE YOUNG POPULATION OF THE TOTAL POPULATION<br />
The habitat and human potential of the settlements is better highlighted by this coefficient.<br />
The young population of Beiuş land is 15.3% of the total population, a much lower rate, we think,<br />
to the habitat potential of this area. This small rate is explained by the reduced birth rate, as a result<br />
of a change in the i<strong>de</strong>a of family in the rural area, of the migration of the young population and,<br />
consequently, reduced fertility. To these factors, one might add, at least temporarily, the lack of<br />
viable economic solutions which should highlight the resources and the existent potential and<br />
should attract, or at least maintain the young population with biological potential.<br />
Depending on the weight factor of the young population, rates over 25% are to be found<br />
only in 5 settlements (BăiŃa-Plai, MoŃeşti, Cociuba Mică, Şoimi and Câmpani <strong>de</strong> Pomezeu). These<br />
rates are explained by the industrial activity or tourism which attracted the young population<br />
(BăiŃa-Plai, MoŃeşti) or by the numerous gypsy population (Cociuba Mică, Şoimi).<br />
The settlements belonging to the last class (un<strong>de</strong>r 15% young population) are the most<br />
numerous (67) and those which, long and medium term, can raise serious issues in their<br />
preservation as administrative entities (figure 5).
282<br />
Claudiu FILIMON, Luminița FILIMON<br />
Figure 5. Beiuş Land. Weight factor of the young population of the total amount<br />
(Source: Data from DJS Bihor)<br />
The young population, by its rates, absolute or percentage, raises serious questions as<br />
regards the future of this extremely attractive geographic area.<br />
THE ECONOMIC DEPENDENCY COEFFICIENT<br />
This coefficient has been calculated as a ratio between the active and inactive<br />
population. As expected, the situation is not a favourable one to Beiuş land when this<br />
coefficient has an average rate of 2 inactive persons / 1 active.<br />
In addition, we need to mention that part of the active population is almost at the limit of<br />
retiring and there is not much population left to replace it. The most eloquent example is to be<br />
found in Bâlc where the coefficient rate is 0.4 active / 1 active, but there is almost no young<br />
population in this locality of only 17 inhabitants. The high weight factor of the settlements<br />
belonging to the first two classes (figure 6), 80 localities confirms this assertion. These localities<br />
are grouped into two areas: the former comprises the settlements located between Beiuş and the<br />
northern limit of the <strong>de</strong>pression (towards Ora<strong>de</strong>a) while the latter comprises the settlements<br />
located around the industrial units of the European Drinks & Food Group.<br />
The settlements in the last class show the most critical situation, being scattered within the<br />
territory. It is the case of small localities and el<strong>de</strong>rly population.<br />
The ageing process of the active population and the lack of a representative young<br />
population to take charge of the process of manufacturing goods and thus providing income,<br />
raise several questions regarding the economic future of the settlements in Beiuş, especially<br />
those in the last class.
Communities between Preservation and Disappearance: The Demographic Hazard… 283<br />
Figure 6. Beiuş Land. The economic <strong>de</strong>pen<strong>de</strong>ncy coefficient<br />
(Source: Data from DJS Bihor)<br />
THE DEMOGRAPHIC HAZARD<br />
Following the analysis carried out through the afore-mentioned coefficients, we have<br />
worked out a map of the <strong>de</strong>mographic hazard in Beiuş land.<br />
The main <strong>de</strong>mographic hazard is given by the generalization and accentuation of the<br />
<strong>de</strong>mographic ageing process, doubled by feminization. Consi<strong>de</strong>ring the rates recor<strong>de</strong>d<br />
individually for the afore-mentioned coefficients, the settlements of Beiuş land fall into three<br />
categories of <strong>de</strong>mographic hazard: high, medium and small hazard (figure 7).<br />
The most critical situation, on the verge of extinction due to very small <strong>de</strong>mographic<br />
potential, doubled by an increased <strong>de</strong>gree of ageing population, is to be found in 7 localities:<br />
Bâlc, Brusturi, Câmp MoŃi, Criştioru <strong>de</strong> Sus, Hidiş and Sânicolau <strong>de</strong> Beiuş. They all have<br />
gloomy insecure future due to the low habitat potential and <strong>de</strong>population.<br />
In the high hazard category we have 87 settlements, representing 67.4% of the total. In<br />
their case the <strong>de</strong>mographic hazard manifests itself through the <strong>de</strong>mographic ageing<br />
phenomenon and the intensification of the feminization process, but, at least on short term,<br />
there is no risk of <strong>de</strong>population.<br />
The low <strong>de</strong>mographic hazard, manifested discreetly, sequentially, through one of the used<br />
<strong>de</strong>mographic coefficients, is present in 35 settlements, respectively 27.1% of the total. The<br />
<strong>de</strong>mographic ageing is mainly found in Ferice, Căbeşti, Goila, Sohodol, the other coefficients<br />
showing rates that do not raise a problem, on long term.<br />
The increased feminization of the population is present in the towns of Nucet, Ştei, Vaşcău<br />
and villages Budureasa, Săud, due to more intense industrial activity.<br />
The economic <strong>de</strong>pen<strong>de</strong>ncy is higher in Bră<strong>de</strong>t, Lacu Sărat, Şoimi, Stînceşti. Here the<br />
acts of the main actors should focus on solving these vulnerable situations that might trigger<br />
long-term issues.
284<br />
Claudiu FILIMON, Luminița FILIMON<br />
Figure 7. Beiuş Land. Demographic hazard<br />
DEBATES AND CONCLUSIONS<br />
Beiuş land, an old area of living and human continuity, center of concentrated natural and<br />
human energies on the upper stream of Crişul Negru, is presently facing the generalization of the<br />
<strong>de</strong>mographic ageing process. The <strong>de</strong>mographic ageing and the feminization process of the<br />
population area real issues for the settlements in the <strong>de</strong>pression, especially for the small and very<br />
small localities. The disappearance of some settlements is a real threat for 7 localities. The<br />
question that arises is what are the chances to stop this phenomenon, respectively the means to<br />
diminish the <strong>de</strong>mographic hazard, un<strong>de</strong>r the actual social-economic circumstances.<br />
In the case of the almost extinct localities, the population and habitat census, in progress at<br />
the moment of this paper's editing process, could confirm their disappearance. We consi<strong>de</strong>r that<br />
any action taken to rejuvenate these localities is tardy, the chances to succeed are slim consi<strong>de</strong>ring<br />
the old population and the lack of viable economic programs.<br />
In the case of other localities, consi<strong>de</strong>ring the local particularity, the existing tradition, the<br />
presence of already established economical activities, we consi<strong>de</strong>r that a human and economic<br />
policy oriented towards the preservation of the local distinctiveness and its capitalization could<br />
solve the present issues. On medium and long term, consi<strong>de</strong>ring a sustainable <strong>de</strong>velopment, it is<br />
important to work out an integrated local <strong>de</strong>velopment strategy to capitalize the „land type” areas<br />
and the i<strong>de</strong>ntity marks of Beiuş land, up to its establishment as a project territory (Filimon, 2007)<br />
and the setup of the brand of Beiuş land. On short term, the main actions should be oriented<br />
towards the support of the young population, to ensure an accurate social-economic framework, to<br />
encourage the <strong>de</strong>velopment of long term viable economic activities and to capitalize the existing<br />
local resources not only the human ones. The presence of lohn type units (Beiuş and Ştei) is only a<br />
short term solution. A field which has generous resources is the tourism, providing that real, not<br />
speculating investors are drawn up, as well as the encouragement of free initiative of the locals.
Communities between Preservation and Disappearance: The Demographic Hazard… 285<br />
The rejuvenation of some traditional economic activities and even traditional crafts<br />
could contribute to the preservation of the young population.<br />
Nevertheless, the <strong>de</strong>mographic ageing remains an unsolved issue for all the authorized<br />
institutions and a challenge for the future generations of Beiuş land. The local young population<br />
has a fundamental part in solving this issue, a flux of young allochthonous population being able to<br />
dillute or even lose the authenticity of Beiuş land.<br />
ACKNOWLEDGEMENTS<br />
This contribution represents results from the following research project PN II, TE_287, 75/2010.<br />
REFERENCES<br />
Bene<strong>de</strong>k J. (2002), Riscurile umane, în Riscuri şi catastrofe, editor V. Sorochovschi, Editura Casa CărŃii <strong>de</strong> ŞtiinŃă, Cluj-<br />
Napoca;<br />
Filimon LuminiŃa (2007), The Romanian „Lands” as Project Territory: Case Study: Beiuş Land, în RRGP, pp. 23-28;<br />
Filimon Luminita, Ribana Linc, Olau P., Filimon C. (2010), Spatial Planning and Local Development. Beiuş Land<br />
(Romania) as Project Territory, International Journal Of Energy And Environment,<br />
http://www.naun.org/journals/energyenvironment/;<br />
Guran Liliana, Turnock D. (2001), A preliminary assessement of social risk in Romania, Geojournal, nr. 50;<br />
Ianoş I. (1994), Riscul în sistemele geografice, SCC, XLI, Editura Aca<strong>de</strong>miei, Bucureşti;<br />
RaŃiu Ramona (2007), PotenŃialul socio-economic şi natural în aprecierea vulnerabilităŃii aşezărilor rurale din Câmpia<br />
Someşană, în Riscuri şi catastrofe, editor V. Sorochovschi, Editura Casa CărŃii <strong>de</strong> ŞtiinŃă, Cluj-Napoca;<br />
Rotariu T. (2004), Riscuri <strong>de</strong>mografice, în Riscuri şi catastrofe, editor V. Sorochovschi, Editura Casa CărŃii <strong>de</strong> ŞtiinŃă,<br />
Cluj-Napoca;<br />
Surd V., Ar<strong>de</strong>lean V. (1993), Geocriminalitatea în Muncipiul Cluj-Napoca, Studia UBB, Seria Geographia, pp. 87-92;<br />
Surd V., Puiu V., Zotic V., Modovan C. (2007), Riscul <strong>de</strong>mografic în MunŃii Apuseni, Editura Presa Universitară Clujeană,<br />
Cluj-Napoca.<br />
Submitted: Revised: Accepted and published online<br />
August 21, 2011 Octomber 20, 2011 November 09, 2011
Analele UniversităŃii din Ora<strong>de</strong>a – Seria Geografie Year XXI, no. 2/2011 (December), pp. 286-293<br />
ISSN 1454-2749, E-ISSN 2065-1619 Article no. 212114-556<br />
DEMOGRAPHIC AND ECONOMIC VULNERABILITIES WITHIN THE<br />
SUBURBAN AREA OF TÂRGU JIU<br />
Daniela ZAMFIR ∗<br />
University of Bucharets, Faculty of Geography, Interdisciplinary Center for Advanced Researches on Territorial Dynamics,<br />
CICADIT, Bucharest, Romania, e-mail: irdanniela@yahoo.com<br />
Cristian BRAGHINĂ<br />
University of Bucharets, Faculty of Geography, Interdisciplinary Center for Advanced Researches on Territorial Dynamics,<br />
CICADIT, Bucharest, Romania, e-mail: cristianbraghina@yahoo.com<br />
Cristian TĂLÂNGĂ<br />
University of Bucharets, Faculty of Geography, Interdisciplinary Center for Advanced Researches on Territorial Dynamics,<br />
CICADIT, Bucharest, Romania, e-mail: cristian2851@yahoo.com<br />
Abstract: The purpose of this article is to <strong>de</strong>termine the <strong>de</strong>mographic and economic vulnerabilities<br />
in the suburban area of a medium-size town, consi<strong>de</strong>ring the level of sensitivity of these areas and<br />
their interface characteristic between urban and rural places. A series of indicators were consi<strong>de</strong>red<br />
and correlated, and the conclusion is that these indicators resulted in i<strong>de</strong>ntifying the most vulnerable<br />
regions from economic, but especially <strong>de</strong>mographic, point of view. After consi<strong>de</strong>ring this analysis,<br />
two major vulnerable regions were i<strong>de</strong>ntified, which means they need urgent measures of recovery<br />
from both economic and <strong>de</strong>mographic points of view.<br />
Key-words: vulnerability, risk, population, economy, suburban area<br />
* * * * * *<br />
INTRODUCTION<br />
The concept of „vulnerability” is used more and more often in the professional literature (both<br />
sociology and economics or geography). According to the explanatory dictionary of Romanian<br />
language, „vulnerable” means „which can be easily affected or un<strong>de</strong>r attack, which has weak points”.<br />
For over two <strong>de</strong>ca<strong>de</strong>s, the collocation „vulnerable population” is used on an international<br />
scale more and more often, meaning that population which had been hit by <strong>de</strong>luges and cyclones,<br />
by the poverty level or exposure to cacoethes (Bour<strong>de</strong>lais, 2005). The concept of „vulnerability”<br />
refers to the long-term poverty and social exclusion. This vulnerability implies two components<br />
(Chambers, 1989): first the risk, the possibility of an event with adverse effect to happen and<br />
secondly the ability to respond to this event, <strong>de</strong>pending on the level of the resources (psychic,<br />
economic, social and political ones).<br />
We <strong>de</strong>ci<strong>de</strong>d to analyze the former component - the risk - which in <strong>de</strong>mography means all of<br />
what can cause a <strong>de</strong>gradation of the structures or result in adverse effects on the <strong>de</strong>mographic dynamics.<br />
Demographic risk starts mostly as a result of economic vulnerabilities. The economic vulnerability was<br />
∗ Corresponding Author<br />
http://istgeorelint.uora<strong>de</strong>a.ro/Reviste/Anale/anale.htm
Demographic and Economic Vulnerabilities Within the Suburban Area of Târgu Jiu 287<br />
approached about a macro-level (country level), consi<strong>de</strong>ring only the level of <strong>de</strong>velopment of that<br />
country reflected on PIB/habitant or more recently about the worldwi<strong>de</strong> economic crisis.<br />
From geographical point of view, the most important issues are: the increasing effect of the<br />
risk, the ability to generate structures that can lead to the reconfiguration of territorial relationships<br />
on various levels of analysis (local, regional, national and even global). Geography has the<br />
advantage of being looked at beyond the barrenness of statistical data, being tied down to the<br />
realities in the field (Muntele, 2010).<br />
As concerns the geographical analysis, practically we will focus on the territorial inferences<br />
of the geo-<strong>de</strong>mographic and economic vulnerabilities (or better said the risks) on the suburban area<br />
of a medium-size town in Romania.<br />
From <strong>de</strong>mographic point of view, there are three major processes that result in a burst of<br />
unexpected events: the age of population, an old population and the <strong>de</strong>cline of population in a<br />
specific region. The aggregation of these three processes leads to an indicator of the <strong>de</strong>mographic<br />
vulnerability (according to the European Commission, Territorial Agenda of the European Union<br />
2020, 2011). Demographic changes have a lot of economic, social and environmental implications.<br />
The aging process of the population may have an impact on the macro-economic variables, such<br />
as: productive capacity, investments and consumption.<br />
According to European documentation, the changes in population size may have a major impact<br />
on regional <strong>de</strong>velopment, leading to an old labour force. A great majority of these regions that have to<br />
overtake the <strong>de</strong>mographic <strong>de</strong>cline are rural or suburban regions characterized by a low level of income,<br />
a high level of unemployment and a high level of employment in falling economic sectors.<br />
The impact on the regional <strong>de</strong>velopment <strong>de</strong>pends on several factors, such as: the structure of<br />
population, the level of professional qualification, the productive capacity and the level of regeneration<br />
of the labour force. The regions in which the populations have a high level of education are better<br />
prepared for overtaking the effects the <strong>de</strong>mographic changes have on them by a higher level of the<br />
productive capacity of labour force (due to a higher level of flexibility to the labour market).<br />
MATERIALS AND METHODS<br />
The suburban areas are among the most sensitive regions to the economic and <strong>de</strong>mographic<br />
changes. In this case it is about a medium-size town with a suburban area composed of the first<br />
circle of localities. It is un<strong>de</strong>termined; it is neither urban, nor rural, with both rural and urban<br />
features, being related more or less to the urban region it occupies (Stoica et al., 2010).<br />
For i<strong>de</strong>ntifying <strong>de</strong>mographic and economic vulnerabilities, a series of indicators were<br />
consi<strong>de</strong>red and correlated, and the conclusion is that these indicators resulted in i<strong>de</strong>ntifying the<br />
most vulnerable regions from economic, but especially <strong>de</strong>mographic, point of view.<br />
The selected indicators for i<strong>de</strong>ntifying the economic vulnerabilities were represented by the<br />
<strong>de</strong>pressed entrepreneurial activity (characterized by the number of companies, the rate of turnover)<br />
in 2009, the number of employees (2009) and the rate of unemployment (2009).<br />
The indicators which <strong>de</strong>scribe the <strong>de</strong>mographic vulnerabilities may be the natural balance<br />
of the population (the average for the period 2000 - 2009), the balance of migration (the average<br />
for the period 2000 - 2009), the population share of and over 65 years old (2008), <strong>de</strong>mographic<br />
<strong>de</strong>velopment (1912 - 2008) and the children birth rate (the average for the period 2006 - 2009).<br />
Then, there was a process of intercalation of the regions affected both by the economic<br />
vulnerabilities and <strong>de</strong>mographic ones for i<strong>de</strong>ntifying the most sensitive regions of the suburban<br />
area of Târgu Jiu municipality which needs urgent measures of <strong>de</strong>mographic regeneration.<br />
CASE STUDY<br />
The municipality of Târgu Jiu is one of the urban centres with the role of a regional pole of<br />
<strong>de</strong>velopment (Peptenatu et al., 2009), <strong>de</strong>mographic increasing being a mo<strong>de</strong>st one (95,271<br />
inhabitants in 2008). The area which is polarized by a regional urban centre, still characterized by<br />
a migration of the population and of the resources from outskirts to the centre of the town, can
288<br />
Daniela ZAMFIR, Cristian BRAGHINĂ, Cristian TĂLÂNGĂ<br />
<strong>de</strong>velop by maintaining a level of polarization of the regional centre and by implementing an<br />
incentive policy of the urban-rural partnership practices.<br />
The analyzed region is composed of 11 administrative units, from which one is urban. In<br />
conclusion, it is about a fundamental rural region with a population of 44,568 inhabitants<br />
(representing 11.6% of the total number of people in the county).<br />
Economic vulnerabilities<br />
In our opinion, the most important factor in i<strong>de</strong>ntifying the economic level of the area<br />
(lacking particular data on the income/inhabitant level) is entrepreneurial activity. This<br />
entrepreneurial activity was quantified by the interpolation of thematic maps containing the<br />
number of the companies and the turnover for every administrative unit, resulting in three<br />
categories (figure 1). Only two units have a medium level from this point of view (Bumbeşti Jiu şi<br />
Băleşti), the rest of them having a limited level of entrepreneurial un<strong>de</strong>rtaking. From this point of<br />
view, in the north-vest, a region in the suburban area can be distinguished (Arcani, Leleşti,<br />
Stăneşti, Schela), with both a very small number of companies (below 40) and a poor turnover<br />
(below 2 million RON). Besi<strong>de</strong>s, the predominance, for SMEs, of the tertiary sector is not, we<br />
might think, an element of economic <strong>de</strong>velopment, but one of involution (Ianoş et al., 2010),<br />
consi<strong>de</strong>ring that a great number of SMEs are to be found in the subordinate tertiary industry<br />
(especially the tra<strong>de</strong>), whrere the number of work places is limited and the ad<strong>de</strong>d value is much<br />
reduced (Braghina et al., 2010).<br />
Figure 1. The <strong>de</strong>gree of entrepreneurial activity by units<br />
(Source data: the National Tra<strong>de</strong> Register Office; processed data)
Demographic and Economic Vulnerabilities Within the Suburban Area of Târgu Jiu 289<br />
Being strongly related to the <strong>de</strong>velopment level of the entrepreneurial activity, the number<br />
of employees and the rate of unemployment are the other two relevant factors in i<strong>de</strong>ntifying the<br />
economic vulnerabilities. As regards the number of employees (figure 2), the most insignificant<br />
values (below 150/administrative unit) are in the localities situated in the north-west region, these<br />
also having the most significant unemployment rates, of over 20% (figure 3).<br />
Figure 2. Number of employees by unit<br />
(Source data: National Institute for Statistics)<br />
Figure 3. Rate of unemployment by unit<br />
(Source data: National Institute for Statistics)<br />
Analyzing the four elements (the number of the companies, the turnover, the number of<br />
employees and the rate of unemployment), it is discovered a number of five administrative units<br />
characterized by important economic vulnerabilities: Arcani, Leleşti, Stăneşti, Schela (in a<br />
compact region) şi Bălăneşti (situated in the estern part of the suburban area).<br />
Demographic vulnerabilities<br />
The <strong>de</strong>mographic vulnerabilities, which are much stronger, were i<strong>de</strong>ntified by means of<br />
several indicators in terms of long term consequences, and after being analyzed, the conclusion<br />
was that they can <strong>de</strong>scribe the present state of <strong>de</strong>mographic dynamics and structure, and the<br />
evolution of the two concepts (<strong>de</strong>mographic dynamics and structure) if a<strong>de</strong>quate <strong>de</strong>mographic<br />
measures and policies are not applied.<br />
In or<strong>de</strong>r to recognize all the changes which occurred in different stages, the in<strong>de</strong>x of<br />
<strong>de</strong>mographic evolution was calculated based on the following ratio:<br />
Where:<br />
L d = in<strong>de</strong>x of <strong>de</strong>mographic evolution;<br />
,<br />
= sum of the square roots of the increasing values between census;<br />
= sum of the square roots of the <strong>de</strong>creasing values between census;<br />
P = total number of people in the locality X.
290<br />
Daniela ZAMFIR, Cristian BRAGHINĂ, Cristian TĂLÂNGĂ<br />
Figure 4. Type of <strong>de</strong>mographic evolution (according the in<strong>de</strong>x of <strong>de</strong>mographic evolution)<br />
(Source data: National Institute for Statistics, processed data)<br />
Figure 5. Natural balance of population<br />
(Source data: National Institute for Statistics, processed data)
Demographic and Economic Vulnerabilities Within the Suburban Area of Târgu Jiu 291<br />
The values which were obtained are covering an interval from -4.21 (Dăneşti) and 1.12<br />
(Turcineşti). The average for the suburban area <strong>de</strong>scribes an involution slightly <strong>de</strong>scending (-0.14).<br />
For a synthetic analysis of <strong>de</strong>mographic evolution of the administrative territorial units in the peri-urban<br />
area of Târgu Jiu municipality, there were i<strong>de</strong>ntified two major evolutional categories (figure 4):<br />
a) <strong>de</strong>scending evolution, 63% of the area being inclu<strong>de</strong>d. This is specific only to the rural<br />
environment, being grouped in two regions: one in the north-west part and the other in the southeast<br />
part of the suburban area;<br />
b) administrative units with an evolution mo<strong>de</strong>rately ascending (from 0.1 to 1.12) are four<br />
altogether, representing 27% out of the total. They are both in the urban and rural environment.<br />
This pattern of localities in relation to their <strong>de</strong>mographic evolution throughout the XX<br />
century is very useful in the process of <strong>de</strong>scribing the coming evolutional ten<strong>de</strong>ncies and of<br />
<strong>de</strong>termination of the action. Other relevant indicators for population dynamics are the natural<br />
balance of the population and the balance of migration.<br />
The natural balance reflects major problems from <strong>de</strong>mographic point of view, none of the<br />
units of the suburban area registering positive values (figure 5), the values being situated<br />
between 23.4‰ (Arcani) and -0.8‰ (Bumbeşti Jiu) with an average of -9.88‰ for the entire<br />
area. Very important for these values is the infant mortality rate, which is very high (in the<br />
entire area the average is 15.7‰), but also the birth rate which, in some cases is rather low<br />
(5.9‰). The most questionable regions from this point of view are situated in the north-west and<br />
the south-east part of the suburban area.<br />
Figure 6. Share of population over 65 years old<br />
(Source data: National Institute for Statistics, processed data)<br />
The balance of migration of population may reflect also a series of <strong>de</strong>mographic<br />
dysfunctions. In this instance, however, the balance of migration is globally positive (11.1‰),<br />
but with territorial changes. Some of these localities are characterized by a positive balance of<br />
migration due to some types of urban sprawl. There are also negative values (- 6.5‰ - Schela, -<br />
5.4‰ - Bumbeşti Jiu). However the positive balance of migration does not compensate the
292<br />
Daniela ZAMFIR, Cristian BRAGHINĂ, Cristian TĂLÂNGĂ<br />
natural one, thus resulting situations in which the total balance of population stays negative:<br />
Bălăneşti (– 8.4‰), Schela (- 20.5‰), ScoarŃa (- 0.6‰) sau Bumbeşti Jiu (- 20.5‰).<br />
The infant mortality is another problem to be analyzed, being directly related to the<br />
condition of sanitary system and the living standard. The high values in certain localities<br />
(Bălăneşti - 30.3‰, Leleşti - 25.6‰, DrăguŃeşti - 23.8‰, Bumbeşti Jiu - 12.1‰, Băleşti - 11.6‰)<br />
<strong>de</strong>scribe that there are still important problems in the suburban area of Târgu Jiu municipality.<br />
The most important problem is perhaps the one related to the aged population which can be<br />
quantified with the share of population of over 65 years old in the population total. With an<br />
average of 27.1% and one administrative unit with a value below 10% (Bumbeşti Jiu - 9.8%). This<br />
region can be inclu<strong>de</strong>d in the areas with an accentuated <strong>de</strong>mographic level of aging.<br />
From territorial point of view (figure 6), there are two categories of localities with<br />
values measuring over 25% (one in the nort-west part and the other one in the south-east part<br />
of the suburban area). In each region, there are localities with values measuring over 30% of<br />
the aged population (Bălăneşti - 32.3%) and even 45% (Arcani 49.7%), meaning that there are<br />
major problems related to the aged population.<br />
If we analyze the birth-date ration, which has values below 25% in these regions, the<br />
conclusion is in fact that these two regions are characterized by <strong>de</strong>mographic vulnerabilities.<br />
Verifying all these indicators, the conclusion is that there are two different regions<br />
characterized by <strong>de</strong>mographic vulnerabilities: the former is situated in the north-west part (Arcani,<br />
Leleşti, Stăneşti) and the latter in the south-east part (Bălăneşti, ScoarŃa, Dăneşti), both having at<br />
least a locality with major <strong>de</strong>mographic problems: Arcani, and, respectively, Bălăneşti.<br />
Overlaying the two types of vulnerabilities (<strong>de</strong>mographic and economic), the conclusion is<br />
that there are both four administrative units extremely vulnerable (Arcani, Leleşti, Stăneşti) and<br />
two administrative units with a lower <strong>de</strong>gree of vulnerability (Schela and Dăneşti). This<br />
vulnerability is much more accentuated in these regions so as there are also problems referring to<br />
urban public facilities (the lack of the gas grid and of the sewerage and water-supply systems) and<br />
infrastructure, but especially to a rather low level of population education (with a share of less than<br />
2% for those with university education and a share of over 2% for ungraduated people).<br />
CONCLUSIONS<br />
It is obvious that for every family or community these two aspects of the vulnerability -<br />
the level of risk and the feature of responsiveness -, are strongly related to the social and<br />
economic structures. From an individual or small community point of view, the social<br />
discrimination and a not so advantageous economic position, with a limited political<br />
connection, are also motifs for the occurrence of vulnerability, even if the nature of these<br />
vulnerabilities differs <strong>de</strong>pending on the local or national context (Chronic Poverty Research<br />
Centre 2009). Socially, the factors which lead to the feature of vulnerability and which affect<br />
people are represented by a series of social and economic structures. These structures and<br />
relationships are differing anyway. They can change at a community level, due to the<br />
economic variations or the state intervention (Morgan and Yablonski, 2011).<br />
A very evi<strong>de</strong>nt conclusion can be drawn, namely that for the areas situated in the<br />
<strong>de</strong>mographic and economic high-risk regions certain rectifying measures and even a strong<br />
intervention are to come into prominence in or<strong>de</strong>r to stop the negative effect of these<br />
dysfunctions. Unfortunately, as regards the <strong>de</strong>mographic component, the situation can change<br />
only by means of an appropriate <strong>de</strong>mographic policy (at a national level) or by means of a<br />
series of economic measures which should improve the attractiveness <strong>de</strong>gree of the area.<br />
Failing these actions, the social costs will increase exponentially (both of the aging process of<br />
the population and the increasing of the poverty level, which is high enough).<br />
ACKNOWLEDGEMENTS<br />
This work was supported by CNCSIS - UEFISCSU, project number PNII - IDEI co<strong>de</strong> 1948/2008.
Demographic and Economic Vulnerabilities Within the Suburban Area of Târgu Jiu 293<br />
REFERENCES<br />
Bour<strong>de</strong>lais P. (2005), Qu’est-ce que la vulnérabilité?, Annales <strong>de</strong> démographie historique, 2005/2 no 110, 5-9;<br />
Braghina C., Stoica Ilinca Valentina, Zamfir Daniela (2010), The role of SMEs in diminishing territorial disparities. Case<br />
Study: Gorj County, Ovidius University Anals. Economic Series, vol. X, 398-402;<br />
Chambers R. (1989), Vulnerability, Coping and Policy, IDS Bulletin, volume 37, no 4;<br />
Ianos I., Braghina C., Stoica Ilinca Valentina, Zamfir Daniela (2010), The dynamics and structure of SMES in the current<br />
economic context. Case study:Gorj County, Revista Romana <strong>de</strong> Geografie Politica, year XII, no 2, 400-410;<br />
Morgan R., Yablonski J. (2011), Adressing, not just, managing vulnerability: Policies and Practice for Equity and<br />
Transformation, International Conference „Social protection for Social Justice”, Institute of Development<br />
Studies, UK, 13-15 of April 2011;<br />
Muntele I. (2010), Les risque geo-démographique en Roumanie. Réalités et perspectives, Essays of Geography Seminar<br />
„Dimitrie Cantemir”, no 30/2010, pp. 73-85;<br />
Peptenatu D., Pintilii R., Cepoiu Loreta, Drăghici C. (2009), Polycentric Development Strategy – an Efficient Instrument in<br />
Administrative Decentralization, Romanian Review on Political Geography, XI, 2, 99-111;<br />
Stoica Ilinca-Valentina, Tălângă C., Zamfir Daniela (2010), Urban-rural interface: general remarks. Application in the<br />
Romanian system of settlements, Analele UniversităŃii din Ora<strong>de</strong>a, Seria Geografie, tom XX, nr. 2/2010, 238-245;<br />
*** (1999), European Spatial Development Perspective. Towards Balanced and Sustainable Development of the Territory<br />
of the European Union, Office for Official Publications of the European Communities, Luxembourg;<br />
*** (2011), Territorial Agenda of the European Union 2020. Towards an Inclusive, Smart and Sustainable Europe of<br />
Diverse Regions;<br />
*** (2007), Territorial Agenda of the European Union. Towards a more competitive and sustainable Europe of diverse region;<br />
*** Data from National Institute for Statistics<br />
Submitted: Revised: Accepted and published online<br />
September 06, 2011 November 06, 2011 December 13, 2011
Analele UniversităŃii din Ora<strong>de</strong>a – Seria Geografie Year XXI, no. 2/2011 (December), pp. 294-302<br />
ISSN 1454-2749, E-ISSN 2065-1619 Article no. 212115-531<br />
THE EFFECTS OF POPULATION AGING ON RURAL AREAS. CASE<br />
STUDY: THE SĂRĂłEL HYDROGRAPHIC BASIN (BUZĂU<br />
SUBCARPATHIANS)<br />
Ilinca - Valentina STOICA ∗<br />
University of Bucharets, Faculty of Geography, Interdisciplinary Center for Advanced Researches on Territorial Dynamics,<br />
CICADIT, Bucharest, Romania, e-mail: stoicailincavalentina@gmail.com<br />
Abstract: The article is part of a wi<strong>de</strong>r scope of inquiries on population aging, carried out at<br />
European and global scale, concerning the impact of that process on society’s functional<br />
organization. Starting from these general consi<strong>de</strong>rations, this study sets out to highlight the<br />
features of population aging in the SărăŃel hydrographic basin, the causes that brought about<br />
this process, and the manner its effects are illustrated in the rural area. In or<strong>de</strong>r to quantify this<br />
process and achieve an analysis capturing its evolution, the weight of the el<strong>de</strong>rly population<br />
out of the total population and the population aging in<strong>de</strong>x were calculated.<br />
Key-words: <strong>de</strong>mographic ageing, rural, SărăŃel hydrographic basin, effects<br />
* * * * * *<br />
INTRODUCTION<br />
Demographic aging is a highly topical issue in Europe and worldwi<strong>de</strong> nowadays, in the<br />
context of concerns related to the impact of the rise in the ratio of the el<strong>de</strong>rly population on<br />
society’s functional organization. These are mainly groun<strong>de</strong>d in the <strong>de</strong>mographic forecasts, data<br />
indicating that by 2050 the global ratio of children vs. the el<strong>de</strong>rly will be 1:2; the same ratio in<br />
China will be 0:7, and in Europe 0:5, where there will be twice the number of el<strong>de</strong>rly people than<br />
children (Lunenfeld, 2002).<br />
As a result of these forecasts, several studies have been carried out at European Union<br />
level, as part of several programs such as: „The Ageing Population and Disabilities” (Programme<br />
Acronym: LIFE QUALITY), „Ageing, Health and Retirement in Europe” (AGIR), „Future<br />
El<strong>de</strong>rly Living Conditions in Europe: Who Will Care” (FELICE), SHARE „Survey of Health,<br />
Ageing and Retirement in Europe”, and „Extending quality of life in old age - the state of the art<br />
(EQUAL)” among others ( Lasch et al., 2006).<br />
In addition, numerous studies were carried out on the impact of <strong>de</strong>mographic aging on<br />
sections of social policy in various countries: France (Bour<strong>de</strong>lais, 1999), Holland<br />
(Balkenen<strong>de</strong>, 2008), Moldova (Paladi, 2008), England and Wales (Grundy and Emily, 1991),<br />
Australia (Rowland, 2008), Canada (Fougère et al., 2009), Scotland (Loretto et al., 2006),<br />
Japan (Faruqee and Muhleisen, 2003), among others.<br />
Population aging is foremost a <strong>de</strong>mographic phenomenon, although its consequences<br />
expand much beyond the limits of <strong>de</strong>mography. Demographic aging has become a topic in<br />
∗ Corresponding Author<br />
http://istgeorelint.uora<strong>de</strong>a.ro/Reviste/Anale/anale.htm
The Effects of Population Aging on Rural Areas. Case Study: The Sărățel… 295<br />
social, economic, healthcare and even cultural <strong>de</strong>bate because of the scale of its effects and its<br />
persistence (Lutz et al., 2009).<br />
In the long run, five fields of public policies have to get prepared in or<strong>de</strong>r to cope with this<br />
process: the pension system, healthcare and long-term care policy, workforce occupation,<br />
migration and integration policy, infrastructure <strong>de</strong>velopment (Zaidi, 2008). In this respect, certain<br />
authors i<strong>de</strong>ntify migration as the factor that might help balance the public pension system (Razin<br />
and Sadka, 1999; Leers et al., 2004). Others i<strong>de</strong>ntify, in addition to the rise in the number of<br />
migrants, encouraging a rise in fertility (Bongaarts, 2004). One other view holds that i<strong>de</strong>ntifying<br />
means to keep the el<strong>de</strong>rly population active for as long as possible would also be <strong>de</strong>sirable, as<br />
there are worries that jobs will outnumber the workforce (Balkenen<strong>de</strong>, 2008).<br />
Starting from these general premises, the study means to highlight the features of<br />
population aging in the SărăŃel hydrographic basin, the causes that brought about the respective<br />
process, and its effects on the rural area analyzed.<br />
METHODOLOGY<br />
Population aging means „the process of change in the population’s age group structure, in<br />
the sense of an increase in the el<strong>de</strong>rly group’s ratio to the <strong>de</strong>triment of the young group, as a<br />
visible and long-term trend” (Mihăescu, 2001).<br />
Population aging is caused by a set of general factors, with particular causes - specific to<br />
certain subregions - also possibly present. The increase in life expectancy at birth and the<br />
concomitant <strong>de</strong>crease in fertility rates are the main factors responsible for an ageing population<br />
(Lunenfeld, 2002) (figure 1).<br />
Figure 1. Elements that contribute to population aging<br />
Source: Lunenfeld, 2002<br />
At the same time, in addition to these general conditions, emigration plays a very important<br />
part, or it can actually be the main factor, in certain areas.<br />
The process of <strong>de</strong>mographic aging can be highlighted by means of quantitative analyses,<br />
such as the el<strong>de</strong>rly population ratio of the overall population and the <strong>de</strong>mographic aging in<strong>de</strong>x.<br />
The use of these indicators is necessary in or<strong>de</strong>r to capture this process in the utmost <strong>de</strong>tail, but<br />
also to capture the causes that brought about a certain type of evolution. At the same time, the<br />
effects at a later time on the spatial organization of the area can be monitored.<br />
In the area analyzed, the available data were used to calculate the ratio of the el<strong>de</strong>rly<br />
population out of the total population, a method that has the benefit of analyzing a longer time span,<br />
1930 through to the present. The second indicator analyzed covered the 1966 - 2007 time span, with<br />
the previous period only covered by remarks, as official data do not allow its quantification.<br />
The study was carried out at village level, using the information offered by censuses, up to<br />
2002; in or<strong>de</strong>r to highlight the latest trends an analysis of the evolution of the two indicators at<br />
commune level was carried out, with 2007 the latest year of reference.
296<br />
Ilinca-Valentina STOICA<br />
CASE STUDY: THE SĂRĂłEL HYDROGRAPHIC BASIN<br />
The SărăŃel hydrographic basin is located in South-Eastern Romania, in the Central-<br />
Northern part of Buzău County. It comprises all of 26 rural settlements, grouped in the communes<br />
of ScorŃoasa, Căneşti and Chiliile, and another 2 villages - Joseni and Scoroşeşti, part of the<br />
communes of Berca and Odăile, respectively. Population is around 5,800.<br />
Currently, in terms of population size, most villages have less than 500 resi<strong>de</strong>nts, with only<br />
three of them topping that number - Joseni, Policiori and ScorŃoasa, villages located in the central<br />
and southern part of the area, in a more accessible region, which allows for relatively rapid<br />
connections to Berca or the city of Buzău, which means the working population prefers<br />
commuting over emigration.<br />
The basic economic activity is agriculture, subsistence farming on small-sized tracts of land,<br />
usually by means of traditional tools; there are farmers’ associations, but only for those tracts of land<br />
in the plains region. Industrial activity consists in several workpoints, with several oil wells standing<br />
out in the landscape, and small-scale handcraftsmanship industry operations. As far as the tertiary<br />
sector is concerned, one can notice assets mainly <strong>de</strong>aling in tra<strong>de</strong> are predominant, and in the past<br />
few years there have also been several „feeble” initiatives to stimulate tourism (Stoica, 2009).<br />
The settlements in the SărăŃel basin have been suffering from <strong>de</strong>mographic aging; in or<strong>de</strong>r<br />
to highlight the scale of that process, an analysis of the evolution of the weight of the el<strong>de</strong>rly<br />
population in the total population was carried out.<br />
One general observation is that the weight of the population aged 65 and ol<strong>de</strong>r has been on<br />
an uptrend since 1930 and through to the present, with a few exceptions listed below.<br />
An analysis of the statistical data indicates that by 1930 the weight of the el<strong>de</strong>rly population<br />
was low, ranging from 2.1% (Grabicina <strong>de</strong> Jos and Dâlma) to 7% (Păcurile). The majority of the<br />
settlements (62.5%) featured rates below 5%, which indicated a predominance of the young and<br />
adult population.<br />
One could notice that by 1966 the sole village where the ratio of the population aged 65 and<br />
ol<strong>de</strong>r had dropped was Poiana-Pletari; by 1930 this village had one of the highest values (6.9%),<br />
but by 1966 it had dropped to 4.35%. Overall, if one rules out this exception, one can notice that<br />
the minimal value registered by 1966 (7.7% in Negoşina) is higher than the maximal value of the<br />
previous year of reference. Half of all villages registered values lower than 10%, with the highest<br />
values found in Trestioara (14.2%) and Gura Văii (15.2%). The general causes for this rise in the<br />
el<strong>de</strong>rly population’s ratio are the negative <strong>de</strong>mographic effects of World War 2 (the rise in<br />
mortality, the drop in birth rate and fertility), but also emigration to the plains region, where<br />
veterans of the two World Wars had been granted land.<br />
In the context of heavy migration, the ratio of the el<strong>de</strong>rly population continued to rise, so<br />
that by 1977 there were values higher than 20% (Chiliile, Glodu-Petcari, GonŃeşti, Valea Verzei).<br />
The lowest values were to be found in Căneşti (11.3%) and Balta Tocila (11.7%).<br />
In 1992, for the first time, the landmark rate of 30%, typical for a population suffering from<br />
<strong>de</strong>mographic aging, is topped in 27% of the villages.<br />
Lower values are found in the communities in the south of the basin (Joseni - 17.1% and<br />
Policiori - 17.3%), which merely registered slight increases as compared to the previous time<br />
interval (0.7% and 0.8% respectively); the highest values are found in the villages of Glodu-<br />
Petcari (33.5%) and GonŃeşti (46.7%) (figure 2).<br />
The causes for the steep post - 1966 rise in the el<strong>de</strong>rly population ratio were groun<strong>de</strong>d<br />
in the high levels of emigration, with groups of migrants bound for outsi<strong>de</strong> the area analyzed,<br />
especially for Buzău, Râmnicu Sărat and the commune of Berca. To a lesser extent, they also<br />
left for Bucharest, Ploieşti, Braşov or other cities at a greater distance (Stoica, 2008).<br />
The immediate <strong>de</strong>mographic effect of the <strong>de</strong>parting population consisted in a negative<br />
natural growth rate and a <strong>de</strong>crease in fertility among others. In the long run, in the context where<br />
migration growth rate remained a negative one, the effects gained in scale, and the balance previously<br />
ensured by positive natural growth in rural areas was profoundly altered, so that nowadays the effects of
The Effects of Population Aging on Rural Areas. Case Study: The Sărățel… 297<br />
the socialist policy of over-emphasizing the importance of cities, and supplying them with workforce<br />
and raw materials from the rural regions, are full-blown.<br />
Figure 2. The evolution of the el<strong>de</strong>rly population ratio in the villages in the SărăŃel basin<br />
In this context, by 2002 el<strong>de</strong>rly population ratios remained high, but the overall increase is<br />
no longer as steep as that of the 1977 - 1992 interval; there were even instances where the ratio<br />
dropped - in Deleni (more than 10%), Gura-Văii and GonŃeşti. Those were not signals of a<br />
<strong>de</strong>mographic rebound, but they could rather be explained by a higher mortality rate. The majority
298<br />
Ilinca-Valentina STOICA<br />
of the settlements (57.7%) featured 31% and higher ratios, the highest being in isolated villages<br />
such as Bu<strong>de</strong>şti (46.7%) or Poiana-Pletari (49.2%). During this time interval, the villages in the<br />
southern part (Joseni and Policiori) continued to feature the lowest ratios (below 20%).<br />
At commune level, one can notice a similar evolution, characterized by an increase in the<br />
el<strong>de</strong>rly population ratio; the ratio rose to higher rates post-1992, more than 23.8%, in all three<br />
communes (figure 3).<br />
Figure 3. El<strong>de</strong>rly population ratio (1930 - 2007)<br />
The population aging in<strong>de</strong>x (PAI) is calculated by matching the population aged 65 and<br />
ol<strong>de</strong>r against that aged 14 and younger; in the area un<strong>de</strong>r analysis, it was calculated at village scale<br />
for the 1966 - 2002 time span, and at commune scale for the 1966 - 2007 time span.<br />
During the time span analyze, communities in the region were characterized by an overall<br />
upward trend, whose values rose steadily, the main causes being the population’s emigration (with<br />
all of its direct and indirect effects), the rise in the population’s levels of education, and the drop in<br />
birth rates, among others.<br />
Depending on the values of that in<strong>de</strong>x, several types of evolution can be i<strong>de</strong>ntified:<br />
- in half of the villages, the values reached their peaks in 1992, in then registered slight<br />
drops (Policiori) or even steep drops (GonŃeşti, where PAI dropped from 2,100% to 566.7%, in the<br />
context of a high mortality rate);<br />
- settlements where the in<strong>de</strong>x values rose throughout the time interval analyzed, especially<br />
as a result of emigration during the communist era (Negoşina, Şuchea, Chiliile, and others);<br />
- in Căneşti values were on a downtrend until 1977, with a steady rise thereafter, as a result of<br />
the increase in emigration in that interval, an increase in the ratio of people migrating from the adult<br />
age group into the el<strong>de</strong>rly age group, a drop in birth rates and an increase in mortality;<br />
- in Grabicina <strong>de</strong> Sus, a drop could be noticed by 1977, followed by a rise up to 1992, with<br />
then values reaching 0, because by 2002 the population of the village was own to 3 - adult and<br />
el<strong>de</strong>rly people - which prevented the calculation of the in<strong>de</strong>x (table 1).<br />
Table 1. Population aging in<strong>de</strong>x (1966, 1977, 1992, 2002) (%)<br />
Data source: Censuses from 1966, 1977, 1992, 2002; processed data;<br />
Settlements 1966 1977 1992 2002<br />
Căneşti 39,1 37,6 181,8 197,1<br />
GonŃeşti 60,0 93,3 2100,0 566,7<br />
Negoşina 26,6 50,4 170,5 194,7<br />
Păcurile 27,9 51,4 88,5 226,7<br />
Şuchea 35,7 49,1 162,2 244,4<br />
Valea Verzei 43,5 82,0 172,0 125,7<br />
Chiliile 32,6 105,7 259,1 275,0<br />
Bu<strong>de</strong>şti 34,7 45,2 135,7 700,0
The Effects of Population Aging on Rural Areas. Case Study: The Sărățel… 299<br />
Creveleşti 40,3 73,1 177,8 400,0<br />
Ghiocari 40,0 51,6 340,0 311,1<br />
Glodu - Petcari 59,0 88,3 440,0 800,0<br />
Poiana Pletari 12,7 95,0 550,0 1133,3<br />
Trestioara 61,8 78,2 233,3 280,0<br />
ScorŃoasa 49,5 90,1 181,4 160,8<br />
Balta Tocila 35,0 45,9 215,2 206,3<br />
Beciu 43,8 87,1 265,7 195,5<br />
Deleni 37,9 71,4 200,0 104,0<br />
Dâlma 44,3 93,9 266,7 554,5<br />
Golu Grabicina 27,7 45,7 130,6 167,7<br />
Grabicina <strong>de</strong> Jos 35,8 59,2 200,0 151,7<br />
Grabicina <strong>de</strong> Sus 46,2 46,0 258,3 0<br />
Gura Văii 66,0 81,6 251,6 170,0<br />
Plopeasa 30,2 83,2 263,8 231,4<br />
Policiori 37,9 62,4 79,5 79,4<br />
Joseni 31,4 71,1 100,6 104,4<br />
Scoroşeşti 41,30 47,73 181,43 164,29<br />
Figure 4. Degree of population aging (2002)
300<br />
Ilinca-Valentina STOICA<br />
A net difference can be perceived between 1966 and 2002 values, in the sense that by<br />
1966 there were some villages that had escaped the influence of this process (with values<br />
below 30%, with as low a rate as 12.7% in Poiana Pletari), but values rose steadily after that<br />
year, so that by 2002 one could say <strong>de</strong>mographic aging was in a very advanced phase;<br />
mo<strong>de</strong>rate values (as compared to elsewhere in the area analyzed), below 10% could only be<br />
found in Policiori, Deleni and Joseni. In all other villages, values indicated an advanced and<br />
even very advanced state of population aging.<br />
The most intense manifestations were found in the villages of Bu<strong>de</strong>şti, Glodu-Petcari and<br />
Poiana Pletari (1,133.3%), with the last village also registering the peak value for 2002 (figure 4).<br />
At commune scale, the highest values of the population aging in<strong>de</strong>x remained constant<br />
throughout the entire time interval analyzed; in the commune of Chiliile (the most isolated of<br />
communes), some of the villages suffered from <strong>de</strong>population and a birth rate that came close<br />
to 0 in the past few years (figure 5).<br />
Figure 5. Population aging in<strong>de</strong>x (1966-2007)<br />
RESULTS AND DISCUSSIONS<br />
Once begun, population aging has a series of effects on the population and communities,<br />
which are visible in the functional organization of the space. In the rural areas insi<strong>de</strong> the SărăŃel<br />
basin this can be grouped into:<br />
a) effects on the population structure, in the sense of the population growing prone to high<br />
mortality and the persistence of low birth and fertility rates, which favors in the long run, the<br />
persistence and intensification of population aging.<br />
Nowadays, as this the values of this in<strong>de</strong>x rise, the population of certain villages is almost<br />
exclusively ma<strong>de</strong> up of el<strong>de</strong>rly people (for instance Bu<strong>de</strong>şti), which will bring about, if the current<br />
conditions persist, a severe shrinking of the population in the future, and the very disappearance of<br />
certain settlements. Even in the villages where young people are nowadays present but population<br />
aging <strong>de</strong>gree is high, the youth tend to leave those settlements. One other effect is that of the rise<br />
of the inactive population ratio.<br />
b) shrinking of the surface of the villages; while in the past the younger population, driven<br />
by constraints of space, would build their homes on the outskirts of the village, the reverse<br />
phenomenon occurs nowadays, in the sense that old houses are abandoned and <strong>de</strong>cay after their<br />
owners’ <strong>de</strong>ath, which causes the incorporated area to drop in the long run.<br />
c) modifications in the economic structure of the settlements, by means of an increase in<br />
the ratio of uncultivated tracts of land and a <strong>de</strong>crease in livestock.<br />
Most local resi<strong>de</strong>nts own tracts of farmland in several distinct villages, and the el<strong>de</strong>rly (as<br />
their capacity to work the land drops) work increasingly small surfaces of land, with those located<br />
farther from home the first to be abandoned. Un<strong>de</strong>r these conditions the local work part of the land<br />
they own close to their homes, and lease the rest, or in extreme cases lease all of it and live on their<br />
pensions or aid received from their children.
The Effects of Population Aging on Rural Areas. Case Study: The Sărățel… 301<br />
Simultaneously, there is a gradual drop in livestock, as el<strong>de</strong>rly people tend to cut down on<br />
the heads of cattle they own, as they get ol<strong>de</strong>r.<br />
At the same time, a population in an advanced state of population aging and with an<br />
obvious trend towards an intensification of that process is much less or not at all attractive for<br />
potential investors, who need young or adult workforce, as well as a guarantee for a future renewal<br />
of the active population, in or<strong>de</strong>r to set up their production facilities in the respective area.<br />
d) pressure on public social policies, by means of high costs related to public system<br />
pensions, as well as those related to healthcare and social assistance services.<br />
e) most of the time, a population suffering from population aging will also have a<br />
conservative mindset, and will be reluctant to novelties, which means it finds it very difficult to<br />
accept innovations, even if they would ease farming tasks. At the same time, accustomed to their<br />
traditionalist way of life, the population is unaware of the potential at hand and distrusts changes<br />
that might improve their living standards. This resistance to innovation <strong>de</strong>pends to a large <strong>de</strong>gree<br />
to the one’s education, as fieldwork analyses indicated a clear difference between the higher-and<br />
secondary-education population and those with primary education only.<br />
CONCLUSIONS<br />
The process of population aging influences all other sections of society, ranging from<br />
organization of the communities and through to the mindset of the local communities’ representatives.<br />
Insi<strong>de</strong> the SărăŃel hydrographic basin, the normal course of evolution of the villages was<br />
profoundly and irreversibly altered by intense migration to outsi<strong>de</strong> the area analyzed. If an analysis<br />
of the el<strong>de</strong>rly population’s weight of the total by 1930 indicated a young population, the situation<br />
nowadays has un<strong>de</strong>rgone a complete reversal. The villages where the current situation is most<br />
dramatic are those located in the northern part (Bu<strong>de</strong>şti, Poiana Pletari, Creveleşti), or along the<br />
isolated high-altitu<strong>de</strong> reaches insi<strong>de</strong> the basin (Păcurile). At the same time, an analysis of the<br />
population aging in<strong>de</strong>x indicates an upward general trend, whose values steadily rose throughout<br />
the time span analyzed.<br />
To conclu<strong>de</strong>, the process of <strong>de</strong>mographic aging, acting in concert with other factors (limited<br />
accessibility, isolation, low income levels, and others) have had – and continue to have – multiple<br />
effects in the area analyzed, most of the times contributing to the <strong>de</strong>terioration of the rural area.<br />
ACKNOWLEDGEMENTS<br />
This work was supported by the strategic grant POSDRU/89/1.5/S/58852, ’Project<br />
Postdoctoral programme for training scientific researchers’ co-financed by the European Social<br />
Found within the Sectoral Operational Programme Human Resources’ Development 2007-2013<br />
and by CNCSIS –UEFISCSU, project number PNII – TD co<strong>de</strong> 397/2007.<br />
REFERENCES<br />
Balkenen<strong>de</strong> J. P. (2008), Demographic change: societal changes in an ageing Europe, European View, Vol. 7,<br />
Number 2 / December, 171-177;<br />
Bongaarts J. (2004), Population Aging and the Rising Cost of Public Pensions, Population and Development<br />
Review, Vol. 30, No. 1, 1-23;<br />
Bour<strong>de</strong>lais P. (1999), Demographic aging: a notion to revisit, History of the Family, Vol. 4, No. 1, 31-50;<br />
Faruqee H., Muhleisen M. (2003), Population aging in Japan: <strong>de</strong>mographic shock and fiscal sustainability, Japan and the<br />
World Economy, Vol.15, No. 2, 185-210;<br />
Fougere Maxime, Harvey S., Mercenier J., Mérette M. (2009), Population ageing, time allocation and human capital: a<br />
general equilibrium analysis for Canada, Economic Mo<strong>de</strong>lling 26, 30-39;<br />
Grundy Emily (1991), Ageing: Age-Related Change in Later Life in Population Studies, Vol. 45, Population Research in<br />
Britain: Supplement (1991), 133- 156, published by: Population Investigation Committee Stable URL:<br />
http://www.jstor.org/stable/2175063;<br />
Lasch Vera, Reimann Katja (2006), Ageing and Demographic Change: European Research Resources in Backes G.M.,<br />
Lasch Vera, Reimann Katja, eds. (2006), Gen<strong>de</strong>r, Health and Ageing. European perspectives on life course, health
302<br />
Ilinca-Valentina STOICA<br />
issues and social challenges, Publisher VS Verlag für Sozialwissenschaften;<br />
Leers T., Meijdam L., Verbon A.A. H. (2004), Ageing, migration and endogenous public pensions, Journal of Public<br />
Economics, 88, 131-159;<br />
Loretto Wendy, White P. (2006), Population Ageing and Ol<strong>de</strong>r Workers: Employers Perceptions, Attitu<strong>de</strong>s and Policies,<br />
Population, Space and Place 12, 341-352;<br />
Lunenfeld B.(2002), The ageing male: <strong>de</strong>mographics and challenges, World journal of urology, Vol. 20, No. 1, 11-16;<br />
Lutz W., San<strong>de</strong>rson C. W., Scherbov S. (2009), Global and Regional Population Ageing: How Certain Are We of its<br />
Dimensions?, Journal of population ageing, Vol. 1, No. 1;<br />
Mihăescu ConstanŃa (2001), PopulaŃie & ocupare. Trecut, prezent, viitor, Editura Economică, Bucureşti;<br />
Paladi G. (2008), Consi<strong>de</strong>raŃii privind procesul <strong>de</strong> îmbătrânire <strong>de</strong>mografică în Republica Moldova, Aka<strong>de</strong>mos, No. 3-10, 64-69;<br />
Razin A., Sadka E.(1999), Migration and pension with international capital mobility, Journal of Public Economics, 74, 141- 150;<br />
Rowland D.T. (2008), The Demography of Ageing and Families in Australia, Australian Journal on Ageing, Vol.16, No.3, 99-104;<br />
Stoica Ilinca-Valentina (2009), Organizarea spaŃiului geografic şi <strong>de</strong>zvoltarea rurală în bazinul hidrografic SărăŃel,<br />
PhD thesis, manuscript;<br />
Stoica Ilinca-Valentina (2008), Dinamica mobilităŃii teritoriale în bazinul hidrografic SărăŃel, Terra, anul XXXVI-<br />
XXXVII (LVI-LVII), Editura Cd Press, Bucureşti, 124-131;<br />
Zaidi A., Sidorenko A. (2008), Features and Challenges of Population Ageing using the European Perspective, Chapter<br />
Nine, în R. Schoenmaeckers and L. Van<strong>de</strong>rley<strong>de</strong>n (ed.) Population Ageing. Towards an Improvement of the<br />
Quality of Life? Vlaamse overhead.<br />
Submitted: Revised: Accepted and published online<br />
May 23, 2011 August 12, 2011 Octomber 15, 2011
Analele UniversităŃii din Ora<strong>de</strong>a – Seria Geografie Year XXI, no. 2/2011 (December), pp. 303-312<br />
ISSN 1454-2749, E-ISSN 2065-1619 Article no. 212116-541<br />
CHARACTERISTICS OF DEMOGRAPHICAL DYNAMICS IN AREAS<br />
OF URBAN INFLUENCE. CASE STUDY: INFLUENCE AREA OF<br />
RÂMNICU VÂLCEA CITY<br />
Constantin Cristian DRĂGHICI ∗<br />
University of Bucharets, Faculty of Geography, Interdisciplinary Center for Advanced Researches on Territorial<br />
Dynamics, CICADIT, Bucharest, Romania, e-mail: cristi7772001@yahoo.com<br />
Daniel PEPTENATU<br />
University of Bucharets, Faculty of Geography, Interdisciplinary Center for Advanced Researches on Territorial<br />
Dynamics, CICADIT, Bucharest, Romania, e-mail: peptenatu@yahoo.fr<br />
Radu-Daniel PINTILII<br />
University of Bucharets, Faculty of Geography, Interdisciplinary Center for Advanced Researches on Territorial<br />
Dynamics, CICADIT, Bucharest, Romania, e-mail: pinty_ro@yahoo.com<br />
Florentina-Cristina MERCIU<br />
University of Bucharets, Faculty of Geography, Interdisciplinary Center for Advanced Researches on Territorial<br />
Dynamics, CICADIT, Bucharest, Romania, e-mail: krysten1009@yahoo.com<br />
Loreta Andreea CERCLEUX<br />
University of Bucharets, Faculty of Geography, Interdisciplinary Center for Advanced Researches on Territorial<br />
Dynamics, CICADIT, Bucharest, Romania, e-mail: loretacepoiu@yahoo.com<br />
Abstract: The article captures the main characteristics of the <strong>de</strong>mographic dynamics in the<br />
influence area of Râmnicu Vâlcea city, between 1985 and 2007. In this respect, we analyzed<br />
the evolution in numbers of the population in the area of influence in the respective period, as<br />
well as a set of indicators such as birth rates, mortality rate, natural increase and the vitality<br />
in<strong>de</strong>x in or<strong>de</strong>r to i<strong>de</strong>ntify the changes of quantitative and qualitative nature that influenced the<br />
mass of population in the area of influence during the period analyzed.<br />
Keywords: population, evolution in numbers, birth rate, mortality rate, natural balance,<br />
vitality in<strong>de</strong>x.<br />
* * * * * *<br />
INTRODUCTION<br />
In geographical terms, the city is the most complex system at work in a territory. No matter<br />
its size, as a result of its polarizing capacity, the city exerts its influence on the surrounding space<br />
(Ungureanu and łurcănaşu, 2008). Furthermore, the city is consi<strong>de</strong>red „an optimal, open,<br />
thermodynamic and informational system” (Ianoş, 2004, p. 4), a system that <strong>de</strong>velops and survives<br />
thanks to the multitu<strong>de</strong> of relationships it establishes with the other, neighboring systems in the<br />
∗ Corresponding Author<br />
http://istgeorelint.uora<strong>de</strong>a.ro/Reviste/Anale/anale.htm
304<br />
Constantin Cristian DRĂGHICI, Daniel PEPTENATU, Daniel Radu PINTILII,...<br />
territory. All these ties the city establishes with the surrounding space, ties which indicate a mutual<br />
<strong>de</strong>pen<strong>de</strong>nce, eventually shape the area of influence of the respective urban center. This allows us<br />
to assert that the area of influence of a city is the primordial element in i<strong>de</strong>ntifying and<br />
individualizing the main systems of localities (Ianoş, 1987). At the territorial level, this complex<br />
system is groun<strong>de</strong>d in two sub-systems: the city itself and its area of influence. Both components<br />
are closely bound, by way of a multitu<strong>de</strong> of relations, generated especially by the city, a major<br />
consumer of resources (Pintilii et al., 2008; Drăghici et al., 2009). This is an explainable situation,<br />
as the city is in a state of constant <strong>de</strong>velopment, and it practically obtains most of the resources it<br />
needs from its area of influence (Ianoş, 1987; Negoescu, 1998; Mănescu, 1999; Istrate, 2008;<br />
Peptenatu et al., 2010a; Peptenatu et al., 2010b).<br />
In this context the analysis of the relations established between the city and its area of<br />
influence becomes an important stage in un<strong>de</strong>rstanding the transformations that impacted on the<br />
urban settlement, and especially the way it will evolve in the coming period. Among the multitu<strong>de</strong><br />
of ties, <strong>de</strong>mographic ties are very complex, which can be explained by the force of the attraction<br />
the polarizing city exerts, especially on the workforce.<br />
The changes of a socio-economic nature that have influenced Romania of late have left<br />
their imprint on <strong>de</strong>mographic dynamics, too, especially in the case of cities and indirectly on the<br />
cities’ areas of influence (Istrate, 2008). In general, population dynamics are linked to the<br />
population’s natural movement and mobility in the territory, as they are among the main elements<br />
that convey a big picture of the way a city’s area of influence has evolved in terms of<br />
<strong>de</strong>mographics (Staşac and Stupariu, 2010). The main factors that influenced, in time, the number<br />
of inhabitants in a certain area of influence are the birth rate and mortality rate, as well as<br />
population exchanges between the area of influence analyzed and outer regions.<br />
Population is the most active component in the dynamics of an area of influence, and in<br />
this respect the analysis of the dynamics of the population can be <strong>de</strong>emed an important stage in<br />
the study of areas of urban influence, and especially in territory planning and implementing a<br />
viable social policy (Cicharska, 2011).<br />
METHODS<br />
The analysis of the dynamics of population was conducted to encompass the entire area of<br />
influence, at city and commune level. Statistical data were processed and investigated, obtaining<br />
graphical and cartographical representations of various indicators that were used in the <strong>de</strong>tailed<br />
analysis of the studied area. In or<strong>de</strong>r to ensure the accuracy of the representations, the statistical<br />
data used come from both population censuses (1912 - 2002) and annual series for the time from<br />
1985 to 2007. Also the influence area of Râmnicu Vâlcea city has been established by overlapping<br />
three areas of influence, previously obtained (influence of health area, influence of cultural and<br />
educational area and the influence of transportation area) at a time resulting in a likely area of<br />
influence. The result is an asymetric expansion space, totaling a number of 33 localities (37% of<br />
total number existing settlements in the country) and with a population of 129.325 people (about<br />
31% of the total number of country resi<strong>de</strong>nts) (Drăghici et al., 2009).<br />
RESULTS<br />
Numerical evolution of the population<br />
The most general indicator used in the <strong>de</strong>scription of a certain population refers to its size or<br />
numbers. In or<strong>de</strong>r to ensure a strict <strong>de</strong>limitation of human communities, the size of the population is<br />
always associated with the categories of space and time.<br />
The evolution in numbers of the total population of the area of influence features an upward<br />
course, in general, but with certain fluctuations, a situation that allows a division into two distinct<br />
stages: 1912 - 1977 and 1977 - 2007 (figure 1).<br />
The 1912 - 1977 stage registered a net increase of 39,046 inhabitants, with the exception of<br />
the 1941 - 1948 time period, when there was a drop in the number of inhabitants.
Characteristics of Demographical Dynamics in Areas of Urban Influence… 305<br />
The 1948 - 1956 period saw the total number of inhabitants increase by 7,047, resulting in a<br />
positive total growth rate of 5.76%. Thus, 9 of the localities insi<strong>de</strong> the area of influence register total<br />
growth rate values of more than 10% (among them, 5 feature total growth rates of more than 15%: Băile<br />
Govora - 27.30%, Băbeni - 22.15%, Voineasa - 19.26%, Băile Olăneşti - 18.06%, Călimăneşti - 16.13%).<br />
Figure 1. Numerical evolution of the population (1912 - 2007)
306<br />
Constantin Cristian DRĂGHICI, Daniel PEPTENATU, Daniel Radu PINTILII,...<br />
During this period, 5 localities stand out as they register negative values of the total<br />
growth rate, 2 of them registering very high values for that indicator: Ocnele Mari (-39.34%)<br />
and Buneşti (-29.33%).<br />
The 1956 - 1966 period meant an increase in population numbers from 122,255 to 128,077,<br />
which meant a net growth of 5,822 inhabitants, or a total growth rate of 4.55%. The emergence of<br />
large industrial facilities in the area, as well as the attraction of certain urban centers, caused the<br />
<strong>de</strong>population of certain rural settlements, while on the other hand the city of Râmnicu Vâlcea<br />
becomes an important hub of attraction in the area. 5 localities stand out with positive growth rates<br />
of more than 20%: Voineasa (58.14%), Malaia (27.36%), Brezoi (23.44%), Buneşti (22.29%).<br />
However, the number of localities with positive growth rates is 18, or more than 50% of the total<br />
of administrative units analyzed. Drops in the number of inhabitants are registered in 15 localities,<br />
drops reflected in the value of the total growth rate to negative values. Among them, 3 localities<br />
stand out, with steep drops in the population: Ocnele Mari (-21.06%), Milcoiu (-14.57%) and<br />
Goleşti (-12.34%).<br />
The 1966 - 1977 period registered a total growth rate of 7.61%, meaning an increase in the<br />
number of inhabitants by 10,549. During this period 8 localities (Runcu, Milcoiu, Dănicei, Goleşti,<br />
Stoeneşti, Berislăveşti, Păuşeşti and Bărbăteşti) are those that register negative values of the total<br />
growth rate. The commune of Runcu stands out among them, there the value of the total negative<br />
growth rate is the highest, -14.74%. The other localities register positive values of the total growth<br />
rate, and several situations can be discerned:<br />
- steep positive evolution, with outstanding values, characteristic of 9 localities (values<br />
exceeding 500 inhabitants). 3 localities stand out: Călimăneşti (1,360 inhabitants), Voineasa (1,325<br />
inhabitants) and Malaia (1,067 inhabitants);<br />
- mo<strong>de</strong>rate positive evolution, with values ranging between 200 and 500 inhabitants, in 11<br />
localities: Buneşti, Vlă<strong>de</strong>şti, Mihăeşti, Olanu, Brezoi, Păuşeşti - Măglaşi and others.<br />
- low positive evolution, with less than 200 inhabitants: Sălătrucel, Muereasca, Stoileşti,<br />
Nicolae Bălcescu, Băile Olăneşti.<br />
The 1977 - 2007 stage meant a drop in the number of inhabitants in the area of influence<br />
from 138,626 people to 125,621 people (13,005 inhabitants). The main cause of this outstanding<br />
negative evolution was the migration of the population, both domestic and abroad, caused by the<br />
socio-economic conditions brought about by the post - 1990 changes.<br />
The 1977 - 1992 period registered a negative total growth rate of -8.14%, the lowest rate in<br />
the post - 1977 stage. Only 5 localities register positive values: the towns of Băbeni -13.14%,<br />
Călimăneşti -11.35%, Băile Govora -9.06%, Băile Olăneşti -2.78% and Brezoi -8.48%. The<br />
exception is the town of Ocnele Mari, where the total growth rate is negative (-7.35%), a situation<br />
mainly due to its proximity to the most important polarizing city, that is the city of Râmnicu<br />
Vâlcea. In the other 17 localities the total growth rate registers negative values, with the highest<br />
value found in the commune of Voineasa (-75.92%). Other localities with high negative values<br />
are: Malaia (-73.55%), Milcoiu (-36.86%), Runcu (-31.51%), and Goleşti (-23.69%). This steep<br />
drop has several causes:<br />
- first of all the drop in economic activity as a result of certain production facilities closing<br />
down after 1990, but also as the result of the completion of work on certain economic assets (the<br />
hydrotechnical work on the Olt and Lotru rivers);<br />
- the high <strong>de</strong>gree of isolation of certain localities, which brought about the migration of the<br />
young population to towns in the near vicinity or to the polarizing hub;<br />
- the change in the status of certain localities from rural into urban areas, which resulted in<br />
an increased attractiveness for the population in the neighboring localities;<br />
- the little-<strong>de</strong>veloped infrastructure at commune level, which caused the migration of the<br />
population to urban settlements with a superior level of social infrastructure.<br />
The 1992 - 2002 period is characterized by the continued downtrend but with a lower<br />
intensity than in the previous period (-1.33%), with the observation that the trend is reversed in the
Characteristics of Demographical Dynamics in Areas of Urban Influence… 307<br />
case of the towns. In the case of the towns this drop can be explained by the reorganization that<br />
encompassed industrial units insi<strong>de</strong> the towns, with the aftermath of the loss of jobs and the<br />
population’s return to their home communities. At an individual scale, the situation is as follows:<br />
- 8 localities registered positive growth rates, with the highest being those registered in the<br />
localities: Bujoreni - 10.86%, Băbeni - 8.35%, Dăeşti - 8.04%. Mention should be ma<strong>de</strong> that these<br />
growth rates are mainly registered by the rural localities in the first ring of settlements around the<br />
city of Râmnicu Vâlcea;<br />
- 25 townships posted negative growth rates, with the most massive <strong>de</strong>population registered<br />
in the commune of Voineasa where the value stood at -30.50%.<br />
The 2002 - 2007 period is characterizes by a trend towards a drop in the population, but the<br />
value is smaller than during the previous period, i.e. -0.71%. The following matters can be<br />
highlighted:<br />
- 8 localities register positive values of the total growth rate, 5 of them having registered<br />
positive values in the preceding period as well. The steepest growth rates are registered in the<br />
localities Bujoreni, Vlă<strong>de</strong>şti, Păuşeşti-Măglaşi, Bu<strong>de</strong>şti and Dăeşti;<br />
- the other 25 units registered negative values of the total growth rate, with the highest<br />
value registered by Dănicei (-7.25%).<br />
Birth rates<br />
The analysis of this geo-<strong>de</strong>mographic variable was meant to highlight the intensity of birth<br />
rates across environments (urban-rural) and across the territory with the goal of i<strong>de</strong>ntifying the trends<br />
of future evolution of the localities insi<strong>de</strong> the area of influence of the city of Râmnicu Vâlcea.<br />
The average birth rate during the 1985 - 2007 period fluctuated between a minimum of<br />
8.61‰ in the commune of Milcoiu and a maximum of 14.29‰ registered in the commune of<br />
Muereasca. The highest values of the average birth rate, above 12.7‰, are registered in 7<br />
localities, more exactly: Brezoi, Sălătrucel, Berislăveşti, Muereasca, Bujoreni, Frânceşti and<br />
Stoileşti. For the overall area, the birth rate values ranged from a maximum of 16.6‰ in 1987 to a<br />
minimum of 8.4‰ in 2007 (table 1).<br />
The outstanding growth during the 1985 – 1987 period was due to the legislation passed by<br />
the Romanian state in the field of <strong>de</strong>mographic policies. Furthermore, in 1987 the birth rate in 15<br />
localities registered very high rates, which excee<strong>de</strong>d the average rate of that year, 16.6‰. Among<br />
them, stand out the localities of Sălătrucel - 23.9‰, Brezoi - 22.6‰, Muereasca - 20.8‰, Milcoiu<br />
- 20.8‰. The trend continued on into next year, 1988, when the average birth rate in the area of<br />
influence of the city of Râmnicu Vâlcea stood at 16.38‰.<br />
Furthermore, those two years saw the highest number of live births in the entire time period<br />
analyzed: 2,169 in 1987 and 2,133 in 1988. The next year the birth rate dropped slightly, but it<br />
remained at a high value - 16.23‰.<br />
The post - 1990 socio-economic changes left their mark on the <strong>de</strong>mographic behavior of<br />
inhabitants of the area of influence of the city of Râmnicu Vâlcea. Practically, starting 1990 and<br />
through to 2007, the drop was a constant one, with a slight rise in 1997 and 2005. Subsequently,<br />
by 2007, 21 localities register values below the mean average of the area of influence. Among<br />
them, the commune of Dănicei stands out, with the lowest value, 3.4‰ (other localities with low<br />
values are: Şirineasa - 5.4‰, Runcu - 5.4‰, Goleşti - 5.5‰ and Galicea - 5.8‰).<br />
Mortality rate<br />
Socio-economic factors have a special importance in <strong>de</strong>termining the evolution of mortality<br />
rate. The ever-rising level of economic <strong>de</strong>velopment led to an improvement of living conditions of<br />
the population, which meant improved diets, improved healthcare services; if one adds shorter<br />
working hours and higher wages, all these factors contributed to the drop of mortality rate. The<br />
average value of the mortality rate in the area of influence of the city of Râmnicu Vâlcea during 1985
308<br />
Constantin Cristian DRĂGHICI, Daniel PEPTENATU, Daniel Radu PINTILII,...<br />
- 2007 remained between 12‰ - 14‰, with a peak in 1997, with 14.91‰ (values exceeding 14‰<br />
were also registered in 1996 - 14.34‰ and in 1998 - 14.63‰), and a low in 1986, 11.65‰ (table 1).<br />
If one analyzes the situation across the two environments - urban and rural - one can notice<br />
that the population in the urban environment registered the lowest values of the average mortality<br />
rate, below the annual average rate of the area of influence, values that endured throughout the<br />
time analyzed. Furthermore, by 2007, 4 of the towns registered a mortality rate below 10‰, a<br />
value below the mean average of the entire zone that year - 11.92‰. This situation can be<br />
explained by means of the higher ratio of young and adult groups of the total population.<br />
In exchange, in the case of localities in the rural sector the mortality rate values were<br />
higher, above the annual mean average registered throughout the time period. As a supporting<br />
argument, one can mention that in the time period analyzed 22 localities registered mortality<br />
rate values above 13‰, 21 of them communes (the exception is the town of Ocnele Mari), and 6<br />
of them actually exceed 16‰ (Milcoiu - 19.65‰, Runcu - 18.99‰, Dănicei - 17.96‰, Goleşti -<br />
16.24‰, Stoeneşti - 16.05‰).<br />
Table 1. The average birth and mortality rate in the influence area of Râmnicu Vâlcea for 1985 and 2007<br />
(Source data: calculated data)<br />
Nr.<br />
Average birth rate Average mortality rate<br />
Localitate<br />
Crt.<br />
(1985 - 2007)<br />
(1985 - 2007)<br />
1 BĂBENI 12,11 9,08<br />
2 BĂILE GOVORA 8,95 10,30<br />
3 BĂILE OLĂNEŞTI 12,69 11,49<br />
4 BREZOI 13,63 9,68<br />
5 CĂLIMĂNEŞTI 12,02 11,83<br />
6 OCNELE MARI 11,60 13,20<br />
7 BĂRBĂTEŞTI 9,62 15,77<br />
8 BERISLĂVEŞTI 13,75 12,92<br />
9 BUDEŞTI 11,61 12,06<br />
10 BUJORENI 14,03 13,09<br />
11 BUNEŞTI 12,66 13,42<br />
12 DĂEŞTI 12,44 13,08<br />
13 DĂNICEI 10,86 17,96<br />
14 FRÂNCEŞTI 13,39 13,32<br />
15 GALICEA 11,48 13,55<br />
16 GOLEŞTI 10,77 16,24<br />
17 IONEŞTI 11,03 14,52<br />
18 MALAIA 11,98 9,40<br />
19 MIHAEŞTI 10,91 13,89<br />
20 MILCOIU 8,61 19,65<br />
21 MUEREASCA 14,29 13,47<br />
22 NICOLAE BĂLCESCU 12,13 13,97<br />
23 OLANU 10,52 14,56<br />
24 PĂUŞEŞTI 10,34 14,17<br />
25 PĂUŞEŞTI –MĂGLAŞI 11,35 14,08<br />
26 PIETRARI 10,52 14,94<br />
27 RUNCU 10,95 18,99<br />
28 SĂLĂTRUCEL 14,10 11,97<br />
29 ŞIRINEASA 11,08 13,90<br />
30 STOENEŞTI 10,21 16,05<br />
31 STOILEŞTI 13,01 13,95<br />
32 VLĂDEŞTI 12,28 12,31<br />
33 VOINEASA 9,82 7,56
Characteristics of Demographical Dynamics in Areas of Urban Influence… 309<br />
Natural balance (natural increase)<br />
The evolution of the natural balance in the time analyzed follows, in general, the same<br />
course as the evolution of birth and mortality rates. Positive values of the natural increase rate are<br />
observed for the first six years (1985 - 1991), with a first peak registered in 1986 and 1987, 4.59‰<br />
and 4.15‰, respectively, and a second peak, of smaller magnitu<strong>de</strong>, in 1989 - 4.07‰. The lowest<br />
values in the entire region are regularly found after 1993, although negative values were observed<br />
as early as 1991 (-0.04‰). This drop occurred in the context of the constant drop of the birth rate<br />
and the mortality rate remaining at relatively the same levels.<br />
By 1986, 29 localities registered positive natural balance values and only 4 of them<br />
registered negative values of that indicator (figura 2). However, out of the 29 localities, only 13<br />
administrative units posted values that topped the mean average of the area of influence, 4.59‰. In<br />
the latter group, values above 9‰ were registered in the localities: Sălătrucel - 12.58‰, Bu<strong>de</strong>şti –<br />
10.93‰, Stoileşti - 9.71‰, Galice - 9.36‰, Băile Govora - 9.23‰, Brezoi - 9.12‰ and<br />
Muereasca - 9.01‰. Negative values were registered only in 4 localities: Runcu (-8.15‰), Milcoiu<br />
(-4.85‰), Bărbăteşti (-1.62‰) and Pietrari (-0.82‰).<br />
By 2007 the situation had reversed, so that there were 27 localities that registered negative<br />
values and only 6 localities where the natural balance was positive. Therefore, there were 20 localities<br />
that featured rates above the -3.51‰ mean average, and 4 of them featured values above -10‰:<br />
Păuşeşti-Măglaşi (-13‰), Dănicei (-16.25‰), Bărbăteşti (-11.42‰), Milcoiu (-10.50‰).<br />
Figure 2. Natural balance in the influence area of Râmnicu Vâlcea for 1986 and 2007<br />
(Source: calculated data)<br />
The 6 localities with positive natural balance values were: Muereasca - 3.23‰, Malaia - 0.52‰,<br />
Bujoreni - 4.01‰, Bu<strong>de</strong>şti - 1.23‰, Călimăneşti - 0.11‰ and Ocnele Mari - 0.86‰. These very low<br />
values of the natural increase rate can be explained by the drop in the birth rate and the mortality<br />
rate remaining at a relatively constant value. There are also localities where the ratio of people<br />
aged 60 and over is high. This situation is due on the one hand to the low birth rate and on the<br />
other hand to the shrinking young population group, as a result of migration to localities where<br />
economic outlooks are positive.<br />
The vitality in<strong>de</strong>x<br />
Information on this in<strong>de</strong>x allows one to issue forecasts on the evolution in number of the<br />
population, as well as the structure in terms of age groups. The mean average value for the entire area<br />
of influence of the city of Râmnicu Vâlcea was 91%, with an 85% value for the rural environment<br />
and 115% for the urban environment. During the time period analyzed, one can notice an increase of<br />
that in<strong>de</strong>x up to 1986, when it reaches a peak at 138% (figure 3). The next period stands out with a<br />
drop of that in<strong>de</strong>x to 71% by 2007, and thereafter the in<strong>de</strong>x value fluctuated from 65% to 71%, with<br />
an uptrend in the last year.
310<br />
Constantin Cristian DRĂGHICI, Daniel PEPTENATU, Daniel Radu PINTILII,...<br />
The evolution of the birth rate follows the same general trend in the two environments, urban<br />
and rural, with the mention that while in the case of rural localities the downtrend continues after<br />
2001 (from 68% to 64% by 2007), localities in the urban environment register a slight increase in the<br />
value of that in<strong>de</strong>x (from 83% to 91% by 2007).<br />
Figure 3. Vitality in<strong>de</strong>x (1985 - 2007)
Characteristics of Demographical Dynamics in Areas of Urban Influence… 311<br />
Evolution across the territory, by 1985, indicates that three communes - Voineasa,<br />
Berislăveşti and Malaia - feature values exceeding 200% (Voineasa - 311% ), 18 localities feature<br />
vitality in<strong>de</strong>x values ranging from 100% to 200% (this category inclu<strong>de</strong>s the 6 towns in the area of<br />
influence) and 12 localities with values below 100% (Runcu - 56%, Pietrari - 83%).<br />
By 2007, the situation is completely different from the situation early in the time analyzed,<br />
so that there are no more localities where that in<strong>de</strong>x would exceed 200%, and there are only 6<br />
localities with values exceeding 100%, more exactly 2 towns (Călimăneşti - 101% and Ocnele<br />
Mari - 107%) and 4 communes (Bu<strong>de</strong>şti - 115%, Bujoreni - 144%, Muereasca - 139% and Malaia<br />
- 108%). The other localities register values below 100%, and some actually below 50% (Dănicei -<br />
17%, Păuşeşti-Măglaşi - 33%, Runcu - 35%, Goleşti - 38%, Milcoiu - 39% and Şirineasa - 44%).<br />
CONCLUSIONS / DISCUSSION<br />
To conclu<strong>de</strong>, one can remark that in the time period analyzed, the number of<br />
inhabitants in the area of influence posted an overall increase (26,041 inhabitants).<br />
Furthermore, the peak was reached in the 1980s, when a very high birth rate was also<br />
registered (16.6‰ in 1987) as a consequence of the pro-birth policy adopted by the Romanian<br />
state at that time. However, starting 1990, there has been an obvious downtrend as far as the<br />
number of inhabitants in the entire area is concerned.<br />
This drop is groun<strong>de</strong>d in the socio-economic transformations of society at this time,<br />
transformations that inevitably influence the area of influence of the city of Râmnicu Vâlcea<br />
(Mălăescu, 2009). There is the additional factor of migration abroad in search of better jobs<br />
(Staşac and Stupariu, 2010). The extant situation as far as the post - 1990 number of<br />
inhabitants is concerned is reflected by the very low values of the natural increase rate, as the<br />
result of the drop of the birth rate and the relatively constant mortality rate at this time. In<br />
addition, the vitality in<strong>de</strong>x values for the time period analyzed, but especially for 2007,<br />
indicate a downtrend for the number of inhabitants in the area of influence of the city of<br />
Râmnicu Vâlcea as a result of the very low birth rate.<br />
One solution that would temper the drop in the number of inhabitants could be the<br />
<strong>de</strong>velopment insi<strong>de</strong> the area of influence of those complementary branches of the economy that<br />
would be capable of ensuring a sustainable <strong>de</strong>velopment, so that that <strong>de</strong>velopment would<br />
eventually be reflected at the individual level. This thing can only be achieved by creating a<br />
multiple-center network that would practically ensure a more efficient distribution of the<br />
<strong>de</strong>velopment, at both zonal and especially regional scale (Ianoş et al. 2009, Peptenatu et al., 2009,<br />
Peptenatu et al., 2010; Humeau et al., 2010).<br />
ACKNOWLEDGEMENTS<br />
This work was supported by the research project Territorial Management Based on Growth<br />
Poles Theory (UEFICSU-PNII-I<strong>de</strong>i, 1950), strategic grant POSDRU /89/1.5/S/58852, Project<br />
Program for postdoctoral researchers in science education, co-financed by the European Social<br />
Fund within the Sectoral Operational Program Human Resources Development 2007 - 2013.<br />
REFERENCES<br />
Cicharska Al. (2011), Demographic transformations of polish metropolises (tri-city case study), Analele UniversităŃii din<br />
Ora<strong>de</strong>a, Seria Geografie, Tom XXI, nr. 1, p. 39-43;<br />
Drăghici C., Pintilii R., Peptenatu D., Stoian D. (2009) Zona <strong>de</strong> influenŃă a municipiului Râmnicu Vâlcea – <strong>de</strong>limitare<br />
multicriterială/ The infulence area of Râmnicu Vâlcea – multicriterial <strong>de</strong>termination limits, Comunicări <strong>de</strong><br />
Geografie Vol. XIII, p. 283-291;<br />
Humeau J. B., Peptenatu D., Pintilii R., Draghici C., Schvab A. (2010), The Role of Polycentric Network in the<br />
Demographic Dynamic of Human Settlements, Journal of Urban and Regional Analysis, nr. 2(1), p. 25-37;<br />
Ianoş I. (1987), Oraşele şi organizarea spaŃiului geografic. Studiu <strong>de</strong> geografie economică asupra teritoriului României,<br />
Bucureşti, Editura Aca<strong>de</strong>miei R.S. România;
312<br />
Constantin Cristian DRĂGHICI, Daniel PEPTENATU, Daniel Radu PINTILII,...<br />
Ianoş I. (2004), Dinamica Urbană. AplicaŃii la oraşul şi sistemul urban românesc, Bucureşti, Editura Tehnică;<br />
Ianoş I., Peptenatu D., Zamfir D. (2009), Respect for environment and sustainable <strong>de</strong>velopment, Carpathian Journal of<br />
Earth and Environmental Sciences, vol. 4(1), p. 81 – 93;<br />
Istrate M. (2008), RelaŃiile urban - rural în Moldova în perioada contemporană, Iaşi, Editura UniversităŃii „Alexandru Ioan Cuza”;<br />
Mălăescu S. (2009), Analysis of the resi<strong>de</strong>ntial mobility from the urban space in the subcarpathians’ area bor<strong>de</strong>red by Olt and<br />
Jiu rivers during the transition period, Analele UniversităŃii din Ora<strong>de</strong>a, Seria Geografie, Tom XIX, p.155-162;<br />
Mănescu L. (1999), Oraşul Buzău şi zona sa <strong>de</strong> influenŃă, Bucureşti, Editura UniversităŃii din Bucureşti;<br />
Negoescu B. (1998), Oraşul Târgovişte şi zona sa <strong>de</strong> influenŃă, Bucureşti, Editura Anima;<br />
Peptenatu D., Pintilii R. D., Drăghici C. (2010a), The specificity of risks management in the urban settlements highly<br />
industrialized from Romania. Galati national <strong>de</strong>velopment pole, as a case study, Analele Universitatii din Ora<strong>de</strong>a,<br />
Seria Geografie Tom XX, nr.1, p. 108-119;<br />
Peptenatu D., Pintilii R. D., Peptenatu A., Drăghici C. (2010b), The role of rural settlements occupying a central position in<br />
the elaboration of the strategies of territorial management. Case study the southwestern <strong>de</strong>velopment region,<br />
Revista Română <strong>de</strong> Geografie Politică, Year XII, no. 2, p. 411-427;<br />
Peptenatu D., Pintilii R.D., Cepoiu L., Drăghici C. (2009), Polycentric <strong>de</strong>velopment strategy – an efficient instrument in<br />
administrative <strong>de</strong>centralization, Revista Română <strong>de</strong> Geografie Politică, nr. 2(2), p. 99-111;<br />
Pintilii R.D., Peptenatu D., Drăghici C.C. (2008), Criterii si indicatori utilizaŃi în <strong>de</strong>limitarea zonelor <strong>de</strong> influenŃă urbană,<br />
Comunicări <strong>de</strong> Geografie, vol. XII, p.421-426;<br />
Stasac M., Stupariu M. I. (2010), External migratory dynamics of the romanian population at the end of the 20th century<br />
and the beginning of the 21st century <strong>de</strong>termined by the change of resi<strong>de</strong>nce, Analele Universitatii din Ora<strong>de</strong>a,<br />
Seria Geografie Tom XX, nr. 1, p. 86-91;<br />
Ungureanu Al., łurcănaşu G. (2008), Geografia aşezărilor umane, Iaşi, Editura Performantica.<br />
Submitted: Revised: Accepted and published online<br />
July 12, 2011 Octomber 25, 2011 November 23, 2011
Analele UniversităŃii din Ora<strong>de</strong>a – Seria Geografie Year XXI, no. 2/2011 (December), pp. 313-322<br />
ISSN 1454-2749, E-ISSN 2065-1619 Article no. 212117-555<br />
WAYS OF MANAGING THE URBAN-RURAL INTERFACE. CASE<br />
STUDY: BUCHAREST<br />
Ilinca-Valentina STOICA ∗<br />
University of Bucharets, Faculty of Geography, Interdisciplinary Center for Advanced Researches on Territorial Dynamics,<br />
CICADIT, Bucharest, Romania, e-mail: stoicailincavalentina@gmail.com<br />
Cristian TĂLÂNGĂ<br />
University of Bucharets, Faculty of Geography, Interdisciplinary Center for Advanced Researches on Territorial Dynamics,<br />
CICADIT, Bucharest, Romania, e-mail: cristian2851@yahoo.com<br />
Cristian BRAGHINĂ<br />
University of Bucharets, Faculty of Geography, Interdisciplinary Center for Advanced Researches on Territorial Dynamics,<br />
CICADIT, Bucharest, Romania, e-mail: cristianbraghina@yahoo.com<br />
Daniela ZAMFIR<br />
University of Bucharets, Faculty of Geography, Interdisciplinary Center for Advanced Researches on Territorial Dynamics,<br />
CICADIT, Bucharest, Romania, e-mail: irdanniela@yahoo.com<br />
Abstract: Management of the urban-rural interface is a challenge at European level, in the<br />
context of the current concerns about optimizing urban-rural linkages. In this context, the<br />
present article analyzes the characteristics of the urban-rural interface of the city of Bucharest<br />
(tackled at a mid-territorial scale) and the ways its sustainable and equitable management can<br />
be accomplished. At the same time, the article also analyzes the post-1990 changes that<br />
occurred insi<strong>de</strong> that interface, un<strong>de</strong>r the influence of various forces and actors, with varied<br />
interests, which brought about a certain manner of structure and functional organization.<br />
Key words: urban-rural interface, Bucharest, territorial relations, space, management<br />
* * * * * *<br />
INTRODUCTION<br />
In the context of the current urban expansion, „rural areas are no longer outsi<strong>de</strong> the city, but<br />
become an area „in-between” urbanized spots (Horlings and Mars<strong>de</strong>n, 2010). „Whilst the physical<br />
and functional boundaries of urban and rural areas are becoming ever more blurred, the<br />
inter<strong>de</strong>pen<strong>de</strong>ncies are simultaneously becoming more complex and dynamic, containing structural<br />
and functional flows of people, capital goods, information, technology and lifestyles” (CURS,<br />
2004, quoted in Smith and Courtney, 2009). „These areas are characterised by a wi<strong>de</strong> variety of<br />
land uses expressed in a complex, diverse and highly fragmented morphology” (Antrop, 2004,<br />
quoted in Madsen et al., 2010).<br />
In this context, urban-rural ties are un<strong>de</strong>r the scrutiny of European <strong>de</strong>cision-making<br />
institutions, this concern being emphasized within documents such as ESDP (European Spatial<br />
∗ Corresponding Author<br />
http://istgeorelint.uora<strong>de</strong>a.ro/Reviste/Anale/anale.htm
314<br />
Ilinca-Valentina STOICA, Cristian TĂLÂNGĂ, Cristian BRAGHINĂ, Daniela ZAMFIR<br />
Development Perspective, adopted in 1999 by the ministries of the 15 states that were EU<br />
members at that time), the Lisbon strategy, the Territorial Agenda of the European Union (2007),<br />
or the Green Paper on territorial cohesion (2008). In May 2011, the ministers responsible for<br />
Spatial Planning and Territorial Development in the EU adopted Territorial Agenda of the<br />
European Union 2020, which revised the 2007 document. According to that document „urbanrural<br />
inter<strong>de</strong>pen<strong>de</strong>nce should be recognised through integrated governance and planning based<br />
on broad partnerships” (Territorial Agenda of the European Union 2020).<br />
Simultaneously, „The CAP towards 2020”, „proposes improving the links between rural<br />
and urban areas as a means of contributing to the balanced territorial <strong>de</strong>velopment of rural<br />
areas” (Talbot and Courtney, 2011). „In EU discourses, urban-rural linkages are usually<br />
constructed from an urban perspective, with rural areas conceptualised as residuals between<br />
dynamic urban growth no<strong>de</strong>s. References to urban-rural linkages, where in evi<strong>de</strong>nce, have<br />
generally been confined to the domain of Spatial planning and Cohesion policy” (Talbot and<br />
Courtney, 2011). Thus, their inclusion in the CAP toward 2020 is a signal concerning the<br />
rethinking of urban-rural linkages from the point of view of rural policies.<br />
„However, while there have been various studies concentrating on certain aspects of ruralurban<br />
linkages such as employment, migration, commuting and landscapes, there are few<br />
aca<strong>de</strong>mic theories and concepts concerning rural-urban relationships per se” (Davoudi and<br />
Stead, 2002, quoted in Smith and Courtney, 2009). The current study’s approach is the analysis of<br />
the linkages and inter<strong>de</strong>pen<strong>de</strong>nces that are established between the two types of spaces.<br />
In Romania’s case, several types of linkages can be established across the land, <strong>de</strong>pending<br />
on the size of the polarizing city and the characteristics of the surrounding rural space. Linkages<br />
can therefore be:<br />
- dynamic interaction linkages<br />
The polarizing city brings about a radical transformation of the surrounding rural space<br />
(Bucharest, or other large cities, such as Cluj Napoca, Iaşi, and others), by means of gradual<br />
expansion into that space, alongsi<strong>de</strong> the emergence of new resi<strong>de</strong>ntial spaces and the conduct of<br />
various economic ventures. In this context, the rural area is an outlet for the overcrow<strong>de</strong>d urban<br />
space. Initially, in the first phase, several activities start to be concentrated from the urban area,<br />
punctually, and new resi<strong>de</strong>ntial spaces are built, which brings about the <strong>de</strong>velopment of basic<br />
infrastructure. In the second phase, one notices an increase in the attractiveness of the respective<br />
area in the land and the <strong>de</strong>velopment of certain activities on bigger surfaces, around the areas<br />
<strong>de</strong>veloped initially, or individually, in their vicinity. Later on, companies begin to be attracted by<br />
that space where a general well-<strong>de</strong>fined infrastructure is available, lower costs of buildings or<br />
tracts of land, so that some of the operations in the urban space are relocated. At the same time, the<br />
benefit is that they can resort to the specialized workforce in the urban space. Gradually, this space<br />
sees its <strong>de</strong>velopment level rising close to the urban one, and it can even be incorporated into that,<br />
administratively. At the same time, the <strong>de</strong>velopment of the adjacent rural territory leads to the<br />
strengthening of the ties with the urban environment.<br />
- stable interaction linkages<br />
The city lacks the necessary force to bring about massive changes, and its influence is only<br />
visible on limited spaces, and the impact on the rural space is quite limited. Thus, the city supplies<br />
to the rural area a range of services (commercial, educational, medical, cultural, and others) and<br />
jobs. At the same time, the urban sector is supplied with resources from the rural sector. In this<br />
case, in some situations a range of activities begin to be located in the interface, as well as a series<br />
of buildings with resi<strong>de</strong>ntial purposes, located in a diffuse manner. In Romania, this situation is<br />
typical of medium-sized cities, whose interface is usually represented by the first ring of<br />
administrative-territorial units.<br />
-indifference linkages<br />
The city <strong>de</strong>termines isolated changes, with a limited or insignificant impact, as it lacks the<br />
capacity to bring about transformations in the rural space. In general, in this situation, the <strong>de</strong>grees
Ways of Managing the Urban-Rural Interface. Case Study: Bucharest 315<br />
of <strong>de</strong>velopment of the two types of environments are close, so that the interface is all but<br />
inexistent, as the characteristics are relatively the same. The difference is <strong>de</strong>termined by the<br />
concentration in the urban space of certain administrative, commercial or educational services.<br />
This situation is in general typical of small towns in Romania.<br />
The ties existing between the two types of spaces can change in time, <strong>de</strong>pending on a<br />
series of catalyst factors, which may bring about their consolidation or stabilization.<br />
„However, rural-urban linkages also vary according to local historical, political, sociocultural<br />
and ecological factors” (Tacoli, 1998).<br />
„Rural-urban interactions can be divi<strong>de</strong>d into two categories: 1. linkages across space<br />
(such as flows of people, goods, money and information and wastes); and 2. sectoral<br />
interactions, which inclu<strong>de</strong> 'rural' activities taking place in urban areas (such as urban<br />
agriculture) or activities often classified as 'urban' (such as manufacturing and services)<br />
taking place in rural areas” (Tacoli, 1998).<br />
The whole of the urban-rural flows transiting the area between the two spaces make up<br />
a transcalar field, which represents the urban-rural interface. This actually represents a<br />
transition zone, created at the intersection of two entities with distinct characteristics and<br />
which are in constant transformation, by means of the acquisition of characteristics,<br />
especially, from the adjacent urban space.<br />
This zone is „no longer seen as just a boundary ‘in-between’ the city and the country; the<br />
interface is characterized as a process where i<strong>de</strong>ntification and location, place and i<strong>de</strong>ntity, are<br />
being contested and reconfigured” (Kaiser and Nikiforova, 2006, quoted în Masuda et al., 2008,<br />
quoted in Stoica et al., 2010).<br />
MATERIALS AND METHODS<br />
In the context of the current concerns about the way to approach the urban-rural interface,<br />
this study sets the goal of analyzing - by way of a case study - the characteristics of the interface<br />
and the way a sustainable and equitable management could be achieved, for the benefit of the<br />
communities involved.<br />
The urban-rural flows that transit and shape the interface <strong>de</strong>termine the differentiated<br />
organization of its structure, <strong>de</strong>pending on their volume and intensity. Thus, across the territory,<br />
the interface can be approached on three levels of analysis, as follows: micro-territorial, midterritorial<br />
and macro-territorial (Stoica et al., 2011).<br />
The micro-territorial level can be assessed by means of an analysis of the modifications that<br />
emerge in the structure of the land use. This represents the territory next to the bor<strong>de</strong>r separating<br />
the urban and rural areas, and it is inclu<strong>de</strong>d in both types of spaces, as a transitional strip.<br />
The mid-territorial level can be consi<strong>de</strong>red - in case of the Romanian space - the first ring<br />
of administrative-territorial units around the urban area. In some cases it can be expan<strong>de</strong>d to the<br />
second ring, too, <strong>de</strong>pending on local particularities.<br />
The macro-territorial level consists in the administrative-territorial units adjoining the urban center<br />
that can make up an urban-rural association complex. Its bor<strong>de</strong>rs <strong>de</strong>pend on the <strong>de</strong>gree of complexity of<br />
urban-rural linkages and it can be <strong>de</strong>termined by means of quantitative and qualitative criteria.<br />
As far as the urban-rural interface is concerned, approached on any of the three levels<br />
of analysis, the question arises concerning the way its sustainable management could be<br />
accomplished. This is a challenge, as, although a change of direction is attempted at the level<br />
of European policies in the sense of reconsi<strong>de</strong>ring urban-rural linkages, the process is a<br />
difficult one because of the diversity of the types of flows transiting different spaces,<br />
characterized by a certain level of <strong>de</strong>velopment and interacting in different ways, bringing<br />
about a certain manner of structure of the land. „Spatial <strong>de</strong>velopment policies which have<br />
attempted to integrate rural and urban dimensions have often failed because they were based<br />
on inaccurate generalisations about the relationship between the two” (Tacoli, 1998). We<br />
consi<strong>de</strong>r a mo<strong>de</strong>l of management has to be created, on the basis of the results of studies
316<br />
Ilinca-Valentina STOICA, Cristian TĂLÂNGĂ, Cristian BRAGHINĂ, Daniela ZAMFIR<br />
conducted punctually, with the purpose of i<strong>de</strong>ntifying those successful scenarios, which<br />
would allow the later use on large areas, according to the principle of good practices.<br />
To that goal, in the current work an analysis will be conducted of the manner management<br />
of the interface can be achieved, by a means of a case study, covering Bucharest, whose interface<br />
is approached at mid-territorial levels, that is the first ring of administrative units. Choosing the<br />
mid-territorial level is motivated by the fact that it represents the space where the action of urbanrural<br />
linkages is at its most visible. Its bor<strong>de</strong>rs were consi<strong>de</strong>red from the administrative point of<br />
view, as it was the only way to conduct quantitative analyses in addition to the qualitative ones,<br />
which allow the study of the evolution of the characteristics of that space.<br />
At the same time, the micro-territorial level is difficult to quantify across the land, as the<br />
statistical data do not allow a dynamic analysis. Instead, a limited analysis is rather easier to<br />
conduct of the changes occurred in the manner of use of the tracts of land.<br />
The quantitative analyses (conducted at mid-territorial level), are used with the goal of<br />
i<strong>de</strong>ntifying the way the analyzed area’s structure was organized post-1990, as a result of the<br />
changes brought about by the legislative changes, which influenced the volume and type of the<br />
flows transiting that area. Special attention must also be paid to un<strong>de</strong>rstanding the mechanisms that<br />
<strong>de</strong>termined a particular type of evolution.<br />
CASE STUDY<br />
As far as the urban-rural interface of the city of Bucharest, at mid-territorial level, it<br />
consists, across the territory, in a first ring of localities, comprising 16 administrative-territorial<br />
units (figure 1). Circa 175,000 inhabitants live in that area (National Institute of Statistics, 2009).<br />
Figure 1. The urban-rural interface of the Bucharest (mid-territorial level)<br />
The evolution of these administrative-territorial units was heavily influenced by their<br />
proximity to Bucharest, especially in the post-1976 period, when a law was passed that banned the<br />
population from settling in Romania’s big cities. In that context, these served as „dormitory”<br />
towns for the population attracted by the numerous jobs, the result of the intense process of forced<br />
industrialization the capital city was subjected to. Thus, by 1989, their population rose a lot,
Ways of Managing the Urban-Rural Interface. Case Study: Bucharest 317<br />
because of the high rate of immigration (some settlements actually saw the number of inhabitants<br />
double - Voluntari, Pantelimon, Cernica, Glina, Măgurele) (Ianoş, 1990).<br />
„However, immediately after the change of the communist regime, the rules concerning the<br />
unique property, the restriction of urban housing as well as the one regarding the sprawl of the<br />
built space of cities and towns have been abrogated” (Suditu, 2009).<br />
As a result, in the first few years of the transition, the population settled directly in the<br />
capital, so that the rate of immigration dropped. Later on, overall, one can notice the general<br />
evolution of the rate of immigration relatively stagnated, with slight fluctuations, followed, starting<br />
2003, by a visible increase in values. While, before 1989 immigrants to these townships were<br />
people wanting to settle as close to the capital as possible, after 1989 there is a noticeable reversal<br />
of flows, the trend being that of the migration of the Bucharest population with high and medium<br />
income, wanting to buy homes close to the capital city. The highest values were registered in 2008.<br />
In all, during 1990 - 2009, more than 74,000 people settled in the communities analyzed, 49.7% of<br />
them heading for Otopeni, Popeşti-Leor<strong>de</strong>ni, Pantelimon and Voluntari.<br />
An analysis of the evolution of the number of inhabitants insi<strong>de</strong> the urban-rural interface,<br />
starting 1990 and up to the present, reveals that the steepest growth rates were registered in Bragadiru<br />
(103.5%), Otopeni (59.7%) and Mogoşoaia (53.4%), and the lowest was registered in Măgurele (0.8%).<br />
Figure 2. The number of inhabitants (2009) and population increase between 1990 - 2009<br />
An involution as far as the number of inhabitants is concerned was registered only in<br />
Clinceni, whose population dropped by 2.3%. By 2009, the biggest number of inhabitants was<br />
registered in Voluntari (more than 33,000 inhabitants) (figure 2), followed by Pantelimon and<br />
Popeşti-Leor<strong>de</strong>ni. Nevertheless, the biggest part of the administrative-territorial units (68.8%),<br />
feature populations of less than 10,000 inhabitants, who account for 46.5% of the total population
318<br />
Ilinca-Valentina STOICA, Cristian TĂLÂNGĂ, Cristian BRAGHINĂ, Daniela ZAMFIR<br />
between them. Thus, while in the communist time the interface was in general „static”, with<br />
bor<strong>de</strong>rs clearly <strong>de</strong>fined across the landscape, and very difficult to change (against the background<br />
of socio-economic restrictions), in the post-1989 years the mechanisms used to modify the limits<br />
of the interface were no longer enforced by a central authority, but influenced by regional and<br />
local factors (Stoica et al., 2010). These factors <strong>de</strong>termine the organization of the interface<br />
structure across the land and the fluctuation of its limits.<br />
In this context, the proximity to the city of Bucharest and the position of certain settlements<br />
along the main access routes brought about their rapid <strong>de</strong>velopment, and they were <strong>de</strong>clared<br />
towns, which can be consi<strong>de</strong>red an intermediary stage between the big metropolis and the adjacent<br />
rural area. Thus, 7 towns are located in the first belt of administrative-territorial units, Otopeni<br />
acquiring that quality in 2000, Popeşti - Leor<strong>de</strong>ni and Voluntari in 2004, and the others in 2005<br />
(Pantelimon, Măgurele, Bragadiru, Chitila). These towns registered a strong <strong>de</strong>velopment, marked<br />
by an important increase in the number of inhabitants and the built-up stock, un<strong>de</strong>r the impact of<br />
pressure generated by the location in the close proximity of a big urban center.<br />
Declaring those urban settlements is a manner of managing urban-rural linkages by way of a<br />
specific policy, as those towns represent an intermediary stage between Bucharest and the <strong>de</strong>ep rural.<br />
The increase in the number of inhabitants of the administrative units analyzed occurred<br />
simultaneously with an increase in the number of dwellings and the improvement of social and<br />
town infrastructure. As far as houses are concerned, their number increased (figure 3), as a result<br />
of the completion of several real-estate projects, in the context of high <strong>de</strong>mand coming from the<br />
inhabitants of the city of Bucharest. Thus, new resi<strong>de</strong>ntial areas emerged on the bor<strong>de</strong>r with the<br />
metropolis, especially along the road transport routes, as a bridge linking the metropolis and the<br />
surrounding space, areas that practically confirm the phenomenon of urban expansion.<br />
Figure 3. In<strong>de</strong>x of housing construction period and the number of new houses built between 1990 - 2009
Ways of Managing the Urban-Rural Interface. Case Study: Bucharest 319<br />
Thus, more than 23,500 new houses were completed during the 1990 - 2009 interval, most of<br />
them in Voluntari (more than 5,400) and in Popeşti-Leor<strong>de</strong>ni (more than 3,200). At the opposite end,<br />
there are less attractive areas (with less than 1,000 new homes built), located in the South-East<br />
(Pantelimon, Cernica, Glina), South-West (Măgurele, Jilava), and in addition in Chitila and Tunari.<br />
In or<strong>de</strong>r to <strong>de</strong>termine the ratio of new dwellings in the stock of buildings in the analyzed<br />
area, an in<strong>de</strong>x of housing construction period was calculated, matching the number of new houses<br />
built during 1990 - 2009 against the total number of extant houses by 2009.<br />
The results reveal that in all 34.6% of the current volume of constructions was built after<br />
1990 (figure 3). Moreover, values exceeding 40% are registered in half of the administrative units.<br />
The first townships to be attractive for real-estate investors were Otopeni, Mogoşoaia and<br />
Voluntari, before 2000, and then later on, as the <strong>de</strong>gree of interest across the land increased, and<br />
the price of land rose, the center of attraction gradually spread to the other townships, too.<br />
In or<strong>de</strong>r to highlight the characteristics of the new dwellings, the dynamics of living area<br />
per house and per person were analyzed. As far as the living area per house is concerned, one<br />
noticed that by 2009 it featured values ranging from 46.1 sqm per house to 80.6 sqm per house.<br />
The highest values were typical for Mogoşoaia and Voluntari, and the lowest values for Chitila<br />
and Glina, respectively (figure 4).<br />
In the past 19 years there was a noticeable increase in the living area per house in all<br />
administrative-territorial units, with the highest values (above 40 sqm per house) being typical of<br />
Mogoşoaia and Voluntari, and the lowest typical of Glina and Măgurele.<br />
Figure 4. The evolution of living area per house (sqm per house)<br />
As far as the living area per person is concerned, it can be noticed that by 2009 it registered<br />
values ranging from 12.2 sqm per person to 36.2 sqm per person. The highest values (above 30<br />
sqm per person) are typical of the south-western area (Domneşti, Clinceni, Bragadiru), as well as
320<br />
Ilinca-Valentina STOICA, Cristian TĂLÂNGĂ, Cristian BRAGHINĂ, Daniela ZAMFIR<br />
Otopeni and Voluntari. Starting 1990 and up to 2009, the living area per person rose by the highest<br />
rates (more than 20 sqm per person) in Voluntari, Domneşti and Clinceni (figure 5). Living area per<br />
person rose by low rates - less than 5 sqm per person - in Pantelimon, Cernica, Chitila and Jilava.<br />
Figure 5. The evolution of living area per person (sqm per person)<br />
As a result of the changes brought by the legislative modifications of December 1989, in<br />
the area analyzed, the economic profile of the settlements un<strong>de</strong>rwent a series of transformations.<br />
Thus, „the communist period was characterized by forced industrialization in the first belt of<br />
localities around Bucharest and by excessive ruralization of the localities placed outsi<strong>de</strong> that belt”<br />
(Ianoş et al., 2010). As a result, on the bor<strong>de</strong>r between Bucharest and those settlements, heavy<br />
industrial areas <strong>de</strong>veloped gradually, especially machine construction or chemicals industrial<br />
facilities. This also had an effect on the structure of the active population of those communities, in<br />
terms of the increase of the ratio of the population employed in the secondary sector. At the same<br />
time, the <strong>de</strong>velopment of those industrial facilities brought about the establishment and<br />
consolidation of production and human-resource ties with the metropolis.<br />
Un<strong>de</strong>r the new social-economic conditions of the post-1990 years, the old industrial<br />
facilities, bound to the city’s economy, changed the field of activity, significantly downsized<br />
operations and/or, for the most part, went bankrupt. „The free-space stock favored the<br />
<strong>de</strong>velopment of varied service activities (finance-banking, social headquarters for companies,<br />
business centers, technological parks, a.o.). Gradually, some <strong>de</strong>cision centers of foreign capital<br />
companies moved or settled from the very beginning in the Bucharest periphery or even in the<br />
metropolitan area” (Ianoş et al., 2010). A significant <strong>de</strong>velopment was registered by those<br />
companies that operate in the field of tra<strong>de</strong>, or in the foods industry. The location of certain<br />
commercial services on the bor<strong>de</strong>r of the city of Bucharest gradually won over other
Ways of Managing the Urban-Rural Interface. Case Study: Bucharest 321<br />
investments, as well, which concentrated especially close to the main access routes. As a result,<br />
there was an increase in the ratio of the employed population working in the tertiary sector.<br />
At the same time, the normal connections between the city and the surrounding area<br />
continued as far as services and supplying the city with agri-foods products was concerned, given<br />
the high ratio of farmland in the territorial structure of the rural communities, as well as the extant<br />
<strong>de</strong>mand for agri-foods products on the market of a city with more than 2 million inhabitants. This<br />
situation also influenced preserving a part of the population employed in the primary sector.<br />
RESULTS AND DISCUSSIONS<br />
Nowadays, in Romania, the urban-rural interface zone, no matter the size of the polarizing<br />
city, registers management <strong>de</strong>ficiencies, as, typically, local authorities in the rural space are willing<br />
to accept any type of investment coming from the urban area that would lead to boosting the rural<br />
space by means of the creation of new jobs, an increase in local tax revenue collected, and the<br />
possibility of an increase in attractiveness across the land. On the other hand the urban space<br />
consi<strong>de</strong>rs the rural area as a „pressure valve” it can use, either for new constructions, or for<br />
relocation of certain activities. At the same time, there is a clear influence felt of the agents in<br />
urban areas, whose organizational capacity and financial means are much higher than those of the<br />
entities in the neighbour area. In this context, the <strong>de</strong>velopment of this space is chaotic, without<br />
very clear norms and without apparent benefits for the local population.<br />
How can be managed a space, with a complex structure, located near the biggest city in<br />
Romania, a space where new resi<strong>de</strong>ntial areas have <strong>de</strong>veloped in the past 20 years, and a space<br />
where various enterprises located chaotically across the area conduct operations? The particular<br />
manner of the current urban expansion <strong>de</strong>termined the apparition of certain dysfunctions that<br />
prevent the normal functioning of the ties between Bucharest and the adjacent urban area.<br />
Nowadays, the <strong>de</strong>adlocks are obvious and they are apparent in the field of transportation, the<br />
unfolding of infrastructure works or leisure spaces, among others. In this context, it is obvious this<br />
area must be approached in an integrated manner, as the <strong>de</strong>gree of inter<strong>de</strong>pen<strong>de</strong>nce of the linkages<br />
between the two areas is significant.<br />
However, the sustainable management of the urban-rural interface is <strong>de</strong>pen<strong>de</strong>nt on the attitu<strong>de</strong><br />
of local authorities, who issue distinct local strategies and policies, which may generate cooperation<br />
ties or, on the contrary, conflicts, which shape the interface’s <strong>de</strong>velopment patterns later on. At the<br />
same time, the local authorities’ actions are subordinated to the regional and national policies that<br />
<strong>de</strong>termine specific directions for <strong>de</strong>velopment, which are supplemented by local policies. A full<br />
spectrum of actors is at work in this area of interference (starting from local communities and<br />
through to various institutions), with varied interests as far as the interface’s later features are<br />
concerned. The sustainable management of such an area involves those actors’ cooperation, by<br />
means of the presence of joint approaches of matters of mutual interest (Stoica et al., 2011).<br />
In this context, in the case of the urban-rural interface of the city of Bucharest, too, a<br />
<strong>de</strong>velopment strategy is necessary, that would allow the working together of the actors involved, with a<br />
view to i<strong>de</strong>ntifying a way for joint management. Its goal is to optimize the extant ties and achieve a<br />
sustainable structure of the interface proper. Declaring some of these settlements towns was a means of<br />
managing this interference space, but that lewd to the creation of a <strong>de</strong>gree of in<strong>de</strong>pen<strong>de</strong>nce of those<br />
communities, which practically led to a fragmentation of the urban-rural interface.<br />
At the same time, the challenge that arises is that of i<strong>de</strong>ntifying means to manage a space<br />
structured beforehand, which features a certain functional organization. In this context management can<br />
only lead to optimizing the extant ties and suggest directions for later <strong>de</strong>velopment.<br />
CONCLUSIONS<br />
While in the communist period, in Romania, the urban-rural interface may be consi<strong>de</strong>red to have<br />
been „static”, that is with all but unchanged limits, in the context of certain very strict laws, which
322<br />
Ilinca-Valentina STOICA, Cristian TĂLÂNGĂ, Cristian BRAGHINĂ, Daniela ZAMFIR<br />
enforced certain restrictions, in the context of the abrogation of those laws after 1989, limits become<br />
dynamic.<br />
The urban-rural interface of the city of Bucharest was structured in the past 20 years,<br />
un<strong>de</strong>r the impact of various forces and agents that brought about a specific functional<br />
organization. Urban expansion occurred in the absence of clear regulations, which brought<br />
about the random emplacement of certain resi<strong>de</strong>ntial complexes and certain economic<br />
ventures. The result was the emergence of certain dysfunctions as far as the unfolding of<br />
urban-rural linkages is concerned, which stands out in the field of transportation, certain<br />
infrastructure works and waste storage, among others.<br />
In this context, managing it is a difficult but necessary process, which ought to lead to the<br />
collaboration of local authorities in the direction of i<strong>de</strong>ntifying an integrated approach to that<br />
interference space. The enforcement of such a direction must lead to optimizing the extant linkages<br />
between Bucharest and the adjacent rural area and to i<strong>de</strong>ntifying the actions to take at a later time<br />
with a view to clearly regulating the manner urban expansion will unfold.<br />
ACKNOWLEDGEMENTS<br />
This work was supported by CNCSIS - UEFISCSU, project number PNII - IDEI co<strong>de</strong> 1948/2008.<br />
REFERENCES<br />
Horlings I., Mars<strong>de</strong>n T. (2010), Pathways for sustainable <strong>de</strong>velopment of European rural regions: ecoeconomical<br />
strategies and new rural-urban relations, Working Paper Series No. 55, The Centre for Business Relationships,<br />
Accountability, Sustainability & Society(BRASS), Cardiff University;<br />
Ianoş I., Cercleux L., Pintilii R. D. (2010), Remarks on i<strong>de</strong>ntity building of rural and urban communities in the Bucharest<br />
metropolitan area, Analele Universității din Ora<strong>de</strong>a, seria Geografie, Tom XX, No. 2, 173-183;<br />
Ianoş I. (1990), Satele foarte mari din România, Terra, 1-4, 32-37;<br />
Madsen M.F., Kristensen S. P., Fertner C., Busck A.G., Jørgensen G. (2010), Urbanisation of rural areas: A case study<br />
from Jutland, Denmark, Geografisk Tidsskrift-Danish Journal of Geography;<br />
Smith I., Courtney P. (2009), Preparatory study for a seminar on rural-urban linkages fostering social cohesion, Final<br />
Report, DG Regional Policy, Brussels;<br />
Stoica I.V., Braghină C., Tălângă C. (2011), The outlooks of managing the urban-rural interface. Case study: the Galati-<br />
Braila bipolar area (Romania), manuscript;<br />
Stoica Ilinca-Valentina, Tălângă C., Zamfir Daniela (2010), Urban-rural interface: general remarks. Application in the<br />
Romanian system of settlements, Analele Universității din Ora<strong>de</strong>a, Seria Geografie, tom XX, nr. 2/2010, 238-245;<br />
Suditu B. (2009), Urban sprawl and resi<strong>de</strong>ntial mobilities in the Bucharest area – reconfiguration of a new resi<strong>de</strong>ntial<br />
geography, Human geographies, Vol. 3, No. 2, 79-93;<br />
Tacoli Cecilia, (1998), Bridging the divi<strong>de</strong>: Rural-urban Interactions and livelihood Strategies, in International<br />
Institute for Environment and Development (IIED), Sustainable Agriculture and Rural Livelihoods Programme,<br />
Gatekeeper Series, No 77;<br />
Talbot H., Courtney P. (2011), Improved urban-rural linkages as an EU rural <strong>de</strong>velopment policy measure, Regional<br />
Studies Association (RSA) Annual International Conference in Newcastle (17th- 20th April), http://www.regionalstudies-assoc.ac.uk/events/2011/april-newcastle/papers/Talbot.pdf;<br />
*** (1999), European Spatial Development Perspective. Towards Balanced and Sustainable Development of the Territory<br />
of the European Union, Office for Official Publications of the European Communities, Luxembourg;<br />
*** (2011), Territorial Agenda of the European Union 2020. Towards an Inclusive, Smart and Sustainable Europe of<br />
Diverse Regions;<br />
*** (2007), Territorial Agenda of the European Union. Towards a more competitive and sustainable Europe of diverse region;<br />
*** (2008), Green paper on territorial cohesion: turning territorial diversity into strenght;<br />
*** (2000), Lisbon Strategy;<br />
*** National Institute of Statistics.<br />
Submitted: Revised: Accepted and published online<br />
September 02, 2011 November 24, 2011 December 13, 2011
Analele UniversităŃii din Ora<strong>de</strong>a – Seria Geografie Year XXI, no. 2/2011 (December), pp. 323-332<br />
ISSN 1454-2749, E-ISSN 2065-1619 Article no. 212118-539<br />
SPORTS AND LEISURE TIME TOURISM – A WAY OF REVITALISING<br />
EMERGENT SPACES FROM THE METROPOLITAN AREA OF<br />
BUCHAREST<br />
Radu - Daniel PINTILII ∗<br />
University of Bucharets, Faculty of Geography, Interdisciplinary Center for Advanced Researches on Territorial<br />
Dynamics, CICADIT, Bucharest, Romania, e-mail: pinty_ro@yahoo.com<br />
Florentina - Cristina MERCIU<br />
University of Bucharets, Faculty of Geography, Interdisciplinary Center for Advanced Researches on Territorial<br />
Dynamics, CICADIT, Bucharest, Romania, e-mail: krysten1009@yahoo.com<br />
Daniel PEPTENATU<br />
University of Bucharets, Faculty of Geography, Interdisciplinary Center for Advanced Researches on Territorial<br />
Dynamics, CICADIT, Bucharest, Romania, e-mail: peptenatu@yahoo.fr.<br />
Andreea - Loreta CERCLEUX<br />
University of Bucharets, Faculty of Geography, Interdisciplinary Center for Advanced Researches on Territorial<br />
Dynamics, CICADIT, Bucharest, Romania, e-mail: loretacepoiu@yahoo.com<br />
Cristian Constantin DRĂGHICI<br />
University of Bucharets, Faculty of Geography, Interdisciplinary Center for Advanced Researches on Territorial<br />
Dynamics, CICADIT, Bucharest, Romania, e-mail: cristi7772001@yahoo.com<br />
Abstract: The aim of this article is to analyse and present the way new forms of tourism<br />
contour and <strong>de</strong>velop in the metropolitan area of Bucharest. In the last period, a<br />
revitalising and opening of the touristic phenomenon from the metropolitan area of<br />
Bucharest can be noticed, with a special accent on the niche of sports tourism. This form<br />
of tourism, relatively new in our country, tends to become a dominant form of tourism<br />
for a European capital where the possibilities of spending leisure time are somehow<br />
limited for its inhabitants. This fact is emphasized by the increase of the number of<br />
leisure sports centres in the last years (sports clubs for vaulting, golf courses). In<br />
parallel, cultural tourism, which is a form of tourism with tradition for the metropolitan<br />
area of Bucharest, also benefits of favourable conditions. In the second part of the<br />
article, the attention is centred upon the tourists’ profile, comparatively presenting the<br />
two tipologies which present distinct characteristics from the point of view of the socioeconomic<br />
profile, as well as of the touristic motivations, globally.<br />
Key words: urban tourism, recreation spaces, golf tourism, recreation, Romania<br />
* * * * * *<br />
∗ Corresponding Author<br />
http://istgeorelint.uora<strong>de</strong>a.ro/Reviste/Anale/anale.htm
324<br />
Radu-Daniel PINTILII, Florentina-Cristina MERCIU, Daniel PEPTENATU, ...<br />
INTRODUCTION<br />
In the last years, tourism was inclu<strong>de</strong>d in urban policies, becoming a key factor in<br />
explaining several socio-spatial processes of the large towns. The reasons which explain the<br />
presence of tourism in urban strategies, both analytical and applied are diverse. There could be<br />
indicated some of the effects associated with socio-economic transition, urban crisis and the<br />
passing from the fundamentally industrial economy to tertiary economy. The new urban mo<strong>de</strong>l<br />
shows a new hypostasis of towns, respectively that of entertainment centres or „entertainment<br />
machinery” (Lloydy Nichols, 2000 quoted by Diego and Barrada, 2010).<br />
The process of metropolitanisation is different according to predominant opinions<br />
concerning the urban <strong>de</strong>velopment. It is strongly connected with the selection of the services’ and<br />
activities’ concentrations and with social polarization and spatial fragmentation. It is mainly<br />
associated with very big cities (Ionescu and Crenicean, 2009, p. 67).<br />
In this period, a large consuming of space is <strong>de</strong>veloped, usually materialized by the urban<br />
extension beyond the limits of large cities, thus affecting the dimension of agricultural areas and<br />
more, becoming more and more limited. As a result, the quality of the territory and urban<br />
experience, the opportunities of recreation, cultural activities, creativity and innovation, power and<br />
the capacity to influence or to create positive images, became essential elements for success in the<br />
towns’ competition on the world market (Cavuta, 2011).<br />
At present, almost all the cities, or at least the most important ones, nee<strong>de</strong>d to adapt to these<br />
new ten<strong>de</strong>ncies, leading to an intense competition, materialized by the building of a new urban<br />
picture, by cultural innovation projects (shows, festivals), as well as by the building of some<br />
facilities of general or touristic infrastructure (commercial centres, recreation centres, stadiums,<br />
museums and so on) (Diego and Barrada, 2010).<br />
There are many positive examples of recent <strong>de</strong>velopment of sports and recreational tourism<br />
in many countries where until recently this form of tourism trends almost did not exist (Greece,<br />
Poland, Romania, Bulgaria and others) (Vujko and Plavša, 2011, p. 95).<br />
The sport related holiday is a growing segment of tourism and therefore a relevant field of<br />
research (Gibson, 1998 quoted by Barros et al., 2010).<br />
However, in OMT specialists’ opinion, sports tourism is not perceived as a special segment of<br />
the touristic offer, but it is enclosed in the category of touristic motivations as: „leisure time,<br />
relaxing, holiday” (Ciampicacigli and Maresca, 2004 quoted by Iancu and Siddu, 2009, p. 190).<br />
However, sports tourism represents an original product, supposing the integration of its own elements<br />
into recreative touristic activity. Sports tourism is <strong>de</strong>fined as „a trip done in the free time in or<strong>de</strong>r to<br />
practise a sports activity, or as a spectator at different sports events on a <strong>de</strong>termined period (less<br />
than a year) outsi<strong>de</strong> the resi<strong>de</strong>ntial space” (Gibson, 1998 quoted by Iancu and Siddu, 2009, p. 190).<br />
The increase of the free time duration represents a common factor, both for the touristic<br />
activity, and for the sports activity, which contributed to their amplification along the time. The<br />
scale of free time, contents and forms of consumption have direct connection with the<br />
<strong>de</strong>velopment of human personality, with possibilities of satisfying needs of self-realization<br />
(Ratkowski et al., 2010, p. 115).<br />
The relationship between sports and tourism <strong>de</strong>velops based on the positive image of sports,<br />
as a fundamental activity practiced in the free time, reaching new valences, from the simple physical<br />
activity to the competitive character, playful activity and health recovery (Di Marcoet et al., 2004).<br />
The <strong>de</strong>velopment of an area for sports and recreational activities within the sports and<br />
recreational tourism primarily <strong>de</strong>pends on the natural and geographic predisposition of the location<br />
and the affinity of tourists and their fitness and health predisposition (Weed, 2008; Plavša and<br />
Romelić, 2009 cited by Vujko 2011). Sports centres from the analysed space and which have a<br />
recreational role are mostly situated in the field area (The Romanian Plain). Situated in a plain<br />
area, the characteristics of the field, from the altitudinal point of view, but also of its reduced<br />
<strong>de</strong>gree of fragmentation, indicates the suitability for the <strong>de</strong>velopment of golf courses and<br />
equitation fields in the metropolitan area of Bucharest.
Sports and Leisure Time Tourism – A Way of Revitalising Emergent Spaces… 325<br />
Sports activities have a pure recreational role and they are meant to contribute to an<br />
increase of good humour amongst the practitioners (tourists). Is is knows that attracting tourists in<br />
recreational sports activities is based on a strong recreation motivation. The activities practiced are<br />
a way of combating stress and thereby they have positive effects upon health and physical<br />
condition (Vujko and Plavša, 2011, p. 95). An example in this respect is golf, which from the<br />
psychological point of view allows satisfying the tourist’s needs of hyper-stimulation and of<br />
feeling active, as the protagonist of his/ her own holiday, by experiencing his/ her motric abilities.<br />
In numerous cases, in a competition with other players, the <strong>de</strong>sire to win is stronlgy present, thus<br />
being <strong>de</strong>veloped a strong competitive spirit (Perussia 1984 quoted by Iancu and Siddu, 2009, p.<br />
192). Practising golf is an optimal way of combining a dynamic physical activity with relaxation<br />
moments, due to the pleasant natural environment in which the golf game takes place (Neulinger,<br />
1981; Castelli and Guasco, 1984; Ingham, 1986; Perussia, 1989 quoted by Iancu and Siddu, 2009,<br />
p. 192). In its turn, the free time psychology overlaps in certain aspects with sports pshychology,<br />
due to the fact that activities <strong>de</strong>dicated to free time are mostly sports activities (Horn, 1992;<br />
Russel, 1993; Lombardo and Cavalieri, 1994).<br />
METHODOLOGY<br />
The methodology used within this study supposed a combination of specific methods in the<br />
Geography field and the sub-domain of tourism Geography in particular (field displacing, the<br />
mapping of touristic objectives). Also, field displacing was continued by the causal analysis of<br />
spatial distribution of touristic resources in the analysed space. The analysis of the location of<br />
recreation sports centres reflect a ten<strong>de</strong>ncy manifested at world level of localising and rapid<br />
extension around large cities, sustained by intense touristic flows, represented by urban population.<br />
Unlike cultural-historical objectives, whose presence is un<strong>de</strong>r the influence of the historical and/ or<br />
social factors, the location of recreation centres represents a result of a cumulation of factors,<br />
which explains the present socio-economical picture of Bucharest’s influence upon metropolitan<br />
area. The analysis of recreation sports objectives was followed on a larger period of time (2000 -<br />
2010) and it un<strong>de</strong>rlined an accelerated dynamic of building sports centres in the last years around<br />
the first nucleus of localities which surround the capital. The graphical representation was meant to<br />
indicate the expansion of touristic phenomenon/ sports touristic establishments in the nortehn part<br />
of metropolitan narea: the „necklace” of recreation centres, which can be also explained by the<br />
more and more intense and motivated touristic request, with a recreational purpose. Also, the<br />
impact <strong>de</strong>termined by the building of these recreation centres in the spaces where they were<br />
installed was emphasized.<br />
RECREATION PROJECTS BETWEEN DISPUTE AND FAILURE IN THE<br />
METROPOLITAN AREA<br />
Bucharest, as a European capital (a status achieved in January 2007), tends to inscribe on a<br />
new direction of improving its urban image, which from the touristic and cultural point of view is<br />
less visible, compared to other European metropolises. This thing, on the one hand, is due to the<br />
presence of touristic resources with a limited character, but also to the lack of a coherent policy of<br />
conservation and rehabilitation of the inherited patrimony, but also to the complex functions which<br />
the Capital exerts at national level, the latter exceeding in largeness the touristic vocation. This<br />
direction is necessary, on the one hand because of the difficulty of adapting to the new economic<br />
context, marked by the diminution of the industrialization process. At the same time, joining the<br />
European Union represents an action which imposes a change of the way of conceiving the<br />
<strong>de</strong>velopment strategies, in accordance with the directives imposed at European level, the<br />
<strong>de</strong>velopment of services and last but not least the accomplishment of some projects of urban<br />
renovation, with direct and indirect effects for tourism being primary.
326<br />
Radu-Daniel PINTILII, Florentina-Cristina MERCIU, Daniel PEPTENATU, ...<br />
On the other hand, these actions are meant to contribute to the improvement of urban<br />
image, with the aim of becoming an attractive town for tourists, in this respect being started<br />
actions of building some new elements of infrastructure for tourism.<br />
The transformation of touristic type is unfol<strong>de</strong>d in parallel with those of the process of<br />
urbanisation of the territory adjacent to the capital-city, reflected by the externalisation of the<br />
forms of touristic arrangement in the metropolitan area. The ten<strong>de</strong>ncy reflects the normal course of<br />
the post-mo<strong>de</strong>rn evolution of the town, by the alignment to the mo<strong>de</strong>ls from the occi<strong>de</strong>ntal<br />
countries and their adapting to local conditions in a more or less coherent manner: the failed try to<br />
create a recreation park of large dimensions nearby Bucharest (Dracula Park). The problem of the<br />
achievement of this wi<strong>de</strong> range project faced a series of critics, which are either connected to the<br />
lack of a fundament, which should lead to the historical and cultural symbolics, or to choosing an<br />
inappropriate location. Therefore, the project of creating the theme park „Dracula” around<br />
Bucharest, still from its launching as i<strong>de</strong>a, created a lively <strong>de</strong>bate, which generated the discussing<br />
of the character of inefficiency, as well as of its location (the establishing of the location nearby<br />
Bucharest would have taken the famous story of prince Dracula out from the historical context)<br />
and thus the project entered the phase of <strong>de</strong>cline before it was started. The attempt to organise this<br />
space, with a recreation role, produced contradictory results, as it inscribes on the line of<br />
producing some stereotypes, which would have as an effect losing the cultural-historical i<strong>de</strong>ntity<br />
of the country, transposed in the consciousness of foreign tourists by the story of prince Dracula.<br />
The only connection with the city’s history is connected to associating the reign court established<br />
in Bucharest by the prince Vlad łepeş, as well as of the document of attesting the capital city,<br />
which had the prince’s seal.<br />
THE PARTICULARITIES OF RECREATIONAL TOURISM IN THE<br />
METROPOLITAN AREA OF BUCHAREST<br />
The <strong>de</strong>velopment of large cities supposes services’ externalisation, usually in the areas of<br />
influence, a fact which is noticed in case of the territory adjacent to Bucharest, too. Services<br />
externalisation presents a larger extension in the North and West part of the capital, within which<br />
commercial services prevail (Cepoiu, 2009). In the assembly of services <strong>de</strong>veloped in the influence<br />
area of the capital, in the last years there are to be mentioned especially touristic services, as they<br />
are often represented by the organising of some recreation spaces (Pintilii et al., 2010).<br />
Recreation spaces from the influence areas of towns are a continuation of those from insi<strong>de</strong><br />
the towns, most of the times. This fact is due, on the one hand, to the lack of space insi<strong>de</strong> the urban<br />
centre, recreation spaces being usually in accordance with their size. In the metropolitan zone there<br />
are areas with characteristics which allow the transformation of these spaces into recreation areas:<br />
more reduced values of pollution, landscapes less affected by anthropisation. The localising and<br />
organising of sports fields with a recreational role around the capital are conditioned by economic<br />
factors, too: more reduced costs of the lands in this area.<br />
For the inhabitants from large cities, characterised by agglomeration and pollution, touristic<br />
experience is important, as it represents a form of evadation from the urban space, strongly<br />
industrialised and with a limited offer regarding the recreation possibilities or a pleasant ambient.<br />
This area tends to be <strong>de</strong>dicated to tourism in a greater and greater measure, offering<br />
possibilities of using directly or indirectly specialised workpower.<br />
Although touristic activities were not <strong>de</strong>terminant in the metropolitan area up to present,<br />
these occupied an important place among the services <strong>de</strong>veloped in the last years. Tourism<br />
<strong>de</strong>velopment in the metropolitan area of Bucharest, as a result of attracting a larger and larger<br />
number of tourists, may <strong>de</strong>termine a touristic specialising of the territory, representing, at the same<br />
time, a form of expressing the process of urban regeneration by leisure activities, which are named<br />
in the specialised literature as „industrialisation of leisure time” (Brenda-Vázque et al., 2001) or<br />
as „places to play” (Sheller and Urry, 2004). Thus, these territories circumscribed to metropolitan<br />
area will become attractive for tourists, at least from the recreational point of view.
Sports and Leisure Time Tourism – A Way of Revitalising Emergent Spaces… 327<br />
But it can be noticed that the ten<strong>de</strong>ncy of building sports fields in the metropolitan area of<br />
Bucharest is not recent (the sports centre from Snagov was created long ago, or the creation in<br />
1925 of the first golf course in the country, at Băneasa, at the initiative of the business man colonel<br />
Grabell). It is also noticed that in the last years, an exponential increase of the sports fields in the<br />
metropolitan area of Bucharest city at the level of several types of sports activities (the number of<br />
horse racing centres doubled in the last years). Another characteristic of the present period, as<br />
regards the dynamic of sports centres in the metropolitan area of Bucharest is connected to the<br />
apparition of sports golf courses, an action of touristic entrepreneurship, which distinguishes by<br />
large investments flows and attractiveness for an important number of tourists. At the same time,<br />
obvious hallmarks in the territory are generated: the golf courses are ususally of large dimensions<br />
and they present at the same time a series of arrangements which reshape the original relief, thus<br />
obvioulsy marking the territory, from the touristic point of view.<br />
The building of recreation spaces also <strong>de</strong>termined a dynamic of building structures of<br />
touristic welcoming.<br />
Golf tourism<br />
Practising the touristic sports activities is in relation with the preference of spending the<br />
free time in a pleasant way in open recreation spaces, evading from the agglomerated urban space<br />
for a few hours or during the week-end. The touristic potential in general, but the weekend' s in<br />
particular, situated in the metropolitan area of Bucharest raises by the dominant anthopic features,<br />
diminunishing the natural ones (Pintilii et al., 2010).<br />
Golf courses represent, lately, a<br />
special extension at the level of the<br />
analysed space, which reflects by the<br />
action arranging some recreation areas<br />
within resi<strong>de</strong>ncial complexes built in the<br />
last years in the localities around<br />
Bucharest. These are frequented mostly<br />
by the capital’s inhabitants. Building the<br />
recreation touristic establishments is an<br />
occasion to <strong>de</strong>velop the metropolitan area<br />
from the touristic point of view. This<br />
process permitted the <strong>de</strong>velopment of<br />
some poles of recreational interest.<br />
Although the ol<strong>de</strong>st golf course was<br />
established in Bucharest at the Diplomatic<br />
Club, still it presents a limitation which<br />
impe<strong>de</strong>s the practicing of this sport by<br />
professionals (the golf course has got a<br />
limited surface).<br />
In the last years, there is a more and<br />
more accentuated ten<strong>de</strong>ncy of building<br />
golf courses in the metropolitan area of the<br />
capital, from among the most recent<br />
mentioning the golf course from Tunari<br />
and the Complex Golf & Country Club<br />
Bucharest situated at 5 km distance from<br />
Figure 1. The map of recreational centers situated in<br />
the capital, between Chitila and Buftea, in<br />
the metropolitan area of Bucharest<br />
the commune Zurbaua (figure 1). The<br />
latter has an impressive length (6,350 m),<br />
consisting of golf courses with different <strong>de</strong>grees of difficulty, also presenting water obstacles and
328<br />
Radu-Daniel PINTILII, Florentina-Cristina MERCIU, Daniel PEPTENATU, ...<br />
sand bunkers 1 . These elements confer particularity to the golf course, which supposes running<br />
through a challenging route, even for the experienced golf practitioners. This kind of<br />
establishments are built in or<strong>de</strong>r to create a high difficulty for the golf courses, this being the<br />
extremely attractive element for those with experience and who are motivated for coming again,<br />
also representing the motivation to try new golf courses in other countries, too. Flat golf courses<br />
are used by the beginners.<br />
Due to the special characteristics of the golf course, the complex may receive international<br />
tours, in which professional golf players can participate. The golf courses and the club quarter<br />
occupy half of its surface (approximately 3,500 m).<br />
The investment of approximately 7 million euros was financed by a Swiss firm in<br />
partnership with Romanian entrepreneurs. The complex is ma<strong>de</strong> up of 3 distinct parts: a<br />
professional golf course of 18 pathways (baskets / bowls) for professionals, a course of 6<br />
pathways, meant for those who want to practise, as well as for those less experimented; a<br />
resi<strong>de</strong>ntial area with 240 - 300 units for accommodation (apartments, single-family houses, villas)<br />
of superior confort, with a unique location and with view directly to the golf courses and partly to<br />
the Buftea forest. The offer is completed by a 4 stars hotel, grounds and a tennis court, a<br />
restaurant, a bar, a lounge, conference halls and commercial surfaces (not only connected to golf)<br />
etc. The association of recreational factor with accommodation services and meals’ serving<br />
represents a frequent practice at international level, achieved with the purpose of facilitating the<br />
continuation of the tourists’ stay, especially as at the golf centres’ level there are frequently<br />
organized sports contests with duration of 2 or 3 days 2 .<br />
There can be also mentioned two projects, which have as main objective the organizing of<br />
two golf courses at Snagov, as well as in Giurgiu county (Greaca commune), projects which need<br />
the creation of some public-private partnerships, as they impose two conditions: courses with a<br />
large spatial extension and high financial investments.<br />
It must be also mentioned that business tourism associates with golf tourism. This<br />
continuation, in touristic-recreational plan, of the business activity, represents an appropriate way<br />
to establish a climate favourable for collaboration between business partners. Thus, it can be<br />
explained the presence, not casual at all, of the structures of touristic welcoming. The presence of a<br />
golf playing tourist generates a stay of 3 or 4 days for foreign tourists. In case of national tourists,<br />
the practicing of this sport can be achieved both during the week and during the weekend. The<br />
relatively large period of the stay is also explained by the golf courses which can take place during<br />
several days. This allows the golf player to dispose of free time to visit the attractions of the<br />
touristic <strong>de</strong>stination.<br />
Golf is inclu<strong>de</strong>d among the sports which need high costs regarding the field rent and/or the<br />
game instruments, to which the costs for accommodation, meals and the entrances to the cultural<br />
objectives add. All these lead to an increase of the total costs of the stay (Iancu and Siddu, 2009).<br />
Equestrian tourism<br />
Although the first equitation clubs opened nearby the capital (the Club of Equitation<br />
Bucharest 1994 and Ecvalahid in 1998), the ten<strong>de</strong>ncy in the filed of recreational equitation was to<br />
draw away from the big cities and to build a recreation offer which will enclose the pleasure to ri<strong>de</strong>,<br />
recently associated to agrotourism, too. Also, a doubling of the number of vaulting clubs in the last<br />
years can be noticed, these being built around the capital or at relatively small distances from it<br />
(figure 1). At the level of the metropolitan area of Bucharest, most of the stud farms are private 3 :<br />
- Corbeanca CS Hipocan with a number of 50 - 70 horses with mo<strong>de</strong>rn facilities for horse<br />
treatment and sports club;<br />
1 www.golf-bucharest.ro/doc/Comunicat<strong>de</strong>Presa.pdf<br />
2 http://www.golflifestyle.ro/ro/articol/25-Country-Club-Baneasa-Primul-teren-<strong>de</strong>-18-cupe-din-Rom%C3%A2nia<br />
3<br />
www.ecvestra.ro/cluburi
Sports and Leisure Time Tourism – A Way of Revitalising Emergent Spaces… 329<br />
- Otopeni: sports club Tracus Transilvania Magna cu 15 - 20 <strong>de</strong> cai;<br />
- Snagov: sports club Arkadia Horse with 20 - 25 horses;<br />
- Mogoşoaia has a school with the title of Equestrian Aca<strong>de</strong>my, sports clubs;<br />
- Dor Mărunt (Călăraşi county);<br />
- Jegălia (IalomiŃa county) - administered by Romsilva;<br />
- Buftea CS Ca<strong>de</strong>nŃa;<br />
- Ostratu CS HipicHolandia;<br />
- CS Piccadilly between the localities Săftica and Tâncăbeşti;<br />
- Ciofliceni: sports club Asil Horse Farm;<br />
- Ciorogârla: CS Hipic;<br />
- Domneşti: CE Agrointernational.<br />
At the same time, in the metropolitan area of Bucharest it can be noticed the touristic<br />
<strong>de</strong>velopment of the elements of architectural heritage, by their arrangement as spaces of receiving<br />
some events related to tourism (cocktails with the occasion of business meetings, conferences).<br />
Also, arrangements were done for the practicing of different sports activities, as tennis and horse<br />
riding. In this respect, it can be mentioned the Stirbey domain from Buftea, which rents the rooms<br />
insi<strong>de</strong> the establishment for different corporate events (business meetings, dinners, training, indoor<br />
and outdoor team-building) and private events (receptions, parties, balls, conferences, seminars,<br />
workshops). Also, the possibility of practicing equestrian tourism is offered, a spacial alley for<br />
riding being arranged in this purpose. The alley has got approximately 700 metres, by the<br />
riversi<strong>de</strong>, but for this purpose there can be also used the winding alleys of the park. For children,<br />
there are recreation areas with animals (ponies’ enclosures).<br />
Figure 2. Area for equestrian tourism – Stirbey<br />
Domain<br />
Figure 3 Mogoşoaia lake and nautical sport<br />
arrangements<br />
The practicing of equestrian tourism, as a form of touristic recreation, supposes several<br />
requests, which start from the way of selecting and breeding caballines, up to the organising of<br />
specific tourist activities.<br />
In this respect, there can be mentioned the following activities which attract an important<br />
number of internal and external tourists (Simon, 2008, p. 373):<br />
- promena<strong>de</strong>s at a slow pace and/ or gallop walks;<br />
- resistance contest with the horse or with a team of horses;<br />
- medium and small mammals’ hunting with the help of the horses;<br />
- walkings by sledge, cart and carriages dragged by horses;<br />
- para<strong>de</strong> and circus shows;
330<br />
Radu-Daniel PINTILII, Florentina-Cristina MERCIU, Daniel PEPTENATU, ...<br />
- contests of <strong>de</strong>rby type, which inclu<strong>de</strong> obstacles, manege, gallop, trotting;<br />
- continental (European) and world championships;<br />
- etological equitation with a therapy role.<br />
The <strong>de</strong>velopment of vaulting centres has the purpose to diversify the forms of sports<br />
tourism, <strong>de</strong>veloping local touristic resources, too.<br />
Nautical tourism<br />
One of the ol<strong>de</strong>st sports clubs for natation form the influence area of the capital was built at<br />
Snagov, thus putting into value the presence of the natural lake with the same name. The natural<br />
lake Snagov has a length of 13 km and it occupies a surface of 570 hectares, being built for the<br />
practicing of nautical sports, recreation walkings and fishing, too.<br />
The establishing of the sports club represented a large scale action, represented by the<br />
building of an olympic base of swimming for canoeing. Between 1935 and 1936 there are<br />
mentioned canoeing courses on the Snagov Lake, organised by the Sports Club Rapid.<br />
Subsequently, the olympic base was used for recreation activities, too.<br />
Because Snagov represents one of the most known recreation oases around the capital, on the<br />
one hand for the priviledged position (only a few kilometres distance), but also for the forms of<br />
recreation it offers, a local tourism agency offers the possibility to accomplish the Snagov circuit during<br />
the week-end in the summer, for one day (on Saturday or on Sunday), leaving from Bucharest. It is also<br />
inclu<strong>de</strong>d the guiding for the entire journey. Snagov’s circuit consists of two journeys:<br />
- Blue Journey (on the lake) by boat<br />
- Red Journey (on the road) by Titicar. This means of transport is very smart, ma<strong>de</strong> up of<br />
one wagon of small dimensions (18 seats) dragged by a tractor. The road journey has the main aim<br />
to visit the cultural touristic attractions from Snagov organised on 3 differemt routes 4 . In Snagov it<br />
was also <strong>de</strong>veloped a fishery complex (the pond from Tâncăbeşti), being divi<strong>de</strong>d into two basins<br />
for professional fishermen and the second for amateur fishermen.<br />
The Mogoşoaia Lake was anthropically arranged for different recreational activities.<br />
In Otopeni there were proposed works for building a Sports Complex, which will comprise<br />
three competitional swimming basins, two olympic basins and a polo basin, to which other three<br />
public swimming basins for practicing and recreation add. Its building is envisaged to finish this<br />
year, and the sports complex will represent the main sports base of swimming in the country. One<br />
of the economic effects generated by the building of the sports complex is to ensure the population<br />
access to facilities for practicing sports. This complex is part of a larger project which contains: a<br />
multi-valent concourse with approximately 5,400 seats, a hotel, and several commercial spaces<br />
with sport <strong>de</strong>stination. The natation sports complex from Otopeni is about to be accomplished by<br />
the programme „Swimming basins” achieved by the National Campaign of Investments „C.N.I.” –<br />
S.A, <strong>de</strong>veloped by the Ministry of Public Works and Settlements, at present the Ministry of<br />
Regional Development and Tourism 5 .<br />
THE TYPOLOGY OF SPORTS TOURIST<br />
The new forms of anthropic touristic attractions from the influence area come in contrast<br />
with cultural attractions whose age confers them special attributes. At the same time, the two types<br />
of anthropic touristic attractions share the mass of tourists in two distinct categories, both as socioeconomic<br />
profile, and from the point of view of touristic motivations.<br />
In case of touristic attractions with a recreational role (sports establishments: swimming bases,<br />
sports centres of vaulting, golf clubs), the touristic request presents a series of distinctive attributes:<br />
there are usually middle aged persons, with high financial possibilities (sports recreational<br />
4 www.snagov.ro<br />
5<br />
www.mdrl.ro/_documente/transparenta/consultari_publice/consultare71/nf.pdf
Sports and Leisure Time Tourism – A Way of Revitalising Emergent Spaces… 331<br />
establishments mentioned, except for the swimming basins, suppose the allocation of important<br />
financial resources, especially as it is necessary to rent the instruments useful for practicing sports).<br />
Sports tourism itself presents un<strong>de</strong>r three forms, generating varied types of tourists<br />
(Ciampicacigli and Maresca, 2004; Gibson, 1998 quoted by Iancu and Siddu, 2009): „leisure<br />
sports tourism” or „active sport tourism referring to people who travel to take part in a sport<br />
event sport tourism” which refers to people who travel to watch a sporting event and „nostalgia<br />
sport tourism” which inclu<strong>de</strong>s visits to sports museums or stadiums.<br />
It is appreciated that the dynamic of touristic population shaped on sports tourism will<br />
intensify once the intense promotion and their extension in the territory, the increase being due to<br />
international arrivals, as this category of touristic request is much better informed and they<br />
frequent more largely the forms of tourism with a recreation role.<br />
In case of cultural tourism, whose attractions are represented by the diversity of culturalhistorical<br />
and religious objectives, it addresses a special category of the touristic request, usually to<br />
young tourists (including children), but also to middle age persons attacted by the history and<br />
culture of the capital’s area and its surroundings. Numerous historical events related to the capital<br />
and its lea<strong>de</strong>rs hallmarked the space around it (the Palace from Mogosoaia – the summer resi<strong>de</strong>nce<br />
of the ruler Constantin Brâncoveanu, the Ştirbey Palace). The segment of tourists which practice<br />
cultural tourism is <strong>de</strong>fined by a series of specific attributes: lower and average incomes, numerous<br />
flows in certain time intervals, having as main motivation the <strong>de</strong>sire of knowledge.<br />
Besi<strong>de</strong>s cultural-historical ojectives, there are the religious objectives, able to generate<br />
touristic flows, attracted by other touristic motivations and they present a dynamic which varies in<br />
time, being more intense with the occassion of religious holidays. At the same time, these<br />
resources from the metropolitan area were brought into the public’s attention and into the attention<br />
of potential visitors by the insistence upon the cultural image, promoted by media, but also printed<br />
forms of promotion, as leaflets, which emphasized the programme of the public transport courses<br />
in or<strong>de</strong>r to provi<strong>de</strong> access to religious objectives, as they are representative for the metropolitan<br />
area of Bucharest (the monasteries Cernica, Pasărea).<br />
Although both types of touristic resources belong to the category of anthropic attractions,<br />
still they differ by the touristic movements they generate, different as duration: in case of sportsrecreational<br />
tourism, the journeys/ stays can be both during the week and in the week-end.<br />
CONCLUSIONS<br />
Sports tourism supposes the excursion is subordinated to accomplishing a sports<br />
experience, the holiday place being i<strong>de</strong>ntified with the space where the favourite sport will be<br />
practiced. We can assert that sport has become a universal behaviour of recreative life.<br />
The establishment of sports fields with recreational role nearby the capital city is the result<br />
of the adapting to the West European touristic mo<strong>de</strong>l, but it is at the same time the result of some<br />
economic factors: the costs of fields are more rduced in the nearby territory of the town. On the<br />
other hand, metropolitan areas of large cities present a series of advantages: large surfaces of<br />
ground, suitable for being arranged/ organised as recreation spaces, landscapes unaffected by<br />
pollution or by the process of excessive urbanisation. At the same time, the organising of open-air<br />
recreational spaces needs large surface, big cities presenting the disadvantage of their absence in<br />
their interior. The placing of recreation centres in the influence areas presents an advantage from<br />
the perspective of the power to attract the population from the urban centres localised at small<br />
distance, which represent the main source of touristic circulation, motivated to escape in the free<br />
time outsi<strong>de</strong> the urban space which is „suffocating”.<br />
Sports tourism is an activity practiced at large scale at world level, whose touristic rquest is<br />
growing, becoming an important segment of the present tourtistic market.<br />
The tourism from the metropolitan area of Bucharest presents a new and distinct mo<strong>de</strong>l<br />
compared to urban tourism, <strong>de</strong>veloped insi<strong>de</strong> the city, which is different as motivations,<br />
dynamic, duration and costs.
332<br />
Radu-Daniel PINTILII, Florentina-Cristina MERCIU, Daniel PEPTENATU, ...<br />
ACKNOWLEDGEMENTS<br />
The methodology used in this article was elaborated within some research projects: the<br />
strategic grant POSDRU/89/1.5/S/58852, Project „Postdoctoral programme for training scientific<br />
researchers” cofinanced by the European Social Fund within the Sectoral Operational Program<br />
Human Resources Development 2007 - 2013 and Territorial Management Based on Growth Poles’<br />
Theory (UEFICSU-PNII-I<strong>de</strong>i, 1950).<br />
REFERENCES<br />
Barros C. P., Butler R., Correia A. (2010), The length of stay of golf tourism:a survival analysis, in Tourism Management, 31, 13-21;<br />
Brenda-Vázquez I., Conceição P., Batista Luisa, Branco-Teixeira M. (2001), Evaluation of the effects of urban<br />
improvement programmes: methodological contributions, Conference Area-bases initiatives in contenporany<br />
urban policy, Danish Building and Urban Research and European Urban Research Association, Copenhagen,<br />
available at www.sbi.dk/eura/workshops/papers/workshop6/breda.pdf, accesed on 27.01.2011;<br />
Cavuta G. (2011), Tourism in Pescara (Italy): competitiveness and attractivity, in GeoJournal of Tourism and Geosites,<br />
Year IV, no. 1, vol. 7, 63-74;<br />
Cepoiu Loreta (2009), Rolul activităŃilor industriale în <strong>de</strong>zvoltarea aşezărilor din spaŃiul metropolitan al Bucureştilor,<br />
Editura Universitară, Bucureşti;<br />
Di Marco, M., D’Intino G., Oronzo S. (2004), Manuale <strong>de</strong>l turismo sportivo, Editore Franco Angeli, Milano;<br />
Diego A., Barrado Timón (2010), Big city and tourism in the post-industrial transition: new and old processes, new and<br />
old theories. The case study of metropolitana rea of Madrid, in Scripta Nova- Revista Electronica <strong>de</strong> Geografia y<br />
ciencias sociales, vol. 14, Issue 317;<br />
Horn Thelma S. (1992), Advances in sport psychology, Champaign IL: Human Kinetics Publishers;<br />
Iancu Florentina-Cristina, Siddu F. (2009), Golf as a link between tourism and sports. Case study: the Ugolino golf club –<br />
Florence (Tuscany, Italy), in Annals of the University of Craiova, Series Geography, Universitaria Publishing<br />
House, Craiova, XII, 97-106;<br />
Ionescu I., Crenicean LuminiŃa (2009), Present and perspectives in tourist evolution of the urban, suburban and metropolitan<br />
areas, in Bulletin Petroleum – Gas University of Ploieşti, Economics Science Series, LXI, no. 3, 67-79;<br />
Lombardo G.P., Cavalieri P. (1994), Psicologia <strong>de</strong>lla personalità nello sport: Mo<strong>de</strong>lli <strong>de</strong>lla ricerca e <strong>de</strong>ll’intervento,<br />
Nuova Italia Scientifica, Roma;<br />
Pintilii R. D., Peptenatu D., Drăghici C., Schvab A. (2010), Weekend tourism as an instrument of local <strong>de</strong>velopment, in<br />
GeoJournal of Tourism and Geosites, Years III, no. 1, vol. 5, 44-51;<br />
Ratkowski W., Łapian T., Szumilewicz Anna (2011), Sport-recreational infrastructure of Sopot, in GeoJournal of Tourism<br />
and Geosites, Year IV no. 1, vol. 7, 115-121;<br />
Sheller Mimi, Urry J. (2004), Tourism mobilities, places to play, places in play, Routledge, New York;<br />
Simon Tamara (2008), Turismul ecvestru în România, in Comunicări <strong>de</strong> Geografie, vol. XII, University of Bucharest Press,<br />
Bucharest, 369-374;<br />
Vujko A., Plavša J. (2011), Opportunities for the <strong>de</strong>velopment of paintball as part of sports recreational and anti-stress tourism<br />
in Fruška Gora Mountains (Serbia), in GeoJournal of Tourism and Geosites, Year IV no. 1, vol. 7, 95-106;<br />
http://www.golflifestyle.ro/ro/articol/25-Country-Club-Baneasa-Primul-teren-<strong>de</strong>-18-cupe-din-Rom%C3%A2nia<br />
www.ecvestra.ro/cluburi<br />
www.golf-bucharest.ro/doc/Comunicat<strong>de</strong>Presa.pdf<br />
www.mdrl.ro/_documente/transparenta/consultari_publice/consultare71/nf.pdf<br />
www.snagov.ro<br />
Submitted: Revised: Accepted and published online<br />
July 02, 2011 September 13, 2011 November 16, 2011
Analele UniversităŃii din Ora<strong>de</strong>a – Seria Geografie Year XXI, no. 2/2011 (December), pp. 333-339<br />
ISSN 1454-2749, E-ISSN 2065-1619 Article no. 212119-546<br />
INTERNAL TOURISM MOVEMENT AND THE MAIN ROMANIAN<br />
TOURIST DESTINATIONS (THE PERIOD 1990 - 2008)<br />
Alexandru ILIEŞ ∗<br />
University of Ora<strong>de</strong>a, Department of Geography, Tourism and Territorial Planning – TSAC,<br />
1 University St., 410087, Ora<strong>de</strong>a, Romania / University of Gdansk, Department of Geography and<br />
Regional Development, 4 Bazynskiego st., 80-952 Gdansk, Poland, e-mail: ilies@uora<strong>de</strong>a.ro<br />
Dorina Camelia ILIEŞ<br />
University of Ora<strong>de</strong>a, Department of Geography, Tourism and Territorial Planning – TSAC,<br />
1 University St., 410087, Ora<strong>de</strong>a, Romania, e-mail: iliesdorina@yahoo.com<br />
Cezar MORAR<br />
University of Ora<strong>de</strong>a, Department of Geography, Tourism and Territorial Planning – TSAC,<br />
1 University St., 410087, Ora<strong>de</strong>a, Romania, e-mail: cezarmorar@yahoo.com<br />
Ioana JOSAN<br />
University of Ora<strong>de</strong>a, Department of Geography, Tourism and Territorial Planning – TSAC,<br />
1 University St., 410087, Ora<strong>de</strong>a, Romania, e-mail: ioanajosan@yahoo.co.uk<br />
Abstract: The Romanian political space at the turn of 2nd and 3rd millenniums experienced<br />
systemic-structural mutations marked by <strong>de</strong>ep political regime changes, by the replacement of<br />
the Socialist „planned” economy with the market economy and especially by diversifying the<br />
area of population mobility within Romania. This study, through analysis of the quantitative<br />
and qualitative elements outlines the state of Romanian tourism by the tourism movement.<br />
There are consi<strong>de</strong>red the main tourist streams consisting of Romanian and foreign tourists<br />
registered in the establishments with tourists' accommodation functions in the period 1990-<br />
2008, by the structure, direction and volume to the main Romanian tourist <strong>de</strong>stinations.<br />
Political, psychological, technical and economic thresholds are relevant in this study for the<br />
domestic and international tourism in post-Communist period.<br />
Key words: Romania, tourism, tourist flows, domestic tourism, tourist <strong>de</strong>stination<br />
* * * * * *<br />
INTRODUCTION<br />
In terms of tourism potential the political-territorial Romanian system can be appreciated that<br />
it is constituted of many complex elements, varied, with unique, inedit and spectacular attributes. The<br />
shape of the tourist flows, the direction and structure are <strong>de</strong>termined by the quality of tourism offer<br />
proposed. From this point of view, Romania is among the countries that have a remarkable potential,<br />
not enough capitalized, with a living rural world, anchored in many places in an archaic way of life,<br />
traditionalist and whose priceless value is expected to be consi<strong>de</strong>red and a<strong>de</strong>quately capitalized. If in<br />
the mo<strong>de</strong>rnized world of the Western and Central Europe, the rural and urban differences are<br />
∗ Corresponding author<br />
http://istgeorelint.uora<strong>de</strong>a.ro/Reviste/Anale/anale.htm
334<br />
Alexandru ILIEŞ, Dorina Camelia ILIEŞ, Cezar MORAR, Ioana JOSAN<br />
insignificant, the Romanian rural tourism for example features original actors and structures, real and<br />
invaluable. This study consi<strong>de</strong>rs the tourist flows of Romanian and foreign tourists officially<br />
registered in the establishments of tourists' accommodation functions, who have been accommodated<br />
for at least one night. Tourist flows are measurable and contribute substantially to <strong>de</strong>fine the real<br />
tourist function of the economy for a territorial political (sub)system.<br />
THE CONCEPTUAL AND METHODOLOGICAL FRAME<br />
The survey is based on the information and data from field trips and from official statistical<br />
sources. By using verified tools in the literature (Wall, 1993; Williams, 1998; Hall, 2000; Ianoş,<br />
2000; Cocean, 2005; Veal, 2006; Ilieş et al., 2008) we analyze the optimal management<br />
parameters and the quantitative and qualitative characteristics generated by the volume and the<br />
dynamics of the domestic and international tourist flows. Using specific statistical methods,<br />
analytical and mapping tools we will obtain answers to so called „triple” questions where?, why?<br />
and how? (Ilieş et al., 2012) in or<strong>de</strong>r to i<strong>de</strong>ntify the factors that <strong>de</strong>termined the amount and sense<br />
of mobility and its effects on the Romanian tourism system. There are analyzed the quantitative<br />
and qualitative parameters that structure and size the internal tourist flows by the number of<br />
Romanian and foreign tourists and the major tourist <strong>de</strong>stination areas.<br />
The proposed approach logic is based on flexibility - a key concept in territorial planning<br />
(Cunha, 1998; Gunn and Var, 2002; Cân<strong>de</strong>a et al., 2003; Cocean, 2005; Ilieş, 2007; Ciangă and<br />
Dezsi, 2007, p. 26; Muntele and Iatu, 2007), while in the territorial and political systems the<br />
typology of planning is based on the systemic plan (Williams, 1998; p. 127 - 129; Martinez, 1994;<br />
Ianoş, 2000; Cocean, 2005) where the change of an element disrupts the entire system, requiring as<br />
fundamental method <strong>de</strong>coding the structure and un<strong>de</strong>rstanding its operation (Ianoş, 2000). Thus,<br />
the inter<strong>de</strong>pen<strong>de</strong>nce of the four key elements: space and time as an ongoing basis, activities and<br />
communication as tools for action and dissemination, generate gui<strong>de</strong>lines in elaboration of<br />
territorial <strong>de</strong>velopment mo<strong>de</strong>ls system of turistification (Cazelais et al., 2000), that has the ability<br />
of being implemented at different scales, aimed at different hierarchical levels of intervention from<br />
local, regional, to international ones (Dinu, 2002; Williams, 2006; Lew et al., 2008).<br />
DIAGNOSTIC ANALYSIS AND RESULTS. QUANTITATIVE AND<br />
QUALITATIVE SPECIFIC TOURIST FLOWS PARAMETERS<br />
Evaluation of the quantitative and<br />
qualitative components of a territorialpolitical<br />
system is mo<strong>de</strong>led at local and<br />
regional levels by the tourist flows by the<br />
inter-<strong>de</strong>pen<strong>de</strong>ncies relations between them<br />
and by the natural and anthropogenic<br />
<strong>de</strong>terminants.<br />
The particular configuration of the<br />
tourist flows is based on (Ilieş et al.,<br />
2012): the absolute and relative<br />
Figure 1. Tourist flow according with official<br />
registration at tourist <strong>de</strong>stination areas<br />
geographical position, the morphological<br />
characteristics of the relief, accessibility,<br />
the communication system, the specific<br />
quantitative, qualitative and structural of the human resource, the economic <strong>de</strong>velopment<br />
level, socio-economic and political conditions etc. In terms of structure, the Romanian tourist<br />
flows inclu<strong>de</strong>s two categories (figures 1 and 3): those who use the official accommodation<br />
infrastructure and those who are not registered in such structures, using accommodation from<br />
friends, relatives or acquaintances.<br />
These situations generate for example differences between the flow of foreign tourists who<br />
are registered with the entry in Romania and those who use specific accommodation infrastructure. In
Internal Tourism Movement and the Main Romanian Tourist… 335<br />
terms of economic efficiency for the hospitality and tourism industry, an important role for the<br />
domestic and international tourists it is played by those who use at least for one night the<br />
accommodation infrastructure. Also, an important role in <strong>de</strong>termining the size, orientation and<br />
structure of tourist flows it is played by the quality and diversity of the tourist offer.<br />
The tourist flow consi<strong>de</strong>ring the number of arrivals in tourist accommodation<br />
This chapter consi<strong>de</strong>rs the tourist flow registered in the accommodation units that can<br />
generate a greater economic efficiency. There are analyzed the quantitative and qualitative<br />
parameters that structure and size the internal tourist flows by the number of Romanian and foreign<br />
tourists. In the Romanian political space in the last 20 years there have been significant changes<br />
quantitatively and structurally <strong>de</strong>termined on the one hand, by the accommodation diversification<br />
from 6 types in 1985 to currently 13 types, plus the increase of the <strong>de</strong>gree of comfort. Twenty years<br />
after the fall of Socialism, the Romanian tourism has values still below those recor<strong>de</strong>d in the last<br />
years of that period. Thus, in the interval 1985 - 1989, consi<strong>de</strong>red the last „five of the Socialist<br />
planned economy” it was registered a slow increase in the number of registered tourist<br />
accommodation from 11.959 million to 12.971 million people people (Romanian tourism peak year).<br />
The following period has <strong>de</strong>creased continuously (figure 2) reaching a minimum of less than 5<br />
million tourists in the range 2000 to 2002 (4.847 million people in 2002, figure 2). This occurred on<br />
the background of gradually introducing the visa system and of reducing the enthusiasm and<br />
curiosity of foreigners especially for the ex-socialist Romanian space. The NATO and EU accession<br />
perspective, the increase in trust and confi<strong>de</strong>nce in the Romanian tourist areas correlated with the<br />
economic growth have stimulated the quantitative and qualitative reorganization and resizing of the<br />
tourist flows <strong>de</strong>termined by the recording numbers in the establishments of tourist accommodation.<br />
Thus, since 2003 the number of tourists registered an upward trend, but not as expected. In 2008,<br />
their number reached only 7.125 million people, a value to just over half of the year 1990 (12.297<br />
million). The domestic tourist flow <strong>de</strong>termined on the base of entries and records in the<br />
establishments of tourists' accommodation consists of two categories by the area of origin:<br />
Romanian and foreigners (figure 2), which generates an internal and international flow.<br />
11500<br />
11000<br />
10500<br />
10000<br />
9500<br />
9000<br />
8500<br />
8000<br />
7500<br />
7000<br />
6500<br />
6000<br />
5500<br />
5000<br />
4500<br />
4000<br />
3500<br />
3000<br />
2500<br />
2000<br />
1500<br />
1000<br />
500<br />
0<br />
number of arriv als (thou)<br />
Romanian Tourists<br />
Foreign Tourists<br />
1990<br />
1991<br />
1992<br />
1993<br />
1994<br />
1995<br />
1996<br />
1997<br />
1998<br />
1999<br />
2000<br />
2001<br />
2002<br />
2003<br />
2004<br />
2005<br />
2006<br />
2007<br />
2008<br />
Figure 2. Romania. The tourist flow consi<strong>de</strong>ring the number of arrivals<br />
(Romanians and foreigners) in tourist accommodation in period 1990 - 2008<br />
(Data sources: Romanian National Institute of Statistics, 2010; www.insee.ro)<br />
In this i<strong>de</strong>a, the size of international tourist flow consisting of foreign tourists registered in<br />
accommodation (with high economic efficiency for the Romanian tourism through the use of<br />
specific services) had a fluctuating trend in the period 1990 - 2000 when the lowest values were<br />
recor<strong>de</strong>d, of un<strong>de</strong>r 0.8 million in 1995, 1996 (the minimum of 0.762 million) and 1999. The
336<br />
Alexandru ILIEŞ, Dorina Camelia ILIEŞ, Cezar MORAR, Ioana JOSAN<br />
biggest <strong>de</strong>crease was recor<strong>de</strong>d between 1990 - 1995, with a reduction of almost half from 1.4<br />
million to 0.76 million. This <strong>de</strong>crease is not an effect of reducing of the number of tourists, but to<br />
the informal accommodation (friends, relatives), or to their failure to be registered in the statistics<br />
of these structures. The situation was caused by laws vacuum and especially by the structural and<br />
asset changes at the level of accommodation. Since 2000, the number of registered foreign tourists<br />
gradually increased from 0.795 million in 1999, to over 1.5 million foreign tourists stays in 2007<br />
(figure 2). Of the total tourist flow using accommodation, the foreign component had a certain<br />
stability in the period 1990 - 1996 with an average share of 12%, followed by a continuous upward<br />
trend with a maximum of 24.6% in 2005. After this date due to the increase in the total number of<br />
tourists, the foreign share has stabilized around 22.0% (figures 2 and 3). Increasing the number of<br />
foreign tourists is due to the amplification and diversification of tourism types from which the<br />
business tourism has grown significantly. An interesting aspect is in the interval 2000 - 2002, years<br />
with the lowest number of tourists registered in Romania, it was registered an increase in the share<br />
of foreigners from 17.6% to 20.6%.<br />
8000 number of foreign tourists arrivals (thou)<br />
7500<br />
7000<br />
6500<br />
6000<br />
5500<br />
5000<br />
4500<br />
4000<br />
3500<br />
3000<br />
2500<br />
2000<br />
1500<br />
1000<br />
500<br />
0<br />
with official accomodation<br />
without official accomodation<br />
1990<br />
1991<br />
1992<br />
1993<br />
1994<br />
1995<br />
1996<br />
1997<br />
1998<br />
1999<br />
2000<br />
2001<br />
2002<br />
2003<br />
2004<br />
2005<br />
2006<br />
2007<br />
2008<br />
Figure 3. Romania. The tourist flow consi<strong>de</strong>ring the number of arrivals of foreign tourists,<br />
with and without tourist accommodation in period 1990 - 2008<br />
(Data sources: Romanian National Institute of Statistics, 2010; www.insee.ro)<br />
The annual domestic tourist flows consisting of Romanian tourists for the period 1990 -<br />
2008, consi<strong>de</strong>ring the structural aspect and the number of tourists, register a similar trend to the<br />
foreign tourists one, but with an opposite trend in terms of share of Romanian tourists in the total<br />
volume of tourist flows recor<strong>de</strong>d. The maximum value of 10.8 million tourists registered in 1990<br />
was not reached in any year of the period un<strong>de</strong>r review, moreover, following an absolute minimum<br />
of 3,848 million tourists in 2002 their number increased continuously, to a value of only 5.659<br />
million domestic tourists in 2008. Among the causes that have generated the first downward trend<br />
inclu<strong>de</strong>: restriction of former Socialist wellfares (Cocean, 1995, p. 105), reducing the living<br />
standard and the leisure life by subsistence activities, the political instability and unfavorable<br />
international Romania's image, the rising prices of tourism services and lower population incomes,<br />
the large differences in price-quality ratio for services, the ina<strong>de</strong>quate infrastructure of mo<strong>de</strong>rn<br />
requirements in terms of quality and quantity etc. Also, since 1995 the share of Romanians in the<br />
total tourist flow <strong>de</strong>creased gradually from 89.2% in 1995 to 75.4% in 2005, following a slight<br />
growth to 79.4% in 2008 (figure 2).<br />
The main tourist <strong>de</strong>stinations of the analyzed tourist flows, according to official statistics<br />
recor<strong>de</strong>d by the National Romanian Institute of Statistics are the tourist resorts, the seasi<strong>de</strong>, the<br />
Danube Delta, the capital of Bucharest and the county capitals, other urban and rural settlements
Internal Tourism Movement and the Main Romanian Tourist… 337<br />
etc (figure 4). For example, the 2008 tourist flow registered in Romania in accommodations<br />
consisted of 7.125 million tourists of which 1.466 million foreign tourists (20.5%). The most<br />
attractive tourist <strong>de</strong>stinations have been the capital Bucharest and the county capitals which<br />
attracted 47.2% of the tourists stay (3.363 million), followed by the urban and rural settlements in<br />
Romania with only 15.4% (1.101 million), the mountain resorts 14.0% (0.998 million), the seasi<strong>de</strong><br />
11.7% (0.833 million) and the spa resorts 10.2% (0,728 million), at the opposite being the Danube<br />
Delta with 1.34% (0.096 million).<br />
4000 no tourists (thou)<br />
3500<br />
3000<br />
Seasi<strong>de</strong><br />
Mountain<br />
County resi<strong>de</strong>nce town<br />
Spas<br />
Danube Delta<br />
Other localities<br />
2500<br />
2000<br />
1500<br />
1000<br />
500<br />
0<br />
1994 1995 1996 1997 1998 1999 2000 2001 2002 2003 2004 2005 2006 2007 2008<br />
Figure 4. Romania. The main tourist <strong>de</strong>stinations according with numers of arrivals in 1994-2008<br />
(Data sources: Romanian National Institute of Statistics, 2010; www.insee.ro)<br />
2500<br />
2000<br />
1500<br />
1000<br />
500<br />
0<br />
no. tourists (thou)<br />
Romanians<br />
Foreigners<br />
Seasi<strong>de</strong> Spas Mountain Danube Delta County<br />
resi<strong>de</strong>nce towns<br />
Other localities<br />
Figure 5. Romania. The main tourist <strong>de</strong>stinations according with<br />
numbers of foreigners and Romanians arrivals in 2008<br />
(Data sources: Romanian National Institute of Statistics, 2010;<br />
www.insee.ro)<br />
After the origins,<br />
consi<strong>de</strong>ring the areas of<br />
<strong>de</strong>stination, the spa resorts have a<br />
share of 96.3%, the seasi<strong>de</strong> 95.0%,<br />
followed by the mountain resorts<br />
with 89.5% reflect the dominance<br />
and the orientation of flows<br />
consisting of Romanian tourists,<br />
while the representative flows<br />
consisting of foreign tourists<br />
accounted for 32.7% in Bucharest<br />
and county capitals, 17.7% in the<br />
Danube Delta and 15.7% in other<br />
rural and urban areas.<br />
Comparatively, in 2002, when the<br />
internal tourism flow registered the<br />
lowest value of 4.847 million (of<br />
which 20.6% foreigners), the<br />
internal structure on <strong>de</strong>stinations<br />
had the same or<strong>de</strong>r except other<br />
urban and rural settlements with only 12,0% (comparative to 15% in 2008). Higher percentages<br />
than 2008 were recor<strong>de</strong>d in 2003 at the seasi<strong>de</strong> (14%), the spa tourism (13%), in the same time<br />
pointing out the stability of the mountain tourism (14%). In terms of numbers, all 2008 values are<br />
higher than those recor<strong>de</strong>d in 2002 (figure 5).<br />
The domestic tourist flow of 5.659 million Romanian tourists structured on domestic<br />
<strong>de</strong>stinations shows the dominance with a share of 40% of the capital Bucharest and of the counties<br />
capitals, and a share only of 1.4% for the Danube Delta. The mountain resorts are preferred by
338<br />
Alexandru ILIEŞ, Dorina Camelia ILIEŞ, Cezar MORAR, Ioana JOSAN<br />
15.8% tourists, other settlements by 16.5%, the spa resorts by 12.4% and the seasi<strong>de</strong> by 13.9%. In<br />
case of the internal flow of foreign tourists (figure 3 and 4) the situation reflects the main types of<br />
tourism, the Bucharest and county capitals attract 75.1% of the total, followed far from other<br />
localities with only 11.8%, the mountain resorts 7.1%, the seasi<strong>de</strong> 2.9%, the spa resorts 1.8%,<br />
while the Danube Delta registers 1.16% of the foreigners stay in 2008 (figure 5).<br />
Both the Romanian and foreign tourists preferred in the analyzed period the hotels in the<br />
average rate of 81%, with a maximum value of 84.6% recor<strong>de</strong>d in 1993 and a minimum of 75.5%<br />
in 1990. The most consistent foreign tourists flow accomodated in hotels or motels was recor<strong>de</strong>d<br />
in 2007, with a total of 1.404 million (20% of total) representing 90% of the total registered<br />
foreign tourists in that year.<br />
Figure 6. Romania. The counties <strong>de</strong>stinations according with numbers of arrivals in 2008<br />
(Data sources: Romanian National Institute of Statistics, 2010; www.insee.ro)<br />
In terms of regional <strong>de</strong>stinations, at the county level in 2008 at the 41 counties and capital<br />
Bucharest, the domestic tourist flow consisting of the total 7.125 million foreign and Romanian<br />
tourists was oriented mainly to (figure 6): ConstanŃa 13.7% (0.978 million) in the seasi<strong>de</strong>, the capital<br />
Bucharest with 13.4% (0.952 million) the main <strong>de</strong>stination for the cultural and business tourism. On<br />
the following places there are the counties Braşov 8.2% (0.582 million) with the mountains areas and<br />
the famous resort Poiana Braşov, Prahova 5.9% (0.417 million) with the chain of climatic resorts in<br />
the Prahova Valley, Cluj 5.5% (0.392 million) the most important cultural and business center of<br />
Transylvania etc. With close values and above the national average of 2.4% (11 counties) there are<br />
the counties Sibiu 4.0%, Timiş 4.0%, Vâlcea 3.3%, Suceava 3.2%, Bihor 3.2%, Mureş 3.2%, Arad<br />
2.6%, Iaşi 2.3% and NeamŃ 2.2%, Argeş 2.0% etc. The least attractive counties are: Sălaj 0.2%,<br />
Călăraşi 0.2% and Olt 0.2% each with 0.017 million tourists (figure 6).<br />
CONCLUSIONS<br />
The analysis of tourist flows in Romania between 1990 - 2008 and consisting of Romanian<br />
and foreign tourists, officially recor<strong>de</strong>d in the tourist accommodation structures, largely reflects<br />
the stage of <strong>de</strong>velopment, dynamics, quality and volume of the existing tourist offer in Romania.<br />
The thresholds that marked the political and economic <strong>de</strong>velopments of the Romanian politicalterritorial<br />
system, overlapping the transition from Socialist to the market economy, the EU and
Internal Tourism Movement and the Main Romanian Tourist… 339<br />
NATO accession, the increased area for the expression of freedom of people movement without<br />
visa regime etc, are extremely obvious in the statistical values recor<strong>de</strong>d during this analyzed period<br />
of time. Also, diversifying the tourism types and the tourist accommodation structures led to the<br />
continuous restructuring of the tourist flows establishing tourist <strong>de</strong>stination areas. Whether we are<br />
talking about well known tourist regions or about counties, we have noticed a continuous<br />
repositioning of their hierarchy generated by the number of registered foreign and Romanian<br />
tourists. The top positions were almost in all cases the „tourist” counties such as Brasov,<br />
Constanta or Prahova, or established tourist <strong>de</strong>stinations such as the seasi<strong>de</strong> resorts or the climatic<br />
and spa-climatic resorts. At the same time the proposed study may be useful in <strong>de</strong>veloping the<br />
regional strategies to increase the attractiveness of both the well known tourist regions and also of<br />
those having enough resources, but not promoted and <strong>de</strong>veloped to their potential.<br />
REFERENCES<br />
Bramwell B., Meyer D. (2007), Power and Tourism Policy Relations in Transition, Annals of Tourism Research, 34, 3, 766-788;<br />
Cân<strong>de</strong>a Melinda, Er<strong>de</strong>li G., Simon T., Peptenatu D. (2003), PotenŃialul turistic al României şi amenajarea turistică a<br />
spaŃiului, Editura Universitară, Bucureşti;<br />
Cazelais N., Na<strong>de</strong>au R., Beau<strong>de</strong>t G. (2000), L’espace touristique, Presses <strong>de</strong> l’Universite du Quebec;<br />
Ciangă N., Deszi Şt. (2007), Amenajare turistică, Presa universitară clujeană, Cluj Napoca;<br />
Ciangă N. (2006), România. Geografia turismului, Presa Universitară Clujeană, Cluj Napoca;<br />
Cocean P., Vlăsceanu G., Negoescu B. (2002), Geografia generală a turismului, Meteor Press, Bucureşti;<br />
Cocean P. (2005), Geografie regională, Presa Universitară Clujeană, Cluj Napoca;<br />
Cunha, A. (1988), Systems and territory: values, concepts and indicators for other <strong>de</strong>velopment, L’Espace geographique, 3,<br />
(in French), 181-198;<br />
Dinu Mihaela (2002), Geografia turismului, Editura Didactică şi Pedagogică, Bucureşti;<br />
Gunn, C. A., Var, T. (2002), Tourism Planning. Basics, Concepts, Cases, Routledge, New-York, 165-218;<br />
Ianoş I. (2000), Sisteme teritoriale. O abordare geografică, Editura Tehnică, Bucureşti;<br />
Hall C. M. (2000), Tourism Planning, 1st edition, Prentice Hall, Harlow;<br />
Ilieş A., Ilieş Dorina, Josan Ioana, Grama V., Gozner Maria (2008), Romanian Rural Tourism between authentic/traditional<br />
and mo<strong>de</strong>rn/contemporary. The case of Crişana and Maramureş area (I), in GeoJournal of Tourism and Geosites,<br />
year I, no. 2, vol. 2, p. 140-148, Editura UniversităŃii din Ora<strong>de</strong>a, Ora<strong>de</strong>a;<br />
Ilieş A., Dehoorne O., Ilieş Dorina (2012), The Cross-bor<strong>de</strong>r territorial system in Romanian-Ukrainian Carpathian Area.<br />
Elements, mechanisms and structures generating premises for an integrated cross-bor<strong>de</strong>r territorial system with<br />
tourist function, in Carpathian Journal of Earth and Environmental Sciences, February, vol. 7, no.1, Baia Mare, pp.<br />
27-38 (on-line version);<br />
Ilies M. (2007), Amenajare turistică, Presa Universitara Clujeana, Cluj Napoca;<br />
Lew A. A., Hall C.M., Timothy D. J. (2008), World Geography of travel and tourism. A Regional Approach. Elsevier,<br />
Butterworth-Heinemann, Oxford, 51-67;<br />
Martinez O. (1994), The dynamics of bor<strong>de</strong>r interaction: New approachs to bor<strong>de</strong>r analysis, in C.H. Schofield (ed.): World<br />
Boundaries, Global Boundaries, Routledge Ed., London, 1, 1-15;<br />
Muntele I., IaŃu C. (2003), Geografia turismului: concepte, meto<strong>de</strong> şi forme <strong>de</strong> manifestare spaŃio-temporală, Editura<br />
Sedcom Libris, Iaşi;<br />
Veal A. J. (2006), Research Methods for Leisure and Tourism: A Practical Gui<strong>de</strong>, Financial Times-Prentice Hall/Pearson<br />
Education, Harlow;<br />
Wall G. (1993), Towards a tourism typology, in J.G. Nelson, R.W. Butler and G. Wall (eds), Tourism and Sustainable<br />
Development: Monitoring, Planning, Managing, 45-58, Waterloo;<br />
Williams A. (1998), Tourism Geography. Contemporary Human Geography, Routledge, London and New York;<br />
Williams A. (2006), Tourism and hospitality marketing: fantasy, feeling and fun, International Journal of Contemporary<br />
Hospitality Management, 18, 6, 482-495;<br />
* * * Master Planul pentru turismul naŃional al României 2007-2026;<br />
* * * (2008), Planul <strong>de</strong> Amenajare a Teritoriului NaŃional. SecŃiunea a VI-a – Zone Turistice, (www.mdlp.ro);<br />
* * * (2010), Romania. Statistical Yearbook 2010, National Institute of Statistics of Romania, Bucharest, (www.insse.ro).<br />
Submitted: Revised: Accepted and published online<br />
July 29, 2011 September 21, 2011 November 30, 2011
Analele UniversităŃii din Ora<strong>de</strong>a – Seria Geografie Year XXI, no. 2/2011 (December), pp. 340-353<br />
ISSN 1454-2749, E-ISSN 2065-1619 Article no. 212120-552<br />
ASPECTS REGAR<strong>DIN</strong>G THE ENVIRONMENTAL IMPACT OF<br />
TOURISM ACTIVITIES IN THE APUSENI NATURAL PARK<br />
(ROMANIA)<br />
Ribana LINC ∗<br />
University of Ora<strong>de</strong>a, Department of Geography, Tourism and Territorial Planning, The Territorial Studies and Analyses<br />
Centre (CSAT), Ora<strong>de</strong>a, Romania, e-mail: ribanalinc@yahoo.com<br />
Stelian NISTOR<br />
University of Ora<strong>de</strong>a, Department of Geography, Tourism and Territorial Planning, The Territorial Studies and Analyses<br />
Centre (CSAT), Ora<strong>de</strong>a, Romania, e-mail: snistor@uora<strong>de</strong>a.ro<br />
David TURNOCK<br />
Geography Department, University of Leicester, University Road, Leicester LE1 7RH, U.K<br />
Abstract: Located in the heart of Apuseni Mountains, the Apuseni Natural Park, provoked<br />
passionate controversy related to its legal status, the management areas, the touristic<br />
megaprojects, the promotion of more or less <strong>de</strong>cent touristic activities. The natural and human<br />
resources are fabulous and are wi<strong>de</strong>ly recognized abroad and are struck with his foot in all<br />
directions. But the touristic activities causes many damages such as: air pollution in summer<br />
period, water pollution in karsts areas, soil pollution, especially with waste products in huge<br />
quantities, the reduction of natural areas, <strong>de</strong>struction of flora and fauna, <strong>de</strong>gradation of<br />
landscape aesthetics through doubtful touristic infrastructure, the effect of overcrowding<br />
during summer periods. To all these effects, which accumulate from year to year, one could<br />
add the pressure of rural communities which has land within the park territory, because along<br />
centuries the forest supplied the inhabitants with significant incomes. Recently, a strong lobby<br />
is ma<strong>de</strong>, sometimes at the edge of the legality, in or<strong>de</strong>r to allow real estate projects. But, asi<strong>de</strong><br />
from nebulous discussions and confrontations on the <strong>de</strong>velopment of mass tourism in the park<br />
area, we should mention that there are initiatives to promote a <strong>de</strong>cent tourism <strong>de</strong>velopment.<br />
Key words: Apuseni Natural Park, tourism potential, <strong>de</strong>gradation, impact<br />
* * * * * *<br />
INTRODUCTION<br />
The Apuseni Natural Park (ANP) is located in the western part of Romania and in the<br />
central–north-western part of the Apuseni Mountains (figure 1), within the coordinates of 46°26’ –<br />
46°45’ lat N and 22°32’ - 23°5’ long E. In this geographic space, the ANP occupies an area of<br />
75,784 hectares, established by Law no. 5 / 2000, stretching on the administrative territory of three<br />
counties (Cluj - 40.15%, Bihor - 31.92% and Alba - 27.92%). The Park also constitutes the<br />
territory of 16 communes and properties which belong to other 25 communes, so that 47<br />
∗ Corresponding author<br />
http://istgeorelint.uora<strong>de</strong>a.ro/Reviste/Anale/anale.htm
Aspects Regarding the Environmental Impact of Tourism Activities in the Apuseni Natural … 341<br />
settlements and 2 holiday villages (Boga and Fântânele) are integrally on the park`s territory and<br />
partly other 8 settlements on the park`s limits (ANP Adm., 2007).<br />
Figure 1. Geographical position of the Apuseni Natural Park<br />
within the Apuseni Mountains<br />
Professor Alexandru Borza from Cluj Napoca is the pre<strong>de</strong>cessor of the i<strong>de</strong>a of law<br />
protected natural elements of Bihor Mountains (in 1924); he proposed the establishment of a<br />
natural park (an approach with no space completion). Prominent scientists followed, in the fight<br />
with bureaucracy and inertia: Emil RacoviŃă (mid 30s), Marcian Bleahu (the 50s - 60s), Zeno<br />
Oarcea (the 70s), Ana Marossy (the 70s - 80s - who managed to obtain the protection of 20<br />
reservations on the actual park, situated in Bihor County - Marossy, 1975) etc.<br />
After the major change of the political regime in December 1989, the legal status of this<br />
vast area was also changed: by the Government Emergency Ordinance no. 7 / 1990 the „phantom<br />
parks of the 70s, including the one in the Apuseni Mountains...” were re-established (Bleahu,<br />
2004) (about 13 national parks). The first official statute was established in 1995 by Law no. 137 /<br />
1995 (environment legal framework) when all existing reservations and natural parks were listed<br />
in the category of „reservations of national level”. Law no. 5 / 2000 and Law no. 41 / 2000<br />
established its surface (75,784 hectares) and the title of „natural park”, and based on Or<strong>de</strong>r of<br />
Ministry no. 850 / 2003 and HG 230 / 2003, the Natural Park enters un<strong>de</strong>r the administration of<br />
the National Forest Authority - ROMSILVA.<br />
By the internal zonation (ANP Adm. 2007), NPA comprises management categories<br />
starting with the most restrictive (strict protection areas, 1st category UICN) where human<br />
activities are completely exclu<strong>de</strong>d, to the most permissive management category of protected<br />
areas in Romania (natural park, 5 th category, UICN) as areas where the <strong>de</strong>velopment of<br />
traditional communities is promoted, in harmony with nature. According to the UICN<br />
classification, the ANP is a protected area, inclu<strong>de</strong>d in the 5 th management category. The<br />
internal zonation of the ANP comprises 4 management categories.
342<br />
Ribana Linc, Stelian NISTOR, David TURNOCK<br />
Overall, on the park territory there are numerous natural reservations and natural monuments<br />
(figure 2). This variety of habitats and natural geological, flora and fauna elements, has allowed ANP enter<br />
an important European project: Project Phare CBC „Romanian-Hungarian Corridor for the Preservation<br />
of Biodiversity” and also in Natura 2000 (European Union protected areas network).<br />
Figure 2. Protected areas of the ANP 1<br />
1 Some of the caves (class A reservetion) are not on the map as their location is secret (for their protection), in accordance<br />
with H.G. no 57/2007, art. 44, paragraph „h” and Law no 49/2011 which seem to put into practice the expression „live<br />
hid<strong>de</strong>n to keep clean”, http://www.humpleu.ro/pesteri.html
Aspects Regarding the Environmental Impact of Tourism Activities in the Apuseni Natural … 343<br />
A FABULOUS TOURISTIC POTENTIAL<br />
If we tried to find a single word to <strong>de</strong>scribe the Apuseni Natural Park, it would be<br />
„fascinating”. It`s hard to find another area <strong>de</strong>fined by karstifiable rocks that bear such a great<br />
variety of endo and exokarst forms on limited area.<br />
From the relief point of view, the Apuseni Natural Park overlaps partially the Vla<strong>de</strong>asa and<br />
Bihorului Mountains. In these complex mountain structures, limestone gives the relief distinct<br />
touches of originality and uniqueness by altitu<strong>de</strong> karst plateaus, a hydrographic network <strong>de</strong>nse to<br />
the boundaries and unor<strong>de</strong>red on the surface karst and by a <strong>de</strong>ep karst hard to find by its rich<br />
forms, ancient habitation traces or fossils, thus proving a unique touristic value throughout the<br />
Romanian space (Pop, 1997; Linc, 1998; Moş, 2008).<br />
On the surface, the karstic relief is <strong>de</strong>fined by small close karst bassinets (Ponor Gla<strong>de</strong>,<br />
Ocoale-Scărişoara Basin, Barsa Pit, Vărăşoaia Gla<strong>de</strong>), drained by streams with very short surface<br />
flows. They alternate with karst plateaus (Padiş, Lost World) where there are numerous sinkholes<br />
of different sizes which mark the un<strong>de</strong>rground waterflows as well as exten<strong>de</strong>d limestones<br />
pavements (Bătrâna - Călineasa), gorge sectors (Galbenei, Someşului Cald, Ordâncuşei etc.) or<br />
<strong>de</strong>files (Arieşului Mare Defile).<br />
An extraordinary endokarst has <strong>de</strong>veloped in <strong>de</strong>pth, with monumental caves (Valea Rea<br />
Cave, Pojarul PoliŃei, Piatra Altarului, Bear Cave, Micula`s Cave, Măgura Cave, Cetatea Ră<strong>de</strong>sei,<br />
Humpleu Cave, Coiba Mică and Coiba Mare etc.), profound pit caves (V 5 Pit Cave, Fortress of<br />
Ponor, BorŃig, Scărişoara), spectacular karst springs (Ponor, Galbenei, Crişului Negru, Tăuz etc.)<br />
About 1,500 caves have been accounted for within the park boundaries, some of them<br />
national records (Bleahu, 2004; ANP Adm., 2007; www.parcapuseni.ro). For example there are:<br />
- one of the most spectacular karst phenomena in the country (CetăŃile Ponorului)<br />
- the largest ice cave (Scărişoara Ice Cave, with an ice volume of 75,000 m 3 (Silvestru and<br />
Ghergari, 1994; Perşoiu, 2003);<br />
- the most ornated cave, with unique crystallizations. Valea Rea Cave stands among the<br />
first 10 cavities on Earth from a mineralogical point of view. 37 different minerals can be found<br />
here as speleotems (aragonite, gypsum, quartz, celestite, malachite, rodocrozite etc. – a<br />
miniature museum!), many <strong>de</strong>cribed worldwi<strong>de</strong> for the first time in a speleic environment. This<br />
is one of the most complex caves in the country (20 km long) and contains forms of a<br />
mineralized hydrothermal paleokarst (including native gold), relict hydrothermal endokarst and<br />
cold water endokarst (Damm et al., 1996);<br />
- the most beautifully concretioned cave in Romania (Piatra Altarului);<br />
- the most maze-like cave in Romania (Pârâul Hodobanei cave - with 22,142 km of<br />
topographically represented galleries, along an extension of only 820 m long (ramification<br />
coefficient 27.0).<br />
- the <strong>de</strong>epest un<strong>de</strong>rwater cave (Tăuz Kartst Spring - siphon no. 2 is the <strong>de</strong>epest un<strong>de</strong>rwater<br />
passage explored in Romania, 85 m <strong>de</strong>ep).<br />
- the <strong>de</strong>epest cavity in the country (V 5 Pit Cave, also called the FaŃa Muncelului Pit Cave)<br />
with a 642 m drop (unfinished mapping);<br />
- the largest romanian un<strong>de</strong>rground lake (in the GheŃarul <strong>de</strong> sub Zgurăşti Cave). An<br />
interesting meteorological phenomenon was reported in this cave by R. Jeannel and E. G. Racovita<br />
(1929): mist formed into the light beams that penetrates through the cave entrance at noon.<br />
The authors assume that it is a phenomenon of water con<strong>de</strong>nsation around the new formed<br />
ions, which is a process similar to the Wilson effect. Another interesting element is the presence of<br />
moss on the chamber floor. It is Thamnium alopecurum L. and Oxyrrhynchium praelongum<br />
(Hedw.), forms that grow un<strong>de</strong>r water and show the lake maximum water rise level<br />
(ro.wikipedia.org/wiki/Pe%C8%99tera-aven_ghe%C8%9Barul_<strong>de</strong>_sub_Zgur);<br />
- the highest <strong>de</strong>nsity of karst forms on surface unit;<br />
- the largest un<strong>de</strong>rground vertical waterfall in Romania (Ventilator Casca<strong>de</strong>: 82 m, in the<br />
Valea Rea Cave);
344<br />
Ribana Linc, Stelian NISTOR, David TURNOCK<br />
- cave paintings have been discovered<br />
recently in Coliboaia Cave (Sighiştel Valley),<br />
thought to be over 30,000 years old. „The cave is<br />
closed at the moment and won`t be opened to the<br />
public, just for the better preservation of the<br />
findings” (V. Lascu, Presi<strong>de</strong>nt of the Romanian<br />
National Speleology Fe<strong>de</strong>ration, http://www.experienceromania.ro/Pestera_Coliboaia,<br />
http://www.ebihoreanul.ro/stiri/ultima-or-31-1/<br />
picturile-din-pestera-coliboaia-unice-in-europacentrala-si-<strong>de</strong>-est-96610.html,<br />
http://www.a<strong>de</strong>varul.ro/actualitate/social/Cele_mai_<br />
vechi_<strong>de</strong>sene_din_lume-intr-o_pestera_din_Bihor<br />
_0_546545942.html).<br />
Another unique natural feature is Groapa<br />
Ruginoasa (R. Hole), an immense torrential organism<br />
(below Mount Tapu, 1746 m) having the shape of an<br />
amphitheatre, formed and strongly <strong>de</strong>epened in a thick<br />
layer of quartzite sandstones and reddish-purple<br />
Permian shale overlapping limestones dissolved in<br />
time. Surface and vertical erosion are very active so<br />
Ruginoasa Hole expands before our eyes. At present,<br />
its size is estimated at about 600 m in diameter and 100<br />
m <strong>de</strong>pth. Figure 3 shows schematically the Ruginoasa<br />
Hole in four time sequences, just to illustrate this<br />
accelerated evolution.<br />
The ANP also shelters five permanent ice<br />
blocks, called un<strong>de</strong>rground glaciers: Scărişoara<br />
(on Scărişoara Plateau) and Focul Viu (Padiş) are<br />
the most famous and appreciated by tourists (figure<br />
Figure 4. The ice from Focul Viu<br />
Cave in 2007<br />
(Source: R. Linc)<br />
Figure 3. The evolution of Ruginoasa Hole<br />
The backgroung is the topographic map scale<br />
1:25,000 (year 1996) For the year 1886 I used a<br />
Franciscan map scale 1:28,800, for the year 1939 a<br />
drawing to scale 1: 20 000 plan and for 2009, the<br />
orthorectify image<br />
(Source of maps: Bihor County Council)<br />
4), along with the ice blocks of BorŃig, Barsa (Padiş) and<br />
Vârtop (Casa <strong>de</strong> Piatră area).<br />
Apart from them, there are some caves that house<br />
permanent but smaller ice masses (the case of Onceasa<br />
or Vârtop pithcaves) or seasonal ice coming from<br />
accumulated snow, which may melt in warm years<br />
(GheŃarul <strong>de</strong> sub Zgurăşti).<br />
In terms of hydrography, the surface streams of the<br />
ANP area belong to several hydrographical basins:<br />
Crişului Negru, Someşului Mic and Arieşului Mare.<br />
In karst areas the surface hydrographic network is<br />
unorganised and there is a phenomenon of karstic difluence,<br />
which is the subterranean transfer of the waters beneath the<br />
surface watershed. Following the hydrological markings<br />
ma<strong>de</strong> by using ecotracers, numerous interconnections have<br />
been i<strong>de</strong>ntified between hydrographic basins of the rivers<br />
Arieş, Crişul Negru and Someşul Mic and also between<br />
different tributaries of the same basin. The most distinct<br />
example is represented by the endoreic basin Padiş-CetăŃile<br />
Ponorului, tributary, in the antepliocene era to the Arieşului<br />
Mare Basin, but which at present, discharges 95% of its
Aspects Regarding the Environmental Impact of Tourism Activities in the Apuseni Natural … 345<br />
waters towards Crişul Negru and the rest towards Someşul Mic and Arieşul Mare (Adm. ANP, 2007).<br />
In Someşului Mic Basin, at an altitu<strong>de</strong> of 1,050 m lies the storage lake of Fântânele,<br />
formed as a result of damming the Someşului Cald Valley downstream of its confluence with Beliş<br />
stream. Due to the presence of this reservoir, a small mountain resort has <strong>de</strong>veloped (Fântânele)<br />
and in the neighbour villages, second resi<strong>de</strong>nces like holiday homes are appearing rapidly.<br />
From the biogeographical point of view, the ANP area stands out by its rich flora and fauna<br />
(northern, south-Mediterranean, Central-European, eastern and Euro-Asian elements can be found<br />
here, together with numerous en<strong>de</strong>mic and relict elements unique in the country. About 1,700 plant<br />
and 850 animal species have been i<strong>de</strong>ntified in the ANP.<br />
Generally speaking, the general scheme of Carpathian levels is present here (batch <strong>de</strong>ciduous<br />
forests: Carpinus betulus, Acer pseudoplatanus, Fraxinus excelsior, Cerasus avium etc), beech<br />
forests (<strong>de</strong>fined by Fagus silvatica), coniferous forests (<strong>de</strong>fined by the species Picea abies), en<strong>de</strong>d by<br />
the sublevel of subalpine meadows. On this background, major alterations appear, due to local relief,<br />
climate, soil features and lately, especially in the last century, due to human intervention.<br />
Among the en<strong>de</strong>mic flora species of the park, there are: Transilvanian lilac (Syringa<br />
josikaea), sconite (Aconitum calibrotryon ssp. skarisorensis), pink (Dianthus julii wolfii), violet<br />
(Viola josi), several forms of hawkweed (Hieracium bifidum ssp. biharicum, H. sparsum ssp.<br />
porphiriticum, H. kotschyanum etc.), Edraianthus kitaibelii (a plant firstly <strong>de</strong>scribed here) and<br />
Melamphyrum bihariense (Adm. PNA, 2007).<br />
In the park fauna, there is a pregnant, well represented un<strong>de</strong>rground fauna of invertebrates.<br />
A great number of species are en<strong>de</strong>mic and many of them inhabit just one cave (insects are well<br />
represented, choleopteres especially (ANP Adm. 2007).<br />
Some of the caves are of a greater importance also because of the bat populations they<br />
shelter (caves in Sighiştelului Valley, Humpleu, Poarta lui Ionele, GheŃarul <strong>de</strong> sub Zgurăşti, Coiba<br />
Mare etc). Thus, out of the total of 29 species of bats in Romania, 19 live in the park.<br />
The large mammal fauna is represented by 45 species, generally common to mountain forests<br />
and there is also the chamois (Rupicapra rupicapra), recently reintroduced in the upper basin of the<br />
Crişul Pietros - Boga Valley. Today it is present also in Groapa Ruginoasă, CetăŃile Ponorului,<br />
ScăriŃa. Another action of repopulation successfully accomplished in the years 1970 - 1980 addressed<br />
the capercaillie (Tetrao urogallus), which was endangered as a result of excessive hunting.<br />
The large mammal fauna is well represented by populations of wolf (Canis lupus), lynx<br />
(Lynx lynx), bear (Ursus arctos), roe <strong>de</strong>er (Capreolus capreolus), red <strong>de</strong>er (Cervus elaphus), wild<br />
boar (Sus scrofa), wild cat (Felis silvestris) and polecat (Mustela putorius).<br />
The strong human pressure - the area has been populated since ancient times - manifested<br />
especially by <strong>de</strong>forestation of vast surfaces covered with forests, replaced by grasslands. A strong<br />
negative impact of the human activity is shown by the alteration of the components and distribution<br />
of the fauna within the park area (in time, some species have disappeared or are about to disappear).<br />
Unusual habitats, <strong>de</strong>veloped especially in the spruce forests and <strong>de</strong>termined by the presence<br />
of excess water at higher altitu<strong>de</strong>s, are represented by turf moors which form either on siliceous<br />
sublayer (Molhaşurile <strong>de</strong> la Izbuce, Pietrele Onachii, peat bogs of Călineasa, Barsa, Onceasa), or<br />
on karst where the bottom of the dolines gets a silt waterproof coat (Padiş).<br />
Among them, formed on siliceous sublayer and inclu<strong>de</strong>d in the strict protection area,<br />
particularly beautiful and interesting from the scientific point of view are Molhaşurile <strong>de</strong> la<br />
Izbuce (figure 5) with six types of habitats, most important being: olygotrofic peatbogs<br />
(„tinoave”) very well preserved with numerous en<strong>de</strong>mic elements and glaciar relicts, which<br />
cover a surface of 85.94 hectares.<br />
Flora is <strong>de</strong>fined by the presence of peatmoss (Sphagnum cymbifolium sin. Sphagnum<br />
palustre), but among the „famous” plants, there are: sun<strong>de</strong>w (Drosera rotundifolia), an<br />
insectivore plant, as well as mugo pine (Pinus mugo) which live here, at the lowest altitu<strong>de</strong> in<br />
the country. These peatbogs preserve plants and animals that died long ago. Here and there<br />
„bottomless tarns” appear, giving the landscape a special aura with their black waters (figure 5).
346<br />
Ribana Linc, Stelian NISTOR, David TURNOCK<br />
Figure 5. Marshes „Molhaşurile” of Izbuce<br />
(Source: L. Nistor, taken from helicopter, 2010)<br />
The main tourism areas in the park are: Padiş - CetăŃile Ponorului, Boga - Aleu Valley,<br />
Chişcău - Peştera Urşilor cave, Sighiştel Valley, Vârtop - Arieşeni, Gârda - Scărişoara, Fântânele<br />
Lake, Vlă<strong>de</strong>asa - Stanciului Valley and Albac area (figure 6).<br />
TOURISM ACTIVITIES AND THEIR ENVIRONMENTAL IMPACT: „WILD<br />
TOURISM” MARKS NUMEROUS OBJECTIVES<br />
The human intervention on the environment leads, among other consequences, to a<br />
<strong>de</strong>gradation of the tourist patrimony by its <strong>de</strong>pletion and reduces the attractiveness of tourism<br />
resources. Surely the tourist practice needs a quality environment but in return, the quality of the<br />
environment is threatened by tourist <strong>de</strong>velopment (Rapport general, OCDE, 1980).<br />
In parallel with the unprece<strong>de</strong>nted <strong>de</strong>velopment of leisure activities, a constant growth of<br />
the intensity of the pressure put on the natural or human environment components was recor<strong>de</strong>d.<br />
This leads gradually to an overload of the components in some sectors which generates the<br />
phenomenon of tourism (Deszi et al., 2006).<br />
In the Apuseni Mountains in general but mosly in the ANP especially its southern half,<br />
motzi`s hamlets (groves) form poor community groups (Buza et al., 2001) which, after the strong<br />
socio-economic changes that occurred in Romania after 1989, entered an acute <strong>de</strong>mographic,<br />
social and economic <strong>de</strong>cline.<br />
For a long time in the area of the ANP a <strong>de</strong>crease of the human pressure upon the<br />
environment by overgrazing and other agricultural activities has been a priority and also the<br />
reduction of <strong>de</strong>forestation (let us remember that the motzi are thought to have had a „flourishing<br />
wood civilization”) and the ecological and sustainable alternative seemed to have been tourism<br />
(through its variety: rural tourism, agro-tourism, eco tourism, mountain tourism), so that people<br />
can have an alternative to their secular occupation by practicing pluri-activities (agriculture, timber<br />
and tourism (Abrudan and Turnock, 1999).<br />
One of the strongest arguments for adopting another lifestyle for the mountains inhabitants<br />
is the transformation of the traditional villages in „holiday villages” (Surd, 1992) and the rural<br />
facilities to become ago tourism facilities. There were villages and hamlets fit for the change:<br />
Cărmăzan, Casa <strong>de</strong> Piatră, Ocoale, Oncăseşti etc. But it`s a long way from the i<strong>de</strong>a to practice and<br />
other settlements became „holiday villages” (some uninhabited until then- like Boga or Vârtop or<br />
sparsely populated - like Ic-Ponor, and then there were the second homes becoming more<br />
numerous in the proximity of Fântânele lake. Another i<strong>de</strong>a was to create some over-communal<br />
centres that should be able to preserve the traditions and prevent the <strong>de</strong>population and migration to<br />
the adjacent valleys (Surd and Turnock, 2000).<br />
In the Apuseni Natural Park the environment offers lots of quality tourist attractions but it<br />
seems that the current tourist practices aren’t the most suitable for this protected area so that the<br />
negative impact upon the environment components is <strong>de</strong>tached from afar.
Aspects Regarding the Environmental Impact of Tourism Activities in the Apuseni Natural … 347<br />
Figure 6. Representative touristic areas and objectives within ANP<br />
1. Padiş - CetăŃile Ponorului area; 2. Boga - Aleu Valley area; 3. Sighiştelului Valley area; 4. Vârtop -Arieşeni area;<br />
5.Gârda - Scărişoara area; 6. Beliş - Fântânele Lake area; 7. Stanciului Valley - Pietrele Albe area; 8. Chişcău - Urşilor<br />
Cave ethno-touristic area; 9. Albac area
348<br />
Ribana Linc, Stelian NISTOR, David TURNOCK<br />
The first acts of <strong>de</strong>liberate <strong>de</strong>struction of the endokarst environment were recor<strong>de</strong>d in the<br />
19 th century, ma<strong>de</strong> by the fossils hunters (Caves Onceasa, Măgura etc.) or theft of speleotems<br />
(generalized in the subterranean environment). Starting with 1970 when tourism started to <strong>de</strong>velop<br />
explosively (and uncontrolled at that time), cave damaging has taken worrying dimensions (ANP<br />
Adm., 2007). Most caves in Sighiştelului Valley were affected in this way (Măgura Cave most of<br />
all).and in general all the caves that are accessible without any gear and special training. Or,<br />
another example: in early 70s, Valea Fagului Cave discovered while mining works advanced, was<br />
almost entirely <strong>de</strong>vastated. The cavity sheltered remarkable, unique speleotems and aragonite<br />
crystals. They were extracted to be sold on the market. Later, after 1990 the cave bear (Ursus<br />
spelaeus) bones smuggling appeared and its main target in the park perimeter was Onceasa Cave.<br />
Ancient artefacts are also tra<strong>de</strong> objects for smugglers (the case of Vârtop Glacier where, in the<br />
stalagmite ceiling three footprints of a Nean<strong>de</strong>rthal man were discovered in 1973. One of them,<br />
harvested when it was discovered, is in the „Emil RacoviŃă” Speleology Museum in Cluj-Napoca<br />
but the other two were stolen in the early 90s. The speleotems in Măgura, Corbasca, FânaŃe, V11<br />
Caves are most endangered now, because these cavities do not have efficient protection systems.<br />
Actions having totally or partially <strong>de</strong>structive character are diverse and complex and they<br />
address both territories which un<strong>de</strong>rgo strong tourism pressures and the ones characterized by lack<br />
or precarity of tourist amenities (e.g. lack or bad state of accommodation, access and special<br />
equipment – lad<strong>de</strong>rs, indicators, trails etc.) that <strong>de</strong>termines the dispersion of tourists on large areas,<br />
having negative consequences upon some of the environment components. Among the many<br />
natural environment prejudices, the most frequent are:<br />
- air pollution - a consequence of increasing car traffic in summer, as access in the park is<br />
permitted to all kinds of vehicles (from the heavy trucks which exploit and transport wood or work<br />
at the access road to Padiş, to individual cars, very numerous in July-August or SUVs that can<br />
reach places hardly accessible until recently). Dust from unpaved access roads adds to car<br />
discharge pipe emissions and at the end of summer the heavy smoke from burning garbage (e.g.<br />
Glăvoi Gla<strong>de</strong>). We should also mention the air pollution in the cave environment, by an increased<br />
temperature, CO 2 accumulations emitted by carbi<strong>de</strong> lamps and by visitor`s breath We should also<br />
mention the air pollution in the cave environment, by an increased temperature, CO 2<br />
accumulations emited by carbi<strong>de</strong> lamps an by visitor’s breath.<br />
For example, ithas been noted that at Focul Viu glacier, during the hight of the season<br />
(august), the melting process of the ice mass has accentuated (the high temperatures of the external<br />
environment might have contributed as well in the last years). The good news ist hat measures<br />
have been taken and the acces of tourists has been <strong>de</strong>nied for the last few years insi<strong>de</strong> the pitcave<br />
and the ice mass can be admired from a balcony. Although we are not the partisans of using<br />
physical barriers to isolate valuable objectives and we rather believe in the power of upbringing,<br />
we know that this goal requires a period of time.<br />
- rivers and small streams pollution - in karst areas, the latter vulnerable even to small<br />
human interventions. For example, in Boga holiday village (with about 200 house numbers<br />
including boarding houses) there is not even one water treatment plant and the situation is the<br />
same for Gârda village which has Scărişoara glacier on its area or, the case of Vîrtop, packed with<br />
villas, guesthouses and second homes. We mustn`t forget the small second homes in the proximity<br />
of Fântânele Lake which most of the time do not observe the rules of protection against sewage<br />
pollution. Car washing in the small streams is also ad<strong>de</strong>d to all those troubles as well as waste that<br />
can be found along riverbeds (especially plastic bottles).<br />
- soil erosion and pollution. Soil erosion in the tourism area occurs along the many paths<br />
and trails that cross the park through all directions, in camping areas and in sightseeing spots. We<br />
must specify however, that most of the soils are heavily ero<strong>de</strong>d by forest exploitation and the<br />
erosion caused by tourists is by comparison, insignificant. But more important is the pollution of<br />
soil by <strong>de</strong>positing domestic waste and insufficiency of waste disposal system. This is a chapter we<br />
could insist on more...Waste disposal problem is common to tourism regions because of the
Aspects Regarding the Environmental Impact of Tourism Activities in the Apuseni Natural … 349<br />
concentration of tourist facilities on area unit or because of the temporary concentration of the<br />
number of tourists. Every year about 40,000 tourists walk on the park paths and the mountains of<br />
garbage they leave behind aren`t cleared off because it isn`t ....profitable (these are stated by<br />
mayors of communes that have their territories in the park) - www.jurnalul.ro/stire-<strong>de</strong>scoperirearomaniei-08/gunoaiele-apusenilor.<br />
The area Padiş-Fortress of Ponor is consi<strong>de</strong>red the heart of the<br />
park, on the one hand because of its geographical position and on the other due to great number of<br />
first rank tourist objectives. However, there are only two places tourists coming in „summer<br />
human flood” can accommodate in and mostly in tents: Padiş Plain and Glăvoi Gla<strong>de</strong> (also known<br />
as „La Grajduri”. At La Grajduri there are a few wire mesh trash bins but their capacity is too<br />
small compared to the garbage quantity produced. Garbage light fractions are carried by wind<br />
(sometimes by animals) and get into the frail CetăŃilor stream that crosses Glăvoi Gla<strong>de</strong> and flows<br />
in the un<strong>de</strong>rground of the Fortress of Ponor.<br />
But apart from the fact that the two places have no minimum endowments for a <strong>de</strong>cent<br />
hygiene, the brutality of the tourists has no bor<strong>de</strong>rs, as new (illegal) camping places appear<br />
constantly (most of them in Ponor Gla<strong>de</strong>), accompanied by garbage procession and all tourist trails<br />
are marked by plastic bottles, beer ans, plastic bags etc. And on the ice block of Scărişoara, traces<br />
of cigarette ash can are seen. Tourists are often caught cutting firewood or washing their card in<br />
the small mountain streams.<br />
- land use by reducing natural spaces..In the park area, the reduced natural spaces are<br />
mostly a result of other economic activities like massive <strong>de</strong>forestation. For centuries motzi (a<br />
part of the mountain inhabitants of the park) have earned their living by woodworking but the<br />
29 th century society bears the guilt of the <strong>de</strong>forestations „to the scrap”. However tourist<br />
activities aren`t entirely blameless either, as tourism <strong>de</strong>velopment draws up accommodation<br />
buildings, equipment and tourism infrastructure that threaten free spaces. If until the 90s there<br />
wasn`t much of a visible tourism infrastructure, nowadays there are a few places where<br />
holiday villages have <strong>de</strong>veloped, or mountain resorts: for example Boga Valley (wild and<br />
isolated until recently), with many buildings with most various architecture, spread along the<br />
valley and up the slopes. Or on the Fântânele Lake banks, at 1,050 m altitu<strong>de</strong> where a<br />
flourishing resort has appeared. A lot more can be ad<strong>de</strong>d: the Ic Ponor holiday village,<br />
Aleului Valley tourist complex, but most of all, the chaotic buildings in Padiş (with woo<strong>de</strong>n,<br />
cardboard or tin boxes – in different <strong>de</strong>gradation stages, or small shop booths), lots of second<br />
homes built in the proximity of Fântânele Lake, Vârtop, Gârda, Horea Gla<strong>de</strong> etc.<br />
- <strong>de</strong>struction of flora and fauna. Environmental pollution and the reduced natural spaces are<br />
responsible for a reduced biodiversity by altered and fragmented habitats and the attendance<br />
excessive use of the natural areas drives to disappearance of animal and vegetal species as a result<br />
of tourists conduct (negligence, vandalism, stepping on vegetal cover, abusive picking of berries,<br />
setting up fires at random etc.). We should mention that, in the camping areas, the vegetal cover<br />
suffers a lot because of the <strong>de</strong>nsity of „fires”, technically almost at every tent entrance there is a<br />
bigger or smaller fire (<strong>de</strong>pends on the taste and the fuel used). Vandalism is a not insignificant<br />
negative consequence of tourism activities. For example in the proximity of the BorŃig pithole a<br />
<strong>de</strong>licate flower still appears from place to place (lilly of the forest - Lilium martagon) which is<br />
picked by tourists, pulled out by their roots (it won`t even resist a few days until they get home !).<br />
As we have mentioned above, there are lots of traces of cigarette ash on the ice block of Scărişoara<br />
or many trees with different messages „tattooed” on their trunks... We mustn`t forget the fish<br />
poaching and trout is in great <strong>de</strong>mand.<br />
Another example of tourists` uncivilized behaviour is the great number of ATVs and<br />
snowmobiles „by which some visitors leave the permitted access paths and seek for sectors with<br />
more thrill” (ANP Adm., 2007). These practices are difficult to control and have a high<br />
<strong>de</strong>structive potential (both physical and aesthetic) by damaging paths and walking trails,<br />
increasing erosion on slopes and grasslands <strong>de</strong>gradation. Their noise is incomparably greater<br />
than that of cars and it disturbs wild animal populations.
350<br />
Ribana Linc, Stelian NISTOR, David TURNOCK<br />
- landscape <strong>de</strong>gradation. Plunging in equipment and mo<strong>de</strong>rn infrastructure often draws<br />
along an aesthetic <strong>de</strong>gradation of landscape. On the one hand the style and architecture of those<br />
implants isn`t always in harmony with traditional buildings nor at the due scale and on the other<br />
hand tourism <strong>de</strong>velopment is sometimes anarchic and dispersed, thus <strong>de</strong>grading landscapes.<br />
Without further comments, the locations mentioned above (Boga holiday village but most of all<br />
Padiş) are <strong>de</strong>formed by such buildings which do not integrate architecturally and tire the eye with<br />
their bright colours or <strong>de</strong>gradation and obsolescence, thus producing a visual pollution.<br />
- overcrowding effect. The concentration in space and time of the tourist sojourns brings to<br />
overcrowding and overloading of the tourist structures and infrastructures that harm the environment<br />
and the quality of life. In the Apuseni Natural Park that is the situation especially during summer and<br />
mostly in July-August when, in the allowed camping places (and not only) there is an enormous<br />
<strong>de</strong>nsity of tent, circulation on walking trails is crow<strong>de</strong>d, and many times tourists almost bump in each<br />
other. However during the last years, maybe as a result of the economic crisis, the number of tourists<br />
has dropped dramatically, which has reduced a bit the human tourist pressure in the park (figure 7).<br />
Another aspect of this point of view is weekend traffic congestions that cause air and noise pollution<br />
and increased energy consumption (petrol or diesel). In winter the area Vârtop-Arieşeni is the most<br />
crow<strong>de</strong>d because of winter sports and the easy access on DN 75.<br />
The ina<strong>de</strong>quate behaviour of a tourist is frequently used as an excuse by others, thus<br />
producing a casca<strong>de</strong> of cumulate <strong>de</strong>struction to the habitats and nature in general. These<br />
manifestations haven`t been controlled much up to the present. There are a few spots on the park<br />
territory where all those problems cumulate: Glăvoi Gla<strong>de</strong>, Padiş Plain, Boga Valley, Sigiştelului<br />
Valley, RăchiŃele Casca<strong>de</strong> etc. The uncivilized<br />
conduct of the tourists has also a major negative<br />
impact on the frail subterranean environment. We<br />
cannot forget about the theft of the „stone flowers”<br />
(crystals, stalactites, stalagmites etc.) sold on a<br />
flourishing black market and about the disappearance<br />
of the „petrified footprints of the Nean<strong>de</strong>rthal man” in<br />
Vârtop Cave, which is by now history. Some of the<br />
caves are true ossuaries that allow researchers the<br />
acces to a rich and well preserved material,<br />
represented by cave bear (Ursus spelaeus), along with<br />
other bone pieces that belong to hyena and cave lion<br />
etc (Bears, Măgura Cave, Micula`s, Onceasa Caves)<br />
(Onac, 2000). But the wi<strong>de</strong>r access of tourist masses<br />
brings this thesaurus to consi<strong>de</strong>rable damages.<br />
A systematic inventory of the ANP caves hasn`t<br />
been ma<strong>de</strong> yet, and even less for the cave fauna; there<br />
are only punctual pieces of information for some of the<br />
known caves. Protecting this fauna (which in some<br />
caves inclu<strong>de</strong>s en<strong>de</strong>mic species of insects or strictly<br />
protected species of bats), is possible only by strict<br />
records of tourists` access in those cavities and not only<br />
Figure 7. In the summer of 2010, the<br />
lodging pressure on Glăvoi Gla<strong>de</strong> is<br />
much reduced compared with former<br />
years. As we can see, there are a lot of<br />
vehicles<br />
(Source: L. Nistor - taken from helicopter)<br />
there. In 2006 - 2007, the ANP Adm. Has established<br />
an approval system for the spelean activities in the park;<br />
it works quite well and most of the tourists who practice<br />
caving in the park area make use of a punctual or<br />
periodic approval. The results are collected through<br />
reports and inclu<strong>de</strong>d in the park data base.<br />
In august 2009 and august 2010 when the top of<br />
the tourism activities is recor<strong>de</strong>d in Padis, we applied
Aspects Regarding the Environmental Impact of Tourism Activities in the Apuseni Natural … 351<br />
some questionnaires to tourists available for this activity.<br />
Some of the key questions refer to the „personality” of the ANP (e.g. : „are you familiar<br />
with the significance of a natural park?”, or „do you consi<strong>de</strong>r the ANP a tourist attraction?”),<br />
and also to the opportunity to <strong>de</strong>velop mass tourism by building large scale real estate (e.g. „how<br />
do you think tourist activities affect the general and particular quality of the ANP?” or „do you<br />
agree with the <strong>de</strong>velopment of a tourism resort in Padiş?” or „what do you think is the role of<br />
rural communities situated in the park vicinity?”).<br />
Regarding the geographical personality of the Apuseni Natural Park, most of the<br />
respon<strong>de</strong>nts answered that it has unique, with wild landscapes, great diversity and beauty, but they<br />
had no i<strong>de</strong>a of what a natural park is. However, at the other aspect almost all (90%) answered<br />
categorically that mass tourism will <strong>de</strong>stroy the beauty of the region but some investments are<br />
nee<strong>de</strong>d to create ecological toilets and clean the park (that is to clear off the garbage). Again, they<br />
new nothing about the role of the communities surrounding the park.<br />
LATENT (OR NOT) CONFLICT SITUATIONS<br />
Regions that benefit from a quality environment, favourable to tourism <strong>de</strong>velopment are<br />
facing the following dilemma: either they encourage the <strong>de</strong>velopment of this economic activity<br />
and therefore must accept some <strong>de</strong>gradation of the environment or, on the contrary, give propriety<br />
to preserving the environment and give up the potential revenue from tourism. This problem is<br />
acute in economically disadvantaged area where the environment quality is the only exploitable<br />
source and this is the case of many mountain regions.<br />
The Apuseni Natural Park is an inhabited area and people must earn their living in one way<br />
or the other. Before the 90swords like „rural tourism, eco-tourism, sustainable <strong>de</strong>velopment etc”<br />
weren`t used very often and tourist activities in mountain areas (except the consecrated resorts like<br />
Prahova Valley or Stâna <strong>de</strong> Vale (Bihor County) were reduced.<br />
After the official pronouncement of the Apuseni Natural Park, the mountains inhabitants<br />
were forced to give up their old and pretty good income source which was forestry (after the<br />
Revolution in 1989 timber theft has become a mass activity for many rural communities, thus<br />
supplementing their income especially when Romanian economy was slowly but surely<br />
collapsing). At that point a hid<strong>de</strong>n conflict started to smoul<strong>de</strong>r. On the other hand, the<br />
<strong>de</strong>velopment of tourism infrastructure - especially accommodation - was favoured and „real estate<br />
projects that kept at the limit of the law” gained ground (www.jurnalul.ro/stire-<strong>de</strong>scoperirearomaniei-08/gunoaiele-apusenilor).<br />
More recent are the conflicts between tourism <strong>de</strong>velopers and nature <strong>de</strong>fen<strong>de</strong>rs who fight<br />
for stopping this economic activity. One of the locations most argued on is Padiş where until<br />
recently there were a few poorly maintained houses and boxes and an un<strong>de</strong>veloped campsite.<br />
After 2000 after the Romanian economy recovered a little, the interest in this magical land has<br />
grown dramatically and lots of unauthorized odd looking kiosks, terraces and accommodation<br />
buildings (boxes, a hut). More recently S.C. Compania <strong>de</strong> Turism, Hoteluri şi Restaurante Padiş<br />
S.R.L. (CTHRP) - the local tourism company, has a real estate un<strong>de</strong>rtaking of wi<strong>de</strong> scope along<br />
the forest road that leads to Ic Ponor, which is building a mountain ski resort with 2,000 beds and<br />
the entire related infrastructure and has already purchased 86 hectares of land in the heart of the<br />
park, near a strictly protected area (research reservation - Molhaşurile <strong>de</strong> la Izbuce).<br />
In or<strong>de</strong>r to obtain the necessary approvals, this project had to pass through the ANP<br />
Administration Advizory Council which inclu<strong>de</strong>s all the administration of the communes on the<br />
park land) and the gauntlet of the Scientific Council. The promoters of the project say that to the<br />
date it passed the Advisory Council (December 2007), they had already invested 2 million euro<br />
and they wanted to change the „strictly protected area” statute in „sustained <strong>de</strong>velopment area”.<br />
Although it passed the Advisory Council, the project hasn`t pass the Scientific Council so for the<br />
moment it is stuck at the Ministry of Environment and Forests.
352<br />
Ribana Linc, Stelian NISTOR, David TURNOCK<br />
At one point, citing the massive attack of bark beetle (Ips typographus) in the park forests,<br />
the mayors of five Bihor communes situated on the park land submitted a memorandum in which<br />
they <strong>de</strong>mand among other things the annulment of the park (!) on the ground that the right of<br />
property was not respected (and thus they are unable to use their grasslands and forests as they<br />
please!). It is interesting that so violent reactions from local communities were only registered in<br />
the Bihor part of the park, the other two sectors (Cluj and Alba Counties) have a relatively good<br />
collaboration between the ANP Administration and the locals, especially in agro-tourism and rural<br />
tourism. This proves that striving for Padiş is far from an end, especially since legislation changes<br />
frequently and allows smart lawyers to make interpretations freely.<br />
HOWEVER, THERE IS HOPE FOR CIVILIZED MOUNTAIN TOURISM<br />
Leaving asi<strong>de</strong> the discussions and nebulous confrontations on mass tourism <strong>de</strong>velopment in<br />
the park perimeter, we should mention that there are also initiatives for a <strong>de</strong>cent tourism<br />
<strong>de</strong>velopment and promotion.<br />
Thus, in October 2009, The Apuseni Natural Park was awar<strong>de</strong>d at the Gala Awards EDEN<br />
(European Destinations of Excellence) from Brussels http://ziua<strong>de</strong>cj.realitatea.net/eveniment/eveniment -<br />
parcul-national-apuseni-<strong>de</strong>stinatie-<strong>de</strong>-excelenta-a-romaniei-16206.html). The European Union has<br />
<strong>de</strong>clared the Apuseni Natural Park a tourism <strong>de</strong>stination of excellence and consequently, it will<br />
benefit from tourism promotion in Europe, have its own web page on the official EDEN web site and<br />
will be inclu<strong>de</strong>d in the European Destinations of Excelence, which facilitates experience exchange.<br />
The main objective of the EDEN project is to promote sustainable tourism <strong>de</strong>velopment mo<strong>de</strong>ls.<br />
Then there is another project in progress, in Pietroasa commune, on the valleys of Aleu<br />
and Crisul Pietros, where a group of 25 American investors have purchased 120 hectares of<br />
land and intend to set up a holiday village with boarding houses and rustic holiday homes,<br />
trout farm, swimming pools etc.: „…the tourism mo<strong>de</strong>l that is to be practiced in this part of<br />
the Apuseni Mountains is based on that given by the hospitality industry of the American state<br />
North Carolina where the emphasis is on closeness to nature" (Radu łârle, Presi<strong>de</strong>nt of the<br />
Bihor County Council, Nov. 2010). It is true that until now, this beautiful intention<br />
materialized only in purchasing the land and fencing, and rumours suggest that this much<br />
trumpeted intention is not going to be put into practice. In fact, two investors from Bihor risked<br />
and invested in rural tourism in 2005, in the same valley, by building two huts and a trout farm on<br />
the site of the former school camp, but dropped it in favour of the American investors.<br />
In the area of Gârda, since 2000 projects have been running on the subject of Arnica<br />
Montana (a herb related to camomile and sunflower) which lives in the park and is consi<strong>de</strong>red<br />
„queen of herbs” (www.jurnalul.ro/campaniile-jurnalul/jurnalul-national/necunoscuta-nouaapreciata-in-europa).<br />
Albert Rief, the coordinator of the first project related to arnica, after his peregrinations in<br />
the Apuseni Mountains, inten<strong>de</strong>d to set up a small ethnography museum in the hamlet of GheŃar,<br />
next to the cave entrance, which could function also as a tourist information centre but it proved to<br />
be very hard to find popular craftsmen to build savin covered houses because this traditional<br />
occupation has disappeared in the region of the motzi. Now he has another project which is to<br />
establish a traditional household where tourists could see how the people lived around here.<br />
Following another protection and conservation project in implementation until 2011<br />
initiated by the Centre for Environment Initiative from Cluj Napoca, 37 caves in the ANP are<br />
going to became tourist <strong>de</strong>stinations. This project aims to improve the park management plan,<br />
the conservation of the 37 caves and their technical endowment nee<strong>de</strong>d for surveys and<br />
mapping for each of them as well as 15 projects to imitate the access in through gates. These<br />
are extremely valuable caves, in some of them access is only permitted for research. Some of<br />
the 37 caves that need a high <strong>de</strong>gree of protection are Bears Cave, Fortress of Ponor, Piatra<br />
Altarului, Onceasa, Focul Viu Glacier, Humpleu Cave, Scărişoara Glacier etc<br />
(www.ziare.com/articole/ parcul+national+apuseni).
Aspects Regarding the Environmental Impact of Tourism Activities in the Apuseni Natural … 353<br />
CONCLUSIONS<br />
Although it is a protected area which has a relatively good management plan, the area of the<br />
ANP confronts with serious problems related to mass tourism activities. The Bihor sector of the<br />
park gives the greatest problems and most difficult to manage because the greatest <strong>de</strong>nsity of valuable<br />
natural tourist attractions is here, so that the fights for the possession of Padis area are fierce too. And<br />
the elected representatives of the rural communities are very much against the i<strong>de</strong>a of integral protection<br />
which doesn`t seem to be in line with their <strong>de</strong>velopment strategies. We also believe that as long as the<br />
ANP is un<strong>de</strong>r the „guardianship” of the National Forest Authority, many of the „historical state of<br />
facts” won`t be solved un<strong>de</strong>r the excuse of their great interest in the park forests and will leave the<br />
tourist activities and even their negative impact asi<strong>de</strong>.<br />
In addition, the broa<strong>de</strong>ning and mo<strong>de</strong>rnization of the access road from the commune of<br />
Pietroasa (Bihor) to Padiş (DJ 763 Sudrigiu-Pietroasa-Padiş Hut) (with European structural funds!)<br />
is not a good sign for the future of the park as a nature preservation area as it will facilitate the<br />
increased motorized access of crowds of tourists and cars and indirectly sooner or later, the<br />
appearance of a tourist resort.<br />
Finally, we wish to thank Mr. Ne<strong>de</strong>lcu for his permanent courtesy of providing the mapping support.<br />
REFERENCES<br />
Abrudan I., Turnock D. (1999), A rural <strong>de</strong>velopment strategy for the Apuseni Mountains, Romania, GeoJournal 46, 319-336 p;<br />
Bleahu M. (2004), Arca lui Noe în secolul XXI. Arii protejate şi protecŃia naturii, Editura NaŃional, Bucureşti, 509 p;<br />
Buza M., Dimen L., Pop P. Gr., Turnock D. (2001), Environmental protection in the Apuseni Mountains: the role of<br />
Environmental Non-Governamental Organisations (ENGOs), GeoJournal, 55, Ed. Springer, 631-653 p;<br />
Damm P., Perényi K., Pop C., Szőcs Sz., Zih J. (1996), Consi<strong>de</strong>raŃii asupra peşterii din Valea Rea, rev. Cercetari<br />
Speologice, Bucuresti, 21-23 p;<br />
Deszi Şt., Ciangă N., Rotar Gabriela (2002), Consi<strong>de</strong>raŃii privind impactul turismului asupra mediului înconjurător şi riscurile<br />
induse <strong>de</strong> activităŃile turistice, în vol. „Riscuri şi catastrofe”, Editura Casa CărŃii <strong>de</strong> ŞtiinŃă, Cluj Napoca, 155-165 p;<br />
Linc Ribana (1998), Padişul: laborator geografic, Analele UniversităŃii din Ora<strong>de</strong>a, Geografie, Tom VIII, Ora<strong>de</strong>a, 195-206 p;<br />
Marossy Ana (1975), Importanta şi perspectiva unui parc naŃional în Muntii Apusen, în Lucrările celui <strong>de</strong>-al II lea<br />
Colocviu National <strong>de</strong> Geografia Turismului, Editura Sport-Turism, Bucureşti, 137-140 p;<br />
Moş A. (2008), Apuseni Nature Park - a park for nature and people, rev. Analele UniversităŃii din Ora<strong>de</strong>a, seria Geografie, Tom XVIII, 21- 26 p;<br />
Onac B. (2000), Geologia regiunilor carstice, Editura Didactică şi Pedagogică, Bucureşti, 399 p;<br />
Perşoiu A. (2003), Periglacial processes and phenomena in Scarisoara Ice cave, National Session of Scientific Papers, Timisoara;<br />
Pop Cr. şi colab. (1997), Zona turistică Padiş - monografie, Editia a II-a, Editura Chrysopeea Press, 36 p;<br />
Silvestru E., Ghergari Lucretia (1994), On the Paleokarst in the Cave Ghetarul <strong>de</strong> la Scarisoara (Bihor Mountains,<br />
Romania), Theoretical and Applied Karstology, Bucureşti, 7, 155–161 p;<br />
Surd V. (1992), Sistemele <strong>de</strong> asezări din MunŃii Apuseni, Studia Universitatis Babeş-Bolyai, Seria Geographia 50, 285-304 p;<br />
Surd V., Turnock D. (2000), Romania’s Apuseni Mountains: safeguarding a cultural heritage, GeoJournal 50, 285-304 p;<br />
***<br />
(1980), L’impact du tourisme sur l’environnement, Rapport general, OCDE, Paris, 110 p;<br />
***<br />
(2003), HG 230 /2003 privind <strong>de</strong>limitarea rezervaŃiilor biosferei, parcurilor naŃionale şi parcurilor naturale şi<br />
constituirea administraŃiei acestora, Monitorul Oficial, nr. 190 din 26. 03. 2003;<br />
*** OUG 57/2007 privind regimul ariilor naturale protejate, conservarea habitatelor naturale, a florei şi faunei sălbatice,<br />
Monitorul Oficial, nr. 442 din 29 iunie 2007;<br />
***<br />
Legea 49/2011 privind regimul ariilor naturale protejate, conservarea habitatelor naturale, a florei şi faunei sălbatice,<br />
Monitorul Oficial, nr. 262 din 13 aprilie 2011;<br />
***<br />
(2007), Planul <strong>de</strong> management al Parcului Natural Apuseni, AdministraŃia Parcului Natural Apuseni (PNA), jud. Bihor;<br />
***<br />
http://ww.natgeo.ro/explorari/speologie/8350-frigi<strong>de</strong>rele-<br />
***<br />
http://www.jurnalul.ro/stire-<strong>de</strong>scoperirea-romaniei-08/gunoaiele-apusenilor<br />
***<br />
http:// www.humpleu.ro/pesteri.html<br />
***<br />
http:// ro.wikipedia.org/wiki/Pe%C8%99tera-aven_ghe%C8%9Barul_<strong>de</strong>_sub_Zgur<br />
***<br />
http://www.experience-romania.ro/Pestera_Coliboaia<br />
** * http://www.ebihoreanul.ro/stiri/ultima-or-31-1/picturile-din-pestera-coliboaia-unice-in-europa-centrala-si-<strong>de</strong>-est-96610.html<br />
***<br />
http://www.a<strong>de</strong>varul.ro/actualitate/social/Cele_mai_vechi_<strong>de</strong>sene_din_lume-intr-o_pestera_din_Bihor_0 _546545942.html)<br />
***<br />
http://www.jurnalul.ro/campaniile-jurnalul/jurnalul-national/necunoscuta-noua-apreciata-in-europa<br />
***<br />
http://ziua<strong>de</strong>cj.realitatea.net/eveniment/eveniment-parcul-national-apuseni-<strong>de</strong>stinatie-<strong>de</strong>-excelenta-a-romaniei-16206.html<br />
***<br />
http:// www.ziare.com/articole/parcul+national+apuseni<br />
Submitted: Revised: Accepted and published online<br />
August 25, 2011 November 15, 2011 December 05, 2011
Analele UniversităŃii din Ora<strong>de</strong>a – Seria Geografie Year XXI, no. 2/2011 (December), pp. 354-362<br />
ISSN 1454-2749, E-ISSN 2065-1619 Article no. 212121-545<br />
MEANS OF CABLE TRANSPORTATION. AN INFRASTRUCTURAL<br />
COMPONENT OF THE GEOGRAPHICAL LANDSCAPE OF ALBAC -<br />
ARIEŞENI TERRITORIAL SYSTEM<br />
Maria GOZNER ∗<br />
University of Ora<strong>de</strong>a, Department of Geography, Tourism and Territorial Planning – TSAC,<br />
1 University St., 410087, Ora<strong>de</strong>a, Romania, e-mail:mariagozner@yahoo.com<br />
Ştefan BAIAS<br />
University of Ora<strong>de</strong>a, Department of Geography, Tourism and Territorial Planning – TSAC,<br />
1 University St., 410087, Ora<strong>de</strong>a, Romania, e-mail: baias_stefan@yaho.com<br />
Abstract: A part of the touristic infrastructure is represented by cable or mechanic means<br />
of transportation, closely connected to the touristic <strong>de</strong>velopment of mountain areas. Cable<br />
transport is a means of transportation sought exclusively during touristic activities. It is<br />
used as an access route for mountain areas equipped with ski slopes. Ski slopes and cable<br />
transport play a fundamental role in the <strong>de</strong>velopment of the mountain tourism industry.<br />
They represent the essential foundation of winter offers and their execution must be<br />
accomplished prior to that of other types equipment (accommodation, leisure, dining). By<br />
increasing the number of functional ski slopes, the touristic <strong>de</strong>velopment of the Arieşeni<br />
skiable area is meant to enhance the touristic potential of this village, especially during the<br />
winter season. Another element of this <strong>de</strong>velopment is the extension of the touristic season<br />
during winter by using artificial snow machines which allow skiing during periods with<br />
insufficient snow fall. Increasing the number of slopes and extending of the tourist season<br />
should also accomplish the expansion of the targeted geographical area from which tourists<br />
originate. The total length of the routes in the Albac - Arieşeni territorial system which rely<br />
on cable transport is of 2750 m while the potential transport capacity is of 2400 persons per<br />
hour. The Albac - Arieşeni territorial system relies on three means of cable transport.<br />
Key words: ski slopes, means of transportation, cable transport.<br />
* * * * * *<br />
INTRODUCTION<br />
The only means of transportation sought exclusively by the tourism industry is cable<br />
transport, used as a rapid access route to mountain areas and especially skiable areas equipped<br />
with ski slopes (Ciangă, 1997).<br />
The Albac - Arieşeni territorial system is inclu<strong>de</strong>d in the administrative division of Alba<br />
County, being located in its north-western extremity at the convergence of two mountain systems:<br />
Bătrâna Mountains in the north and Biharia Mountains in the south, connected by Vârtop Pass<br />
(1160 m). Bătrâna Mountains and Biharia Mountains (figure 1) represent the central sector of<br />
∗ Corresponding Author<br />
http://istgeorelint.uora<strong>de</strong>a.ro/Reviste/Anale/anale.htm
Means of Cable Transportation. An Infrastructural Component of the Geographical... 355<br />
Apuseni Mountains and are limited by the river Someşul Cald in the north as well as by the river<br />
Arieşul Mic in the south (Pop, 2000; Enciclopedia Geografică a României, 1982).<br />
Cable transport<br />
The execution of means of cable transport entails a series of constructions which modify<br />
the surrounding landscape. Ski tows and chairlifts require, prior to their emplacement, a<br />
<strong>de</strong>forestation of the area, <strong>de</strong>ep and strong foundations for their support poles so that they sustain a<br />
heavy charge. The protection requirements are multiple: ending the advance of projects which<br />
affect the environment, carrying out impact studies, a clear <strong>de</strong>limitation drawn up for soil<br />
occupation plans, the <strong>de</strong>limitation of protected areas, of natural parks and of reservations<br />
(BăltăreŃu, 2010). More than any other industry, tourism is <strong>de</strong>pen<strong>de</strong>nt on the environment, it<br />
actually represents the main resource and its quality can promote or hin<strong>de</strong>r the <strong>de</strong>velopment of<br />
tourist activities (Cân<strong>de</strong>a et al., 2003).<br />
Figure 1. Geographical position of the Albac - Arieşeni territorial system<br />
as part of Apuseni Mountains and Bihorului Mountains
356<br />
Maria GOZNER, Ştefan BAIAS<br />
In the case of travel system-Albac Arieşeni the main problem <strong>de</strong>rives from the dualism of the area used<br />
for tourism / territory protected from human activities. The resulting state of conflict is due to the uniform<br />
strategy of intervention in the structure of the actors involved both in the public and private sectors, and<br />
especially of the goals <strong>de</strong>clared / un<strong>de</strong>clared non synchronous confused and those who <strong>de</strong>al with planning and<br />
maintenance of the territory on the one hand and those who exploit economically the same geographic area.<br />
Component proreaction join them and is almost nonexistent, although the structure should be part of the strategy<br />
<strong>de</strong>veloped by the first category (Gozner and Avram, 2010). In or<strong>de</strong>r to construct the ski slopes as well as the<br />
means of cable transport that they rely upon, the slopes envisaged should be predominantly north-oriented and<br />
situated at altitu<strong>de</strong>s of over 1000 - 2000 meters. The ski slopes and the corridors which accompany the means of<br />
cable transportation should be as wi<strong>de</strong> as 20 to 30 meters (Ciangă and Axente, 1996).<br />
Figure 2. Slopes Vârtop I and II<br />
Figure 3. Vârtop I Slope Ski tow
Means of Cable Transportation. An Infrastructural Component of the Geographical... 357<br />
The analyzed mountain area provi<strong>de</strong>s scarce examples of cable transport. Two functional ski<br />
slopes are found in Vârtop (Arieşeni commune, Bubeşti village). Vârtop I Slope (figure 2), also referred<br />
to as the Big Slope relies on a ski tow with a capacity of 680 persons per hour while Vârtop II Slope<br />
(figure 3), also called the Small Slope relies on a ski tow with a capacity of 320 persons per hour<br />
(General Urban Plan Arieşeni). The Big Slope is 720 m long, 90 m long, measures a 220 meters slope<br />
of the land and is rated as red (intermediate) in what concerns its difficulty. It is equipped with night<br />
lighting (orange lights) along its length as with ski-slope maintenance machinery. The Small Slope is<br />
430 m long, 50 m wi<strong>de</strong>, measures a 101 meters slope of the land and is rated blue (easy trail) in what<br />
concerns its difficulty. It is also equipped with night lighting but its lights are white, similar to natural<br />
light, as well as with ski-slope maintenance machinery.<br />
Figure 4. Piatra Grăitoare Slope<br />
Piatra Grăitoare (Speaking Rock) Slope (figure 4) is situated near Vârtop I Slope, at the<br />
distance of a 5 minutes’ walk through the woods. It is oriented towards the west-northwest<br />
and is situated on the si<strong>de</strong> of Vârtop Pass which is inclu<strong>de</strong>d in the administrative territory of<br />
Bihor county. The slope is 1600 meters long, and it offers three alternative trails, rated with<br />
different levels of difficulty (blue, red and black), relying on a mo<strong>de</strong>rn four-seat chairlift. The<br />
execution of the three new different slopes at Arieşeni-Vârtop has been completed at the<br />
beginning of December 2010. They are equipped with night lighting and a chairlift (figure 5)<br />
with a capacity of 1400 persons per hour, measuring 1095 meters in length.<br />
Figure 5. Piatra Grăitoare Slope Termina
358<br />
Maria GOZNER, Ştefan BAIAS<br />
The construction of the slopes is financed by Nucet’s local administration and by Bihor<br />
county’s Regional Council as part of the project „Skiing in Romania” which is subsidized by the<br />
Ministry of Regional Development and Tourism.<br />
A two-level parking (figure 6) has been constructed at the base of the Piatra Grăitoare<br />
Slope. Unfortunately, it does not fully resolve the need for parking space.<br />
Figure 6. Piatra Grăitoare Slope parking and chairlift<br />
The three slopes (figure 7) are situated at the convergence of Alba County and Bihor<br />
County’s bor<strong>de</strong>rs. They are quite accessible due to National Road 75 which runs across their base,<br />
as they are the most renowned ski slopes of the Apuseni Mountains.<br />
Figure 7. Vârtop slopes (Arieşeni)
Means of Cable Transportation. An Infrastructural Component of the Geographical... 359<br />
The regular skiing season starts in December and ends in March. At the beginning of<br />
each year The Snow Celebrations (Serbările Zăpezii) are organized. Near the two ski slopes, a<br />
sleigh slope is also constructed. Next to the Vârtop slopes, snowmobiling, sleighing and<br />
paragliding are practiced.<br />
The North Star (Steaua Nordului) Slope is situated in Albac and until 2009, this was a slope<br />
that some consi<strong>de</strong>red „European”. It passed through the households of resi<strong>de</strong>nts living in the area,<br />
accompanied by its ski tow, night lighting and artificial snow machinery. The track was short, it<br />
had a southern orientation and a reduced level of difficulty. It was transformed into a learning<br />
slope until the investor realized that no one would use it and closed it in the end. The construction<br />
of ski slopes has started in Gârda <strong>de</strong> Sus commune. The gradient is favorable, the <strong>de</strong>gree incline is<br />
constant and cable transportation will be ensured by a reused chairlift (figure 7).<br />
Figure 8. Reused chairlift in Gârda <strong>de</strong> Sus commune<br />
The project foresees three slopes: a 1100 m one, a second one measuring 1600 m and a<br />
third one, 2000 m long. The local administration has provi<strong>de</strong>d the land while the investor finances<br />
the project. A ski bus (figure 8) will ensure the transport of tourists across the impressive Arieş<br />
Valley, following the route Albac, Scărişoara, Gârda <strong>de</strong> Sus, Arieşeni-Vârtop. The eco bus has<br />
already been acquired and it awaits its future usage.<br />
Figure 9. The slope and ski bus of Gârda <strong>de</strong> Sus commune<br />
Besi<strong>de</strong>s the possibility of ruining the natural beauty of the region, this project is also<br />
disadvantaged by an altitu<strong>de</strong> (735 m) which is somewhat unfavorable to snow durability. By<br />
comparison, the Arieşeni-Vârtop slopes reach as high as 1200 meters in altitu<strong>de</strong>.<br />
The inauguration should have taken place in 2009 yet it was <strong>de</strong>layed, presumably due to the
360<br />
Maria GOZNER, Ştefan BAIAS<br />
recession. The locals hoped that the new slopes would be put to use at the beginning of the 2010-<br />
2011 winter season. Unfortunately, another winter has passed and this project is still on hold.<br />
An similar investment is proposed in Bubeşti - Arieşeni. Five slopes will be constructed in<br />
the Vârtop-Gălăşoaia-Bubeşti area, equipped with two chairlifts and a ski tow. A parking lot will<br />
be situated at the base of each of the main slopes.<br />
A.<br />
B.<br />
Figure 10. Slope proposals for Bubeşti (Arieşeni)<br />
(Source: Google Earth ren<strong>de</strong>r (A), Ortophotoplan 1:5000 adaptation (B)<br />
Bubeşti 1 slope will be around 2700 m long and will stretch between Vârful Cornul<br />
Berbecului Peak and Bubeşti-Arieşeni village. Bubeşti 2 slope will be approximately 2100 m long,<br />
stretching between Cornul Berbecului Peak and Bubeşti village, an alternative <strong>de</strong>scent to the<br />
skiers climbing up to Cornul Berbecului Peak.
Means of Cable Transportation. An Infrastructural Component of the Geographical... 361<br />
In or<strong>de</strong>r to reach the top of these slopes, tourists will climb from Vârtop by chairlift or they can<br />
choose to climb from Bubeşti. Bubeşti 1 and Bubeşti 2 slopes start at Cornul Berbecului Peak at an<br />
altitu<strong>de</strong> of 1600 m, while the finish line is situated at 1080 m. The two slopes will rely on a mo<strong>de</strong>rn,<br />
high-capacity chairlift. Gălăşoaia-Bubeşti Slope will connect Cornul Berbecului, Vârtop and Bubeşti<br />
slopes. It can also be used as an alternative <strong>de</strong>scent, as its level of difficulty is lower. However, it does<br />
not directly rely upon a cable transport installation. Gălăşoaia-Bubeşti and Gălăşoia slopes will be rated<br />
as intermediate in what concerns their level of difficulty thus being preferred by most skiers.<br />
Figure 11. Slope proposals for Bubeşti (Arieşeni), topographic map 1:100,000 adaptation<br />
Gălăşoaia slope will be the shortest one and will rely upon a chairlift. In this case,<br />
Gălăşoaia-Bubeşti slope can be chosen by skiers as an alternative <strong>de</strong>scent. Cornul Berbecului<br />
slope will be the longest, as its planned length is of 3000 meters.<br />
The upper half of this slope has a high <strong>de</strong>gree of difficulty while its lower half is consi<strong>de</strong>red<br />
intermediate. It will rely on a chairlift which will have a terminal at the meeting point with<br />
Gălăşoaia slope and one at the highest point of the slope.<br />
Chairlifts will be installed for Bubeşti-Cornul Berbecului and Vârtop-Cornul Berbecului<br />
routes. In the latter case, an intermediate terminal will be located at the intersection of Cornul<br />
Berbecului and Gălăşoaia slopes. The cable transport installation is a four person fixed-grip<br />
chairlift which consists of numerous chairs attached to a constantly moving wire rope. The rope is<br />
stretched and flexed by the drive bullwheel which is located at the low end of the installation. The<br />
cable is supported well above the ground by towers equipped with pulley assemblies and access<br />
stairs for maintenance personnel. Four person chair carriers are connected to the cable at 37,4 m<br />
intervals. At a 14,40 second step, the installations moves at a 2,60 m/s speed, with a capacity of<br />
1000 persons per hour. The loading and disembarking of passengers is performed at an average<br />
rope-speed of 2,60 m/s (according to Bubesti - Vartop’s Zonal Spatial Plan- P.A.T.Z.)<br />
In or<strong>de</strong>r to increase the level of comfort provi<strong>de</strong>d to tourists as they embark at the bottom<br />
terminal, the loading area will be equipped with a moving platform and automatically opening<br />
doors. They are activated by sensors, opening and closing according to the proximity of carriers to<br />
the embarking area. Thus, as a chair approaches, the doors are opened, allowing the simultaneous<br />
entrance of four persons directly on the moving platform. This platform moves at a constant speed<br />
of 1.0 m/s so that passengers are seated at a relative speed of 2,6 - 1,0 = 1,6 m/s.
362<br />
Maria GOZNER, Ştefan BAIAS<br />
Besi<strong>de</strong> increasing the safety and comfort level of passengers as they embark, using a<br />
moving platform allows the chairlift to function at an increased speed (2,6 as opposed to 2,3 m/s),<br />
therefore reducing transportation duration as well as the total number of carriers simultaneously<br />
moving on the wire rope.<br />
In the case of the Cornul Berbecului ski tow, the drive terminal is located at the bottom<br />
of the installation while the return bullwheel is situated at the upper terminal. The bottom<br />
terminal which allows skiers to attach themselves to the rope is located at an altitu<strong>de</strong> of 1270 m,<br />
while the end terminal is situated in the Gălăşoaia area, at an altitu<strong>de</strong> of 1320 m, at the highest<br />
point of the slope. The route unites the two terminals in a straight line. The cable is supported by<br />
metal pillars equipped with rubber lined reels. Gălăşoaia slope will also be equipped with a ski<br />
tow (Bubeşti - Vârtop P.A.T.Z).<br />
CONCLUSION<br />
Each slope will measure an average width of 40-60 meters and will be equipped with<br />
artificial snow installations, snow leveling machines, ticket machines and parking lots. All slopes<br />
will use appropriate markings, conventional signs and protection nets, according to the<br />
specifications of the H.G. 263/2001, requirements which must be met in or<strong>de</strong>r to receive the<br />
approval of the national authority for tourism.<br />
However, compared to other such regions (such as Braşov and Prahova), the studied area is<br />
in shortage of cable transportation means.<br />
Due to the importance of tourism nowadays, it is necessary to find solutions for harnessing<br />
the natural and man-ma<strong>de</strong> resources of which can be achieved through a territorial tourism<br />
planning (Gozner, 2010). Tourism planning should be accomplished in relation to tourism<br />
<strong>de</strong>velopment and even economic progress but must take into account the requirements of the<br />
natural and human environment.<br />
AKNOWLEGMENTS<br />
The research was carried out within the framework of Project CNCSIS IDEI: PN II<br />
667/2008, coordinator Associate Prof. Dorina Camelia Ilies.<br />
REFERENCES<br />
BăltăreŃu Andreea Mihaela (2010), Amenajarea turistică şi <strong>de</strong>zvoltarea urbană, Editura Universitară Bucureşti;<br />
Cân<strong>de</strong>a Melinda, Er<strong>de</strong>li G., Simon Tamara, Peptenatu D. (2003), PotenŃialul turistic al României şi amenajarea turistică a<br />
spaŃiului, Editura Universitară, Bucureşti;<br />
Ciangă N. (1997), Turismul în CarpaŃii Orientali. Studiu <strong>de</strong> geografie umană, Editura Presa Universitară Clujeană, Cluj-Napoca;<br />
Ciangă N., Maria Axente (1996), Mijloace <strong>de</strong> transport pe cablu – componentă infrastructurală a peisajului geografic şi<br />
turismului carpatic, Studia UBB, Seria Geographia, XLI, 1-2, Cluj-Napoca;<br />
Gozner Maria (2010), Turismul în sistemul teritorial Albac - Arieşeni şi impactul acestuia asupra mediului, în Analele UniversităŃii<br />
din Ora<strong>de</strong>a, Fascicula ConstrucŃii şi InstalaŃii Hidroedilitare, vol. XIII- 2, Editura UniversităŃii din Ora<strong>de</strong>a, Ora<strong>de</strong>a;<br />
Gozner Maria, Avram Maria, (2010), SituaŃia rezervaŃiilor naturale din cadrul sistemului teritorial Albac – Arieşeni,<br />
Analele UniversităŃii din Ora<strong>de</strong>a, Seria Geografie, Editura UniversităŃii din Ora<strong>de</strong>a;<br />
Pop P. Gr. (2000), CarpaŃii şi SubcarpaŃii României, Editura Presa Universitară Clujeană, Cluj-Napoca;<br />
*** (1982), Enciclopedia Geografică a României, Ediura. ŞtiinŃifică şi Enciclopedică, Bucureşti.<br />
Submitted: Revised: Accepted and published online<br />
July 26, 2011 November 17, 2011 December 05, 2011
Analele UniversităŃii din Ora<strong>de</strong>a – Seria Geografie Year XXI, no. 2/2011 (December), pp. 363-369<br />
ISSN 1454-2749, E-ISSN 2065-1619 Article no. 212122-535<br />
USING GIS MODELING AND THE DAC STATISTIC TO ANALYZE THE<br />
SUSTAINABILITY OF DEVELOPMENT IN IALOMIłA<br />
HYDROGRAPHIC BASIN<br />
Ioan IANOŞ ∗<br />
University of Bucharets, Faculty of Geography, Interdisciplinary Center for Advanced Researches on Territorial Dynamics,<br />
CICADIT, Bucharest, Romania, e-mail: office@cicadit.ro<br />
Alexandru-IonuŃ PETRIŞOR<br />
„Ion Mincu” University of Architecture and Urbanism and Scientific Director for Urbanism and Territorial Development,<br />
National Institute for Research and Development in Constructions, Urbanism and Sustainable Spatial Development<br />
URBAN-INCERC, e-mail: alexandru_petrisor@yahoo.com, a.i.petrisor@gmail.com<br />
Abstract: Sustainable <strong>de</strong>velopment relies on three traditional pillars (economic, social, and<br />
environmental), to which a fourth cultural one was ad<strong>de</strong>d, and has a territorial dimension,<br />
resulting into the creation of sustainable communities. Measuring the sustainability of a given<br />
area relies on indices covering all these chapters. In an attempt to i<strong>de</strong>ntify the most relevant<br />
indices and pillars, this study uses similar analyses at the micro-scale level using<br />
administrative-territorial units covering the mountainous and sub-Carpathian space of an<br />
average sized hydrographic basin. The algorithm uses selected indicators reflecting the<br />
<strong>de</strong>nsity of population, its dynamics and migratory increase, el<strong>de</strong>r population, natality,<br />
unemployment, share of population working in agriculture, number of people who completed<br />
high school education, the number of physicians per 1000 people, and inhabited area per<br />
person. Data are analyzed using GIS mo<strong>de</strong>ling based on raw data and factor analysis, and the<br />
ordinary kriging interpolation of the values of the Drane - Aldrich - Creangă test. The results<br />
suggest that there are two „rich” zones, one in the mountain area and another close to the<br />
plain, while the poorer regions situate in between. This pattern is interrupted by the important<br />
communication routes, resulting into differentiated accessibility.<br />
Key words: factor analysis, kriging, GIS, in<strong>de</strong>x of <strong>de</strong>velopment, mo<strong>de</strong>ling<br />
* * * * * *<br />
INTRODUCTION<br />
Synthesizing the researches attempting to i<strong>de</strong>ntify solutions to the environmental issues a<br />
new concept emerged in 1987: sustainable <strong>de</strong>velopment, <strong>de</strong>fined as „<strong>de</strong>velopment that meets the<br />
needs of the present without compromising the ability of future generations to meet their own<br />
needs” (Brundtland, 1987). The concept relies on three traditional pillars (economic, social, and<br />
environmental), to which a fourth cultural one was ad<strong>de</strong>d later, and has a spatial dimension<br />
(Centrul <strong>de</strong> Cercetare, Proiectare, Expertiză şi Consulting, 2006; Petrişor, 2008b; Petrişor et al.,<br />
2010). Accounting in addition for the practical actions involved by its implementation, a more<br />
∗ Corresponding Author<br />
http://istgeorelint.uora<strong>de</strong>a.ro/Reviste/Anale/anale.htm
364<br />
Ioan IANOŞ, Alexandru-Ionuț PETRIŞOR<br />
comprehensive <strong>de</strong>finition is „use of natural resources within the carrying capacity limits, conservation<br />
of diversity, ecological restoration of <strong>de</strong>gra<strong>de</strong>d environmental system and environmental protection<br />
measures embed<strong>de</strong>d in sectoral <strong>de</strong>velopment policies, aiming to assess the impact and internalize<br />
eventual environmental costs” (Petrişor, 2009; Petrişor and Sârbu, 2010).<br />
The key to un<strong>de</strong>rstanding sustainable <strong>de</strong>velopment is the interconnection of traditional<br />
pillars (Bugge and Watters, 2003; Ianoş et al., 2011; Ilieş et al., 2010). Therefore, environmental,<br />
social and cultural policies must be part of the general and sectoral <strong>de</strong>velopment policies (Petrişor<br />
and Sârbu, 2010; United Nations, 1992). Spatially, sustainable <strong>de</strong>velopment must ensure a<br />
territorial balance of the satisfaction of economic, social and environmental needs of present and<br />
future generations at the same rate (Petrişor, 2008a), and provi<strong>de</strong> for the coherence of<br />
socioeconomic objectives reported to the territory and its environmental and cultural functions,<br />
aiming to improve the quality of present and future generations’ life by creating sustainable<br />
communities able to manage ant utilize resources efficiently, exploiting the innovative<br />
environmental and social potential of the economy while guaranteeing the prosperity,<br />
environmental protection and social cohesion (Colignon, 2009). Consequently, from a territorial<br />
perspective, sustainable <strong>de</strong>velopment leads to the creation of sustainable communities, <strong>de</strong>fined by<br />
the Bristol accord as „places where people want to live and work, now and in the future” (Office<br />
of the Deputy Prime Minister, 2006).<br />
Assessing the sustainability of <strong>de</strong>velopment for a particular territorial unit or region<br />
involves data on indices reflecting the different pillars (Dobrin et al., 2010a, b; Ianoş et al., 2010).<br />
One of the most commonly used methodologies relies on the utilization of Geographical<br />
Information Systems (GIS), <strong>de</strong>fined as „<strong>de</strong>cision support system involving the integration of<br />
spatially referenced data in a problem solving environment” (Cowen, 1988). However, the use of<br />
GIS can be enforced when used in conjunction with statistical methods (Tache et al., 2010) based<br />
on economic, social, and environmental indicators. In addition to the simple indicators, aggregated<br />
indices are computed based on arithmetic operations performed using individual indices, according<br />
to the statistical principle of Paul Benzecri: giving up some information to gain relevance<br />
(Dragomirescu and Drane, 2009).<br />
This aim of this study was to create and use a methodology for micro-scale level analyses<br />
of administrative-territorial units, i.e. about 40 communes covering the mountainous and sub-<br />
Carpathian space of an average sized hydrographic basin, attempting to pinpoints the most relevant<br />
indicator(s) of <strong>de</strong>velopment, even if artificially built, and map its spatial distribution.<br />
METHODS<br />
36 base administrative units (communes and cities) of DâmboviŃa County were selected<br />
based on the geographical location in the mountainous and sub-Carpathian area of IalomiŃa river<br />
basin. The corresponding database contained data on 15 indicators, presented in table 1.<br />
The first step consisted of using factor analysis based on principal components extraction in<br />
SPSS to i<strong>de</strong>ntify the most important indicators: the number of high school graduates and the<br />
population employed in agriculture (Ianoş and Petrişor, 2010).<br />
Using these results, GIS mo<strong>de</strong>ling was used to build an average in<strong>de</strong>x of <strong>de</strong>velopment for<br />
each administrative unit based on all the 15 indicators consi<strong>de</strong>red, and another one based only on the<br />
key indicators pinpointed by the factor analysis with weights ratioed to 100 % (82 %, respectively 18<br />
%). In the first case, the population employed in the agriculture had a weight equal to 8 %, the<br />
number of high school graduates had 14 %, and all other indicators 6 %. In the second case, the<br />
population employed in the agriculture had 18 % and the number of high school graduates 82 %.<br />
Two mo<strong>de</strong>ls, displayed in figure 1, were built using the indicators and weights mentioned before.<br />
Running the mo<strong>de</strong>ls resulted into maps displaying the level of <strong>de</strong>velopment in each administrative<br />
unit, evaluated on a 1 to 5 scale, with 1 pointing the lowest level, and 5 the highest.<br />
In the next step, the Drane - Aldrich - Creangă (DAC) test was used for an almost mathematical<br />
and over-generalizing analysis of the data. The DAC statistic was introduced in the statistical literature
Using GIS Mo<strong>de</strong>ling and the DAC Statistic to Analyze the Sustainability of Development … 365<br />
through a study by Drane, Creangă, Aldrich, and Hudson (Drane et al., 1995) in or<strong>de</strong>r to provi<strong>de</strong> an<br />
instrument to <strong>de</strong>tect spatial clusters, or, more generally, areas with health problems.<br />
Table 1. Descriptive statistics of the indicators used in the study, for the 15 base administrative units of<br />
DâmboviŃa County located in the mountainous and sub-Carpathian space of the IalomiŃa river basin.<br />
(Data source: Interdisciplinary Center of Advanced Research on Territorial Dynamics, University of Bucharest)<br />
Variable Minimum Maximum Average Std. <strong>de</strong>viation<br />
Total population 1747.00 15691.00 4927.91 2680.53<br />
Resi<strong>de</strong>nt population 1748.00 15552.00 4935.31 2664.13<br />
Livable area per inhabitant 28888.00 228805.00 70834.06 38242.60<br />
Incoming migration 0.00 256.00 63.51 52.27<br />
Outgoing migration 2.00 187.00 60.94 42.06<br />
Number of people with a TV set 412.00 3812.00 1332.14 666.18<br />
Number of pharmacies 0.00 6.00 0.63 1.14<br />
Number of physicians 0.00 50.00 4.00 8.24<br />
Population employed in the industry 21.00 1339.00 253.09 274.77<br />
Total number of employed people 75.00 4312.00 681.69 785.74<br />
Total number of unemployed people 9.00 1305.00 180.31 258.28<br />
Population employed in the agriculture 29.00 1338.00 408.40 287.44<br />
Active population 136.00 5166.00 1198.60 944.06<br />
Population age 65 and over 413.00 1946.00 872.23 365.06<br />
Number of high school graduates 155.00 3557.00 860.89 689.71<br />
Figure 1. Displaying the GIS mo<strong>de</strong>ls used to map the level of <strong>de</strong>velopment in the base administrative<br />
units (communes and cities) of DâmboviŃa County located in the mountainous and sub-Carpathian space<br />
of the IalomiŃa river basin. The 15-indicators based mo<strong>de</strong>l is displayed above, and the 2-indicators<br />
based mo<strong>de</strong>l below.<br />
(Source: GIS mo<strong>de</strong>l produced by the author)
366<br />
Ioan IANOŞ, Alexandru-Ionuț PETRIŞOR<br />
The computation of the DAC statistic is based on the empirical cumulative distribution function:<br />
F n (x 1 , x 2 ) = m(x 1 , x 2 ) / n (1)<br />
where m(x 1 , x 2 ) is the number of points of the sample of size n such that x 1 i ≤ x 1 and x 2 j ≤<br />
x 2 . As (x 1 , x 2 ) covers the entire sample from (0, 0) to (max x 1 , max x 2 ), m(x 1 , x 2 ) spans the interval<br />
[0, n]. Within the sample, cases are <strong>de</strong>fined based on a threshold value (i.e., values lower or higher<br />
than a certain limit), and for each of them F m is <strong>de</strong>fined by analogy to F n (Petrişor et al., 2006).<br />
The DAC statistic is, for all possible values of (x 1 , x 2 ),<br />
DAC(x 1 , x 2 ) = F m (x 1 , x 2 ) − F n (x 1 , x 2 ) (2)<br />
F m is the empirical cumulative distribution function of all cases, and F n is the empirical<br />
cumulative distribution function of the total population (Petrişor et al., 2006).<br />
To compute the DAC statistic, the actual coordinates of the centers of each<br />
administrative unit were obtained. A special Quick-Basic application (Petrişor et al., 2002)<br />
was used to compute the DAC statistic based on the threshold value of 911.5 of an aggregated<br />
in<strong>de</strong>x od <strong>de</strong>velopment, built based on the results of factor analysis. The value was i<strong>de</strong>ntified<br />
looking at the statistical distribution of the in<strong>de</strong>x using it histogram, built using an Excel<br />
plug-in called Histo (Dragomirescu et al., 2003). Ordinary kriging, a interpolation technique<br />
assuming that the spatial distribution of a certain variable <strong>de</strong>pends only on the location of<br />
sampling stations (Johnston et al., 2001), was performed using the Geostatistical Analyst<br />
extension of ArcGIS to interpolate was used to interpolate the DAC values and <strong>de</strong>rive a<br />
generalized distribution.<br />
RESULTS AND DISCUSSION<br />
The results of factor analysis indicate that two variables, the number of high school<br />
graduates and the population employed in agriculture, account for 84.6 % of the total<br />
variation. The first one explains 69.2 % of the variation, and the second, 15.4 % of it (Ianoş<br />
and Petrişor, 2010).<br />
Figure 2. Showing the spatial distribution of the<br />
general level of <strong>de</strong>velopment <strong>de</strong>rived based on GIS<br />
mo<strong>de</strong>ling using all 15 indicators for the base<br />
administrative units of DâmboviŃa County located in<br />
the mountainous and sub-Carpathian space of the<br />
IalomiŃa river basin.<br />
(Source: Authors’ original work)<br />
Figure 3. Showing the spatial distribution of the<br />
general level of <strong>de</strong>velopment <strong>de</strong>rived based on GIS<br />
mo<strong>de</strong>ling using 2 main indicators for the base<br />
administrative units of DâmboviŃa County located in<br />
the mountainous and sub-Carpathian space of the<br />
IalomiŃa river basin.<br />
(Source: Authors’ original work)
Using GIS Mo<strong>de</strong>ling and the DAC Statistic to Analyze the Sustainability of Development … 367<br />
GIS mo<strong>de</strong>ling requires weights totaling 100 % instead of 84.6 %. Consequently, the<br />
new weights are 82 %, respectively 18 %. The results of using GIS-based mo<strong>de</strong>ling to<br />
compute the average level of <strong>de</strong>velopment in the base administrative units of DâmboviŃa<br />
County located in the mountainous and sub-Carpathian space of the IalomiŃa river basin is<br />
displayed in figure 2 and figure 3.<br />
Figure 2 presents the spatial distribution of the in<strong>de</strong>x computed based on all 15<br />
indicators, with higher weights assigned to those corresponding to the principal components<br />
i<strong>de</strong>ntified using factor analysis and figure 3 presents the spatial distribution of the in<strong>de</strong>x<br />
computed based on the two indicators corresponding to the principal components i<strong>de</strong>ntified<br />
using factor analysis, preserving their weights.<br />
A potential aggregated in<strong>de</strong>x based on the results of factor analysis would be simply<br />
computed as 0.82 × the number of high school graduates + 0.18 × the population employed in<br />
agriculture. Its distribution is displayed in the histogram displayed in figure 4, drawn using Histo.<br />
The histogram indicates a bimodal distribution, requiring its separation into two unimodal<br />
distributions, one containing the lower values, and another the higher ones. Cutting the distribution<br />
pinpointed the threshold value used in the computation of the DAC static; the value was<br />
<strong>de</strong>termined as the midpoint of the middle interval, i.e., 911.5. Based on the threshold, the DAC<br />
statistic was computed and its spatial distribution mapped in figure 5. Furthermore, ordinary<br />
kriging was used to provi<strong>de</strong> a generalized spatial distribution of the values, based on the location<br />
of the center of each administrative unit and its corresponding DAC value, regardless of the actual<br />
administrative limits. The kriging map is displayed in figure 6.<br />
Regardless of the methodology utilized, all the maps displayed in figure 2, figure 3,<br />
figure 5, and figure 6 suggest the existence of two ‘rich’ zones, one situated in the mountainous<br />
region and another adjacent to the plain area, while the poorer ones are situated in between.<br />
Slight differences are due to the methodological approach concern the size and overall level of<br />
<strong>de</strong>velopment of these areas. The spatial distribution is also changed by major communication<br />
routes and different accessibility.<br />
14<br />
12<br />
10<br />
Frequency<br />
8<br />
6<br />
4<br />
2<br />
0<br />
[159, 374)<br />
[374, 589)<br />
[589, 804)<br />
[804, 1019)<br />
[1019, 1234)<br />
[1234, 1449)<br />
[1449, 1664)<br />
Interval<br />
Figure 4. Displaying the histogram of the values of the general in<strong>de</strong>x of <strong>de</strong>velopment <strong>de</strong>rived using factor analysis.<br />
(Source: Authors’ original work)<br />
[1664, 1879)<br />
[1879, 2094)<br />
[2094, 2309)<br />
[2309, 2524)<br />
[2524, 2739)<br />
[2739, 2954)
368<br />
Ioan IANOŞ, Alexandru-Ionuț PETRIŞOR<br />
Figure 5. Showing the spatial distribution of the<br />
DAC values in the base administrative units of<br />
DâmboviŃa County located in the mountainous and<br />
sub-Carpathian space of the IalomiŃa river basin.<br />
Higher values, indicated by darker sha<strong>de</strong>s, i<strong>de</strong>ntify<br />
poorly <strong>de</strong>veloped areas.<br />
(Source: Authors’ original work)<br />
Figure 6. Showing the ordinary kriging interpolation<br />
of the DAC values in the base administrative units of<br />
DâmboviŃa County located in the mountainous and<br />
sub-Carpathian space of the IalomiŃa river basin.<br />
Higher values, indicated by darker sha<strong>de</strong>s, i<strong>de</strong>ntify<br />
poorly <strong>de</strong>veloped areas.<br />
(Source: Authors’ original work)<br />
CONCLUSIONS<br />
The results obtained by using GIS mo<strong>de</strong>ling and the DAC statistic to analyze the level of<br />
<strong>de</strong>velopment in IalomiŃa river basin prove the advantages of correlative-integrative approaches.<br />
From the multitu<strong>de</strong> of analyzed indicators, the population employed in agriculture and share of<br />
high school graduates stand out, explaining the large territorial variability of the in<strong>de</strong>x of<br />
<strong>de</strong>velopment. The alternate distribution in territorial strips of the level of <strong>de</strong>velopment in IalomiŃa<br />
river basin show the importance of available resources within the mountain areas, as well as within<br />
the contact areas (plain-hills), compared to those specific to the poorer plain regions.<br />
REFERENCES<br />
Brundtland G. H. (1987), Our Common Future, WCED, Oxford University Press, Oxford;<br />
Bugge H. C., Watters L. (2003), A Perspective on Sustainable Development after Johannesburg on the Fifteenth<br />
Anniversary of Our Common Future: An Interview with Gro Harlem Brundtland, in Georgetown International<br />
Environmental Law Review, 15, 359-366, Georgetown University Law Center, Georgetown, NJ;<br />
Centrul <strong>de</strong> Cercetare, Proiectare, Expertiză şi Consulting (2006), Conceptul NaŃional <strong>de</strong> Dezvoltare SpaŃială România 2025<br />
– Sinteză, Universitatea <strong>de</strong> Arhitectură şi Urbanism „Ion Mincu“, Bucureşti;<br />
Colignon P. (2009), Situation et défis du mon<strong>de</strong> rural – Le patrimoine et le paysage au cœur <strong>de</strong>s enjeux du développement<br />
territorial durable, in Aménagement du territoire européen et paysage, 88, 99-103, Council of Europe Publishing,<br />
Strasbourg, France;<br />
Cowen D. J. (1988), GIS versus CAD versus DBMS: What Are the Differences?, in Photogrammetric Engineering and<br />
Remote Sensing, 54, 1551-1555, American Society for Photogrammetry and Remote Sensing, Bethesda, MD;<br />
Dobrin M., Tache A., Petrişor A. I. (2010a), Analysis of regional <strong>de</strong>velopment disparities in Romania using the Geographical
Using GIS Mo<strong>de</strong>ling and the DAC Statistic to Analyze the Sustainability of Development … 369<br />
Information Systems, in Romanian Statistical Review, 58(8), 25-37, National Statistical Institute, Bucharest, Romania;<br />
Dobrin M., Tache A., Petrişor A. I. (2010b), Development disparities in the administrative/territorial units in Romania:<br />
hierarchy, methods, indicators, statistical analysis, in Romanian Statistical Review, 58(5), 16-26, National<br />
Statistical Institute, Bucharest, Romania;<br />
Dragomirescu L., Zotta N., Ciucă D. (2003), Histograms and scales program (HISTO – version 1) for EXCEL users, in<br />
Proceedings of The 1st ME<strong>DIN</strong>F International Conference on Medical Informatics & Engineering, 5(3), 144-145,<br />
University of Medicine and Pharmacy of Craiova, Craiova, Romania;<br />
Dragomirescu, L., Drane, J. W. (2009), Biostatisticcs for dummies, Vol. I. Descriptive biostatistics, 6th revised edition,<br />
Editura CREDIS, Bucharest, Romania;<br />
Drane J. W., Creangă D. L., Aldrich T. E., Hudson M. B. (2005), Detecting Adverse Health Events via Empirical Spatial<br />
Distributions, Symposium on Statistical Methods 1995, U.S.D.H.H.S., P.H.S., C.D.C., Atlanta, GA, January 24-26;<br />
Ianoş I., Peptenatu D., Pintilii R. D., Zamfir D., (2010), The insertion of highly disadvantaged areas in regional<br />
environments, in Analele UniversităŃii din Ora<strong>de</strong>a – Seria Geografie, 20(2), 159-166, University of Ora<strong>de</strong>a,<br />
Ora<strong>de</strong>a, Romania;<br />
Ianoş I., Petrişor A. I. (2010), Micro-scale geostatistical analysis of the level of <strong>de</strong>velopment. Case study: mountainous and<br />
subcarpathian area of IalomiŃa hydrographic basin, in Geographia Technica, special issue, 47-51, Studia<br />
Crescent, Cluj Universitz Press, Cluj, Romania;<br />
Ianoş I., Petrişor A. I., Ilinca Stoica V., Sârbu C. N., Zamfir D., Cercleux A. L. (2011), The different consuming of primary<br />
eco-energies and their <strong>de</strong>gradation in territorial systems, in Carpathian Journal of Earth and Environmental<br />
Sciences, 6(2), 251-260, North University of Baia Mare, Baia Mare, Romania;<br />
Ilieş A., Ilieş D. C., Josan I., Wendt J., Herman G., Grama V. (2010), The i<strong>de</strong>ntification, evaluation, quantification and<br />
capitalization through tourism of the authentic resources from Crişana-Maramureş with the purpose of<br />
elaborating a strategy of cross-bor<strong>de</strong>r integrated sustainable <strong>de</strong>velopment. methodological approach, in Analele<br />
UniversităŃii din Ora<strong>de</strong>a – Seria Geografie, 20(1), 127-140, University of Ora<strong>de</strong>a, Ora<strong>de</strong>a, Romania;<br />
Johnston K., Ver Hoef J. M., Krivoruchko K., Lucas N. (2001), Using ArcGIS Geostatistical Analyst, ESRI Press, Redlands, CA;<br />
Office of the Deputy Prime Minister (2006), A common approach to creating sustainable communities: „The Bristol<br />
Accord“, în: UK Presi<strong>de</strong>ncy. EU Ministerial Informal on Sustainable Communities. Policy Papers, ODPM<br />
Publications, London, Document 05 EUPMI 03656/A;<br />
Petrişor A. I. (2008a), Către o <strong>de</strong>finiŃie a <strong>de</strong>zvoltării spaŃiale durabile, in Amenajarea Teritoriului şi Urbanismul, 7(3-4), 1-<br />
5, AsociaŃia ArhitecŃilor Şefi <strong>de</strong> Ju<strong>de</strong>Ńe, Iaşi, Romania;<br />
Petrişor A. I. (2008b), Ecologie urbană, <strong>de</strong>zvoltare spaŃială durabilă şi legislaŃie, Editura FundaŃiei România <strong>de</strong> mâine, Bucureşti;<br />
Petrişor A. I. (2009), Teoria şi practica <strong>de</strong> conservare a diversităŃii biologice prin planurile <strong>de</strong> urbanism şi amenajarea teritoriului,<br />
in Amenajarea Teritoriului şi Urbanismul, 8(3-4), 15-24, AsociaŃia ArhitecŃilor Şefi <strong>de</strong> Ju<strong>de</strong>Ńe, Iaşi, Romania;<br />
Petrişor A.-I., Dragomirescu L., Drane J. W., Jackson K. L., Cowen D., (2002), Using a Quick-Basic Application Based on<br />
the DAC Statistic to Detect Spatial Clusters, in Journal of Control Engineering and Applied Informatics, 4(1), 55-<br />
64, Romanian Society of Control Engineering and Technical Informatics, Bucharest, Romania.<br />
Petrişor A. I., Drane J. W., Dragomirescu L. (2006), The DAC statistic: properties and use in <strong>de</strong>tection of clusters, in<br />
University Politehnica of Bucharest Scientific Bulletin Series A: Applied Mathematics and Physics, 68(2), 19-34,<br />
University Politehnica of Bucharest, Bucharest, Romania;<br />
Petrişor A. I., Ianoş I, Tălângă C. (2010), Land cover and use changes focused on the urbanization processes in Romania,<br />
in Environmental Engineering and Management Journal, 9(6), 765-771, „Gheorghe Asachi” Technical University<br />
of Iaşi, Iaşi, Romania;<br />
Petrişor A. I., Sârbu C. N. (2010), Dynamics of geodiversity and eco-diversity in territorial systems, in Journal of Urban<br />
and Regional Analysis, 2(1), 61-70, Interdisciplinary Center of Advanced Research on Territorial Dynamics,<br />
Bucharest, Romania;<br />
Tache A., Tache M., Petrişor A.-I., Manole S. D., Pârvu E., (2010), Geospatial systems for sustainable <strong>de</strong>velopment in<br />
Romania, Editura CREDIS, Bucharest, Romania;<br />
United Nations (1992), Report of the United Nations Conference on Environment and Development, Rio <strong>de</strong> Janeiro,<br />
Brazilia, Document A/CONF.151/26 (Vol. I), United Nations Department of Economic and Social Affairs,<br />
http://www.un.org/documents/ga/conf151/aconf15126-1annex1.htm<br />
Submitted: Revised: Accepted and published online<br />
June 15, 2011 August 23, 2011 September 03, 2011
Analele UniversităŃii din Ora<strong>de</strong>a – Seria Geografie Year XXI, no. 2/2011 (December), pp. 370-373<br />
ISSN 1454-2749, E-ISSN 2065-1619 Article no. 212923<br />
GEOGRAPHICAL JOURNALS<br />
PUBLISHED IN ROMANIA - 2011<br />
Dumitru RUS ∗<br />
Pedagogical Highschool „Sabin Drăgoi”, no.2, G. BariŃiu Avenue,<br />
Deva, Romania, e-mail: dumitrurus@yahoo.com<br />
1. Magazines/Journals published in the aca<strong>de</strong>mic/university environment<br />
Name of publication<br />
Alpii Transilvaniei<br />
Analele Ştiintifice ale UniversităŃii<br />
Al. I. Cuza Iaşi. Geografie<br />
Analele UniversităŃii <strong>de</strong> Vest din<br />
Timişoara. Seria Geografie<br />
Analele UniversităŃii din Craiova.<br />
Serie Nouă, Seria Geografie<br />
Analele UniversităŃii din Ora<strong>de</strong>a.<br />
Seria Geografie<br />
Analele UniversităŃii Ora<strong>de</strong>a,<br />
Fascicula ProtecŃia Mediului<br />
Analele UniversităŃii Spiru Haret.<br />
Seria Geografie<br />
Analele UniversităŃii Ştefan cel Mare<br />
din Suceava. Seria Geografie<br />
Analele Universitatii Valachia,<br />
Târgovişte. Seria Geografie<br />
Annuaire Roumain d'Anthropologie<br />
Carpathian Journal of Earth and<br />
Environmental<br />
Publishing institution<br />
Universitatea Creştină „Dimitrie<br />
Cantemir”, Sibiu, Facultatea <strong>de</strong><br />
Geografia Turismului, revista<br />
stu<strong>de</strong>nŃilor.<br />
Universitatea „Al. I. Cuza” Iaşi,<br />
<strong>Departamentul</strong> <strong>de</strong> Geografie<br />
Universitatea <strong>de</strong> Vest din Timisoara,<br />
<strong>Departamentul</strong> <strong>de</strong> Geografie<br />
Universitatea din Craiova,<br />
<strong>Departamentul</strong> <strong>de</strong> Geografie<br />
Universitatea din Ora<strong>de</strong>a,<br />
<strong>Departamentul</strong> <strong>de</strong> Geografie, Turism<br />
şi Amenajarea Teritoriului<br />
Universitatea din Ora<strong>de</strong>a, Facultatea<br />
<strong>de</strong> ProtecŃia Mediului<br />
Universitatea „Spiru Haret”, Editura<br />
FundaŃiei România <strong>de</strong> Mâine.<br />
Universitatea „Ştefan Cel Mare”<br />
Suceava, Facultatea <strong>de</strong> Istorie şi<br />
Geografie, <strong>Departamentul</strong> <strong>de</strong><br />
Geografie<br />
Universitatea „Valachia”<br />
Târgovişte, <strong>Departamentul</strong> <strong>de</strong><br />
Geografie<br />
Aca<strong>de</strong>mia Română. Institutul <strong>de</strong><br />
Antropologie. Editura Aca<strong>de</strong>miei<br />
Universitatea <strong>de</strong> Nord Baia Mare<br />
CNCSIS<br />
classification<br />
(February<br />
2011)<br />
-<br />
C<br />
C<br />
D<br />
B+<br />
B+<br />
D<br />
B+<br />
C<br />
∗ Corresponding Author<br />
http://istgeorelint.uora<strong>de</strong>a.ro/Reviste/Anale/anale.htm
Geographical Journals Published in Romania - 2011 371<br />
Comunicări <strong>de</strong> Geografie<br />
Environment & Progress<br />
Factori şi Procese Pedogenetice din<br />
Zona Temperată<br />
Forum Geografic<br />
Geo - Eco - Marina<br />
Geo Oltenia<br />
Geo-Carpathica<br />
Geographia Napocensis<br />
Geo Valachica.<br />
Comunicări şi Rapoarte<br />
Geographia Technica<br />
Geographica Timisiensis<br />
Geojournal of Tourism and Geosites<br />
Human Geographies<br />
Journal of Urban and Regional<br />
Analysis<br />
Lucrări şi Rapoarte <strong>de</strong> Cercetare<br />
Lucrările Seminarului Geografic<br />
Dimitrie Cantemir<br />
Present Environment and<br />
Sustainable Development<br />
Review of Historical Geography and<br />
Toponomastics<br />
Universitatea din Bucureşti,<br />
Facultatea <strong>de</strong> Geografie<br />
Facultatea <strong>de</strong> ŞtiinŃa şi Ingineria<br />
Mediului, Universitatea „Babeş-<br />
Bolyai” Cluj - Napoca<br />
Universitatea „Al. I. Cuza” Iaşi,<br />
<strong>Departamentul</strong> <strong>de</strong> Geografie<br />
Universitatea din Craiova, Editura<br />
Universitaria<br />
Institutul NaŃional <strong>de</strong> Cercetare<br />
pentru Geologie şi Geoecologie<br />
Marină<br />
Universitatea din Craiova,<br />
<strong>Departamentul</strong> <strong>de</strong> Geografie, revistă<br />
a stu<strong>de</strong>nŃilor<br />
Universitatea Creştină „Dimitrie<br />
Cantemir”, Facultatea <strong>de</strong> Geografia<br />
Turismului, Sibiu<br />
Aca<strong>de</strong>mia Română – Filiala Cluj<br />
Universitatea „Valahia” din<br />
Târgovişte. Facultatea <strong>de</strong> ŞtiinŃe<br />
Umaniste. Centrul <strong>de</strong> Cercetare<br />
Geografia Habitatului Rural şi Urban<br />
în Contextul Dezvoltării Durabile<br />
Universitatea „Babeş-Bolyai” Cluj<br />
Napoca, Facultatea <strong>de</strong> Geografie.<br />
Editura Presa Universitară Clujană<br />
Universitatea <strong>de</strong> Vest Timişoara,<br />
<strong>Departamentul</strong> <strong>de</strong> Geografie<br />
Universitatea din Ora<strong>de</strong>a,<br />
<strong>Departamentul</strong> Geografie, Turism şi<br />
Amanajarea Teritoriului<br />
Universitatea din Bucureşti,<br />
Facultatea <strong>de</strong> Geografie,<br />
<strong>Departamentul</strong> <strong>de</strong> Geografie umană<br />
Universitatea din Bucureşti. Centrul<br />
Interdisciplinar <strong>de</strong> Cercetari<br />
Avansate asupra Dinamicii<br />
Teritoriale<br />
Universitatea Bucureşti. Centrul <strong>de</strong><br />
cercetare pentru <strong>de</strong>gradarea<br />
terenurilor şi dinamica<br />
geomorfologică<br />
Universitatea „Al. I. Cuza” Iaşi,<br />
Facultatea <strong>de</strong> Geografie - Geologie,<br />
<strong>Departamentul</strong> <strong>de</strong> Geografie<br />
Universitatea „Al. I. Cuza” Iaşi,<br />
Facultatea <strong>de</strong> Geografie - Geologie<br />
Universitatea <strong>de</strong> Vest Timişoara,<br />
<strong>Departamentul</strong> <strong>de</strong> Geografie.<br />
D<br />
C<br />
B+<br />
C<br />
-<br />
D<br />
B+<br />
D<br />
D<br />
B<br />
-
372<br />
Dumitru RUS<br />
Revista <strong>de</strong> Geomorfologie<br />
AsociaŃia Gomorfologilor din<br />
România.<br />
C<br />
Revista Geografică<br />
Aca<strong>de</strong>mia Română, Institutul <strong>de</strong><br />
Geografie<br />
D<br />
Revista Română <strong>de</strong> Geografie Universitatea din Ora<strong>de</strong>a,<br />
Politică<br />
<strong>Departamentul</strong> Geografie, Turism şi B+<br />
Amenajarea Teritoriului<br />
Societatea <strong>de</strong> hidrologie medicală şi<br />
Revista SocietăŃii <strong>de</strong> Hidrologie<br />
climatologie. Tipografia Cultura<br />
Medicală şi Climatologie<br />
Bucureşti<br />
Studia Universitatis Babeş - Bolyai. Universitatea „Babeş - Bolyai” Cluj<br />
Geographia<br />
Napoca, Facultatea <strong>de</strong> Geografie.<br />
B+<br />
StiinŃa Solului<br />
Societatea NaŃională Romană pentru<br />
ŞtiinŃa Solului, Bucureşti<br />
Studii şi Cercetari <strong>de</strong> Geografie Aca<strong>de</strong>mia Română D<br />
Universitatea „Babeş - Bolyai” Cluj<br />
TendinŃe Actuale în Predarea şi<br />
Napoca, Facultatea <strong>de</strong> Geografie,<br />
ÎnvăŃarea Geografiei<br />
Editura Clusium Cluj Napoca<br />
-<br />
The Danube River: Environment &<br />
Education<br />
Universitas Geographica. Revista<br />
Şcolii Doctorale Simion MehedinŃi<br />
Centrul Danubian <strong>de</strong> EducaŃie a<br />
Mediului, Universitatea Română <strong>de</strong><br />
Ştiinte şi Arte Gheorghe Cristea<br />
Universitatea din Bucureşti,<br />
Facultatea <strong>de</strong> Geografie<br />
D<br />
2. Magazines/Journals published by the Society of Geography of Romania and its<br />
subsidiaries<br />
Name of publication<br />
Analele Simpozionului Euroregiunea Prutul<br />
<strong>de</strong> Sus<br />
Brătescu<br />
Buletinul SocietăŃii <strong>de</strong> Geografie din România<br />
- Prahova<br />
Coordonate<br />
GEIS - Referate şi Comunicări <strong>de</strong> Geografie<br />
Geographica<br />
Geosib<br />
Orizontul Băcăuan<br />
Orizonturi Geografice<br />
Orizonturi Geografice - Revista Profesorilor<br />
<strong>de</strong> Geografie din Ju<strong>de</strong>Ńul Vaslui<br />
Orizonturi Gorjene<br />
Publishing institution<br />
Societatea <strong>de</strong> Geografie - Filiala Ju<strong>de</strong>Ńului<br />
Botoşani<br />
Societatea <strong>de</strong> Geografie - Filiala Ju<strong>de</strong>Ńului<br />
Tulcea<br />
Societatea <strong>de</strong> Geografie - Filiala Ju<strong>de</strong>Ńului<br />
Prahova<br />
Societatea <strong>de</strong> Geografie - Filiala Ju<strong>de</strong>Ńului<br />
Dolj<br />
Societatea <strong>de</strong> Geografie - Filiala Ju<strong>de</strong>Ńului<br />
Hunedoara, Editura Casei Corpului Didactic<br />
Deva<br />
Societatea <strong>de</strong> Geografie - Filiala Ju<strong>de</strong>Ńului<br />
Bihor<br />
Societatea <strong>de</strong> Geografie - Filiala Ju<strong>de</strong>Ńului<br />
Sibiu<br />
Societatea <strong>de</strong> Geografie - Filiala Ju<strong>de</strong>Ńului<br />
Bacău, Editura Graffit Bacău<br />
Societatea <strong>de</strong> Geografie - Filiala Ju<strong>de</strong>Ńului<br />
Dolj, Editura Universitaria<br />
Societatea <strong>de</strong> Geografie - Filiala Ju<strong>de</strong>Ńului<br />
Vaslui<br />
Societatea <strong>de</strong> Geografie - Filiala Ju<strong>de</strong>Ńului
Geographical Journals Published in Romania - 2011 373<br />
Orizonturi Sucevene - Revista Profesorilor <strong>de</strong><br />
Geografie<br />
Pangeea<br />
Repere Geografice<br />
Revista <strong>de</strong> Geografie<br />
Terra<br />
Gorj şi Inspectoratul Şcolar Gorj<br />
Societatea <strong>de</strong> Geografie - Filiala Ju<strong>de</strong>Ńului<br />
Suceava<br />
Societatea <strong>de</strong> Geografie - Filiala Ju<strong>de</strong>Ńului<br />
Alba şi Universitatea 1 Decembrie 1918 Alba<br />
Iulia<br />
Societatea <strong>de</strong> Geografie - Filiala Ju<strong>de</strong>Ńului Iaşi<br />
şi Inspectoratul Şcolar al Ju<strong>de</strong>Ńului Iaşi<br />
Societatea <strong>de</strong> Geografie - Filiala Ju<strong>de</strong>Ńului<br />
NeamŃ<br />
Societatea <strong>de</strong> Geografie din România, Editura<br />
CD Press Bucureşti<br />
3. Scientific information and mass-media magazines/journals.<br />
Name of publication<br />
Analele AsociaŃiei Profesionale a<br />
Geografilor din România<br />
Geo<br />
Geograful<br />
Publishing institution<br />
AsociaŃia Profesională a<br />
Geografilor din România,<br />
Bucureşti<br />
Grupul editorial Motor Presse<br />
Romania<br />
AsociaŃia Profesională a<br />
Geografilor din România<br />
Geopolis Grupul Şcolar dr. M. Ciucă<br />
Săveni, ju<strong>de</strong>Ńul Botoşani<br />
Geopolitica - Revistă <strong>de</strong> Geografie<br />
Politică, Geopolitică şi<br />
Geostrategie<br />
Editura Top Form<br />
CNCSIS<br />
classification<br />
(February 2011)<br />
InvitaŃie în CarpaŃi Alpinet.org -<br />
National Geographic România SC Sanoma Hearst Romania SRL -<br />
Nymphaea Folia Naturae Bihariae Muzeul łării Crişurilor, Ora<strong>de</strong>a C<br />
Inspectoratul Şcolar al Ju<strong>de</strong>Ńului<br />
Orizonturi Didactice. SecŃiunea<br />
Călăraşi şi Casa Corpului Didactic<br />
Geografie.<br />
Călăraşi. Editura Agora, Calaraşi<br />
Revista Minelor Editura Infomin Deva B+<br />
SargeŃia - Series Scientia Naturae<br />
Studii şi Cercetari (BistriŃa -<br />
Năsăud) Seria Geologie -<br />
Geografie<br />
Acta Musei Devensis. Muzeul<br />
CivilizaŃiei Dacice şi Romane,<br />
Deva<br />
Complexul Muzeal BistriŃa<br />
Năsăud, BistriŃa.<br />
Terra Magazin Editura CD Press Bucureşti -<br />
-<br />
-<br />
-<br />
C<br />
D
Analele UniversităŃii din Ora<strong>de</strong>a – Seria Geografie Year XXI, no. 2/2011 (December), pp. 374-375<br />
ISSN 1454-2749, E-ISSN 2065-1619 Article no. 212224<br />
„Geography and Tourism on the Iadului Valley, Dr. Aurelia Dumiter`s second book,<br />
written in 2010, is a monograph of a limited geographical area but with striking i<strong>de</strong>ntity elements<br />
given by its placement in a contiguous mountain frame, with varied constitution and landscape:<br />
Pădurea Craiului Mountains and Bihor-Vlă<strong>de</strong>asa Mt.<br />
On the one hand, the omnipresent limestone in Padurea Craiului give this wild area a<br />
distinct and particular note by the numerous forms of endokarst (there stands the narrow gorge<br />
sector, but sinkholes and karst springs are not absent either - the Toplita Remeti karst spring is<br />
remarkable, but most of all by the <strong>de</strong>ep karst: among which Pobraz pithole is 185 m <strong>de</strong>ep), but<br />
most of all the nebulous un<strong>de</strong>rground hollows attract like magnets: „In the middle basin of Iadului<br />
Valley, between its junction with Lesului and Bisericii valleys, 101 un<strong>de</strong>rground hollows have<br />
been researched and mapped...”<br />
On the other hand, the majestic eruptive Vla<strong>de</strong>asa enters the scenery with the highest altitu<strong>de</strong>s<br />
of the Iadului Basin and by its imposing abrupt with „enormous bottom <strong>de</strong>bris trains, slope ruptures in<br />
the riverbed, which generates the waterfalls (Iadolina, Vălul Miresei, IeduŃului)”.<br />
The Iadului River Basin stands out with its mild winter climate and mo<strong>de</strong>rate, moist<br />
summers. „The main characteristics of the mountain climate with cool, moist summers and cold<br />
winters, with low mean annual temperatures, below 5 0 C, high nebulosity, rich precipitations and<br />
plenty of snow in winter <strong>de</strong>termines a tonic stimulant bioclimate, characterized by low<br />
atmospheric pressure, clean air with no dust, rich in ultraviolet radiation and increased<br />
atmospheric ionization”.<br />
Another distinct note is given by the waters that cross the slopes of the surrounding<br />
mountains and most of all the presence of the Minunilor Spring at Stâna <strong>de</strong> Vale and Leşu lake and<br />
dam - first rank hotspots of the area and also of Bihor County.<br />
Of course, the pedogeographic and biogeographic elements complement the natural<br />
heritage by their unique features: Transylvanian bat (Syringa josikaea), aconite with blue hairy<br />
flowers (Aconitum callibotryon spp scarisorensis), carnation (Dianthus julii wolfi), red violet with<br />
white stripes (Viola jooi), brother-and-sister (Melamphyrum biharense).<br />
Such a geographical area is unavoidably characterized by the existence of the human<br />
element: „the natural conditions in the Iadului Valley area, less favourable, allowed the<br />
establishment and continuity of the human element, since the 15 th century”. The human<br />
settlements network in the Iadului Valley consists of three villages (Bulz, Munteni and RemeŃi),<br />
belonging to Bulz commune and Stâna <strong>de</strong> Vale resort. Before 1998 Remeti village (the main<br />
settlement) had a strong industrial function (given by the hydro sites and mining units) but in<br />
recent years, its economic profile has changed, „the inhabitants of the Iadului Valley sought and<br />
found alternative income sources, focusing on fisheries and tourism activities”.<br />
Unfortunately the natural environment isn`t supportive enough, and the population is<br />
<strong>de</strong>clining numerically (especially after 1990).<br />
In the second part, the book presents one of the alternate economic activities with some<br />
chance of success, namely tourism, the rural adapted form, i.e. rural tourism. The Iadului Valley<br />
tourism potential doubtlessly exists, much discussion on this issue being no longer need and the<br />
valuable elements of the human tourism potential are ad<strong>de</strong>d to it.<br />
Small villages or hamlets, scattered on valleys and slopes, also humanize the landscape<br />
and represent real aesthetical values and thus a real tourist value (P. Cocean, 1984). Even though<br />
the villages Bulz, Munteni, RemeŃi, scattered and dotted about, are not top tourist landmarks, they<br />
diversify the tourism offer and have thus a greater role by being situated in the close proximity of<br />
natural tourist features.
Geography and Tourism on the Iadului Valley 375<br />
„The occupations of the inhabitants can become an important tourism asset, especially<br />
by their products coming from wood processing, weaving or primary processing of traditional<br />
foods. Most of the products obtained in households are for own needs and turning them into<br />
tourism consumption products may have an indisputable attractive si<strong>de</strong>. At the same time, those<br />
very habits and the simple, sometimes primitive but pure and natural way they are carried out can<br />
become tourist attractions for the urban or Western European dweller”.<br />
Bringing together the two components of the tourism potential, the forms and types of<br />
tourism that can be practiced in this area are presented (recreational tourism, sports tourism,<br />
religious tourism, curative tourism etc).<br />
But the appropriate tourism infrastructure is nee<strong>de</strong>d for the successful practice of these<br />
forms of tourism. In the communication system on Iadului Valley, the road network consists of<br />
county roads and a rich network of forest roads which facilitate the access to the most remote<br />
hamlets and also to some tourist attractions. However, we must make reference to the poor state of<br />
maintenance of these roads.<br />
The railway system has old traditions in Iadului Valley. Back in the late nineteenth<br />
century the valley was crossed by the „mocăniŃe” (called „pâca” by the locals), means of<br />
transportation specific to mountain regions, especially in the Apuseni Mountains.<br />
On the whole area of Iadului Valley, accommodation belongs to primary and secondary<br />
accommodation bases. Iadolina hotel and the chalets Cerbul (the Stag) and Gau<strong>de</strong>amus from Stâna<br />
<strong>de</strong> Vale and the Leşu Dam motel belong to the first category.<br />
The secondary accommodation bases are private guesthouses and accommodation, quite<br />
poorly represented compared to the tourism potential and camping areas (at Valea Lupului, Coada<br />
lacului, Dealul Mare). A new, effective and necessary accommodation base was built in 1995, by<br />
upgrading a stu<strong>de</strong>nts` camp in RemeŃi, with a steady running.<br />
The advantages and disadvantages of tourism <strong>de</strong>velopment in Iadului Valley are<br />
presented instead of conclusions, and a brief bibliographical list conclu<strong>de</strong>s this both geographical<br />
and touristic incursion.<br />
„Geography and Tourism on Iadului Valley”… a pleasant reading, alert, scientific,<br />
argumentative, which invites for a trip on this beautiful parts of Bihor.<br />
Ribana LINC, Associate Professor, Ph.D.
<strong>ANALELE</strong> UNIVERSITĂłII <strong>DIN</strong> <strong>ORADEA</strong>, SERIA GEOGRAFIE<br />
ANNALS OF UNIVERSITY OF <strong>ORADEA</strong>, GEOGRAPHY SERIE<br />
University of Ora<strong>de</strong>a<br />
Department of Geography, Tourism and Territorial Planning<br />
1 Universitătii Street, 410087 Ora<strong>de</strong>a, Romania, Phone/Fax: 0040 259 408 475,<br />
http://gtg.webhost.uora<strong>de</strong>a.ro, e-mail: gtg.uora<strong>de</strong>a@yahoo.com<br />
MANUSCRIPTS SUBMISSION<br />
The manuscript and artwork should be submitted with the following letter to editors:<br />
Dear Editor-in Chief,<br />
Please find enclosed our manuscript entitled:<br />
. . . . . . . . . . . . . . . . . . . . . . . . . . . . . . . . . . . . . . . . . . . . . . . . . . . . . . . . . . . . . . . . . . . . . . . . . . . . . . . . . . . . . . . . . . . . . . . . . . . . . . . . . . . . . . .<br />
. . . . . . . . . . . . . . . . . . . . . . . . . . . . . . . . . . . . . . . . . . . . . . . . . . . . . . . . . . . . . . . . . . . . . . . . . . . . . . . . . . . . . . . . . . . . . . . . . . . . . . . . . . . . . . .<br />
inten<strong>de</strong>d as submission for <strong>ANALELE</strong> UNIVERSITĂłII <strong>DIN</strong> <strong>ORADEA</strong>, SERIA GEOGRAFIE (ANNALS<br />
OF UNIVERSITY OF <strong>ORADEA</strong>, GEOGRAPHY SERIE)<br />
Author(s):<br />
. . . . . . . . . . . . . . . . . . . . . . . . . . . . . . . . . . . . . . . . . . . . . . . . . . . . . . . . . . . . . . . . . . . . . . . . . . . . . . . . . . . . . . . . . . . . . . . . . . . . . . . . . . . . . . .<br />
. . . . . . . . . . . . . . . . . . . . . . . . . . . . . . . . . . . . . . . . . . . . . . . . . . . . . . . . . . . . . . . . . . . . . . . . . . . . . . . . . . . . . . . . . . . . . . . . . . . . . . . . . . . . . . .<br />
. . . . . . . . . . . . . . . . . . . . . . . . . . . . . . . . . . . . . . . . . . . . . . . . . . . . . . . . . . . . . . . . . . . . . . . . . . . . . . . . . . . . . . . . . . . . . . . . . . . . . . . . . . . . . . .<br />
. . . . . . . . . . . . . . . . . . . . . . . . . . . . . . . . . . . . . . . . . . . . . . . . . . . . . . . . . . . . . . . . . . . . . . . . . . . . . . . . . . . . . . . . . . . . . . . . . . . . . . . . . . . . . . .<br />
Corresponding author:<br />
. . . . . . . . . . . . . . . . . . . . . . . . . . . . . . . . . . . . . . . . . . . . . . . . . . . . . . . . . . . . . . . . . . . . . . . . . . . . . . . . . . . . . . . . . . . . . . . . . . . . . . . . . . . . . . .<br />
Affiliation/Correspon<strong>de</strong>nce address:<br />
. . . . . . . . . . . . . . . . . . . . . . . . . . . . . . . . . . . . . . . . . . . . . . . . . . . . . . . . . . . . . . . . . . . . . . . . . . . . . . . . . . . . . . . . . . . . . . . . . . . . . . . . . . . . . . .<br />
. . . . . . . . . . . . . . . . . . . . . . . . . . . . . . . . . . . . . . . . . . . . . . . . . . . . . . . . . . . . . . . . . . . . . . . . . . . . . . . . . . . . . . . . . . . . . . . . . . . . . . . . . . . . . . .<br />
Short <strong>de</strong>scription of the subject:<br />
. . . . . . . . . . . . . . . . . . . . . . . . . . . . . . . . . . . . . . . . . . . . . . . . . . . . . . . . . . . . . . . . . . . . . . . . . . . . . . . . . . . . . . . . . . . . . . . . . . . . . . . . . . . . . . .<br />
. . . . . . . . . . . . . . . . . . . . . . . . . . . . . . . . . . . . . . . . . . . . . . . . . . . . . . . . . . . . . . . . . . . . . . . . . . . . . . . . . . . . . . . . . . . . . . . . . . . . . . . . . . . . . . .<br />
. . . . . . . . . . . . . . . . . . . . . . . . . . . . . . . . . . . . . . . . . . . . . . . . . . . . . . . . . . . . . . . . . . . . . . . . . . . . . . . . . . . . . . . . . . . . . . . . . . . . . . . . . . . . . . .<br />
. . . . . . . . . . . . . . . . . . . . . . . . . . . . . . . . . . . . . . . . . . . . . . . . . . . . . . . . . . . . . . . . . . . . . . . . . . . . . . . . . . . . . . . . . . . . . . . . . . . . . . . . . . . . . . .<br />
. . . . . . . . . . . . . . . . . . . . . . . . . . . . . . . . . . . . . . . . . . . . . . . . . . . . . . . . . . . . . . . . . . . . . . . . . . . . . . . . . . . . . . . . . . . . . . . . . . . . . . . . . . . . . . .<br />
Short explanation of why the manuscript suits the AOUG.<br />
. . . . . . . . . . . . . . . . . . . . . . . . . . . . . . . . . . . . . . . . . . . . . . . . . . . . . . . . . . . . . . . . . . . . . . . . . . . . . . . . . . . . . . . . . . . . . . . . . . . . . . . . . . . . . . .<br />
. . . . . . . . . . . . . . . . . . . . . . . . . . . . . . . . . . . . . . . . . . . . . . . . . . . . . . . . . . . . . . . . . . . . . . . . . . . . . . . . . . . . . . . . . . . . . . . . . . . . . . . . . . . . . . .<br />
. . . . . . . . . . . . . . . . . . . . . . . . . . . . . . . . . . . . . . . . . . . . . . . . . . . . . . . . . . . . . . . . . . . . . . . . . . . . . . . . . . . . . . . . . . . . . . . . . . . . . . . . . . . . . . .<br />
. . . . . . . . . . . . . . . . . . . . . . . . . . . . . . . . . . . . . . . . . . . . . . . . . . . . . . . . . . . . . . . . . . . . . . . . . . . . . . . . . . . . . . . . . . . . . . . . . . . . . . . . . . . . . . .<br />
. . . . . . . . . . . . . . . . . . . . . . . . . . . . . . . . . . . . . . . . . . . . . . . . . . . . . . . . . . . . . . . . . . . . . . . . . . . . . . . . . . . . . . . . . . . . . . . . . . . . . . . . . . . . . . .
At least three preferred reviewers (the suggested referees must be from different countries; do not<br />
mention co-authors), e-mail and postal address, affiliation, title (Dr., Prof, etc), field of specialization<br />
(editors reserve the right to <strong>de</strong>ci<strong>de</strong> if the manuscript will or will not be sent to preferred reviewers):<br />
[1.] . . . . . . . . . . . . . . . . . . . . . . . . . . . . . . . . . . . . . . . . . . . . . . . . . . . . . . . . . . . . . . . . . . . . . . . . . . . . . . . . . . . . . . . . . . . . . . . . . . . . . . . . . . .<br />
. . . . . . . . . . . . . . . . . . . . . . . . . . . . . . . . . . . . . . . . . . . . . . . . . . . . . . . . . . . . . . . . . . . . . . . . . . . . . . . . . . . . . . . . . . . . . . . . . . . . . . . . . . . . . . .<br />
[2.] . . . . . . . . . . . . . . . . . . . . . . . . . . . . . . . . . . . . . . . . . . . . . . . . . . . . . . . . . . . . . . . . . . . . . . . . . . . . . . . . . . . . . . . . . . . . . . . . . . . . . . . . . . .<br />
. . . . . . . . . . . . . . . . . . . . . . . . . . . . . . . . . . . . . . . . . . . . . . . . . . . . . . . . . . . . . . . . . . . . . . . . . . . . . . . . . . . . . . . . . . . . . . . . . . . . . . . . . . . . . . .<br />
[3.] . . . . . . . . . . . . . . . . . . . . . . . . . . . . . . . . . . . . . . . . . . . . . . . . . . . . . . . . . . . . . . . . . . . . . . . . . . . . . . . . . . . . . . . . . . . . . . . . . . . . . . . . . . .<br />
. . . . . . . . . . . . . . . . . . . . . . . . . . . . . . . . . . . . . . . . . . . . . . . . . . . . . . . . . . . . . . . . . . . . . . . . . . . . . . . . . . . . . . . . . . . . . . . . . . . . . . . . . . . . . . .<br />
Declaration/Copyright transfer:<br />
- The manuscript submitted represents our own original work and has not been published and is not<br />
being submitted or consi<strong>de</strong>red for publication elsewhere<br />
- All authors have contributed to the manuscript and that common agreement has been reached<br />
before submission.<br />
- All authors participated in the work in a substantive way and are prepared to take public<br />
responsibility for the work.<br />
- The text, illustrations, and any other materials inclu<strong>de</strong>d in the manuscript do not infringe upon any<br />
existing copyright or other rights of anyone.<br />
- The authors are agreeing that all materials submitted for evaluation (including text, figures, etc.)<br />
retains the property/copyrights of the AUOG.<br />
- Reproduction, posting, transmission or other distribution or use of the article or any material<br />
contained therein, requires a citation to the Analele UniversităŃii din Ora<strong>de</strong>a, Seria Geografie<br />
(Annals of University of Ora<strong>de</strong>a, Geography Serie).<br />
Yours sincerely,<br />
Corresponding author name<br />
. . . . . . . . . . . . . . . . . . . . . . . . . . . . . . . . . . . . . . . . . . . . . . . . . . . . . . . .<br />
Data<br />
Signature<br />
. . . . . . . . . . . . . . . . . . . . . . . . . . . . . . . . . . . . . . . . . . . . . . . . . . . . . . .
C O N T E N T S<br />
SKI ACTIVITY IN WESTERN PART OF SOUTHERN CARPATHIANS. CASE STUDY: STRAJA SKI AREA, Mircea<br />
VOICULESCU, Florentina POPESCU, Alexandru ONACA, Marcel TÖRÖK-OANCE<br />
........................................................................................................................................................................................................................................................... 159<br />
CONTRIBUTIONS TO INVENTORY AND ASSESSEMENT OF THE GEOMORPHOSITES IN CĂLIMANI NATIONAL<br />
PARK. CASE STUDY: 12 APOSTLES GEOLOGIC RESERVE, Ioan BÂCA<br />
……………………………………………………………………………………………………………………………………………………………………. 172<br />
PERSPECTIVES IN THE ANALYSIS OF THE TERRACES OF THE DANUBE WITHIN THE OLTENIA PLAIN<br />
(ROMANIA), Sandu BOENGIU, Sorin AVRAM, Alina VLĂDUł<br />
......................................................................................................................................................................................................................................................... 181<br />
THE FOEHN WINDS IN NORTHERN OLTENIA. 18.08.2008 CASE STUDY, Anişoara IRIMESCU<br />
…………………………………………………………………………………………………………………………………………………………………….. 192<br />
ASPECTS REGAR<strong>DIN</strong>G THE RIME PHENOMEN IN DEVA AREA, Cristina Diana BRĂDĂU<br />
.......................................................................................................................................................................................................................................................... 203<br />
COMMUNITY’S ADAPTIVE CAPACITY DUE TO COASTAL FLOO<strong>DIN</strong>G IN SEMARANG COASTAL CITY,<br />
INDONESIA, Muh Aris MARFAI, Dyah R. HIZBARON<br />
…………………………………………………………………………………………………………………………………………………………………….. 209<br />
DOWNSTREAM VARIATION IN PARTICLE SIZE: A CASE STUDY OF THE TROTUŞ RIVER, EASTERN<br />
CARPATHIANS (ROMANIA), Dan DUMITRIU, Daniel CONDORACHI, Mihai NICULIłĂ<br />
.......................................................................................................................................................................................................................................................... 222<br />
SEASONAL STUDY WITH INTERPRETATION OF THE CHEMICAL CHARACTERISTICS OF WATER POND IN<br />
REFERENCE TO QUALITY ASSESSMENT: A CASE STUDY, Hemant PATHAK, Deepak PATHAK, Sudhir Nagesh LIMAYE<br />
…………………………………………………………………………………………………………………………………………………………………….. 233<br />
DRINKING WATER SUPPLY AND CONSUMPTION TERRITORIAL DISPARITIES IN THE TIMIŞ PLAIN, Bianca<br />
MITRICĂ, Irena MOCANU<br />
…………………………………………………………………………………………………………………………………………………………………….. 239<br />
CONTRIBUTIONS TO THE KNOWLEDGE OF THE ASSOCIATION OF FESTUCO DRYMEJAE-FAGETUM FROM<br />
LĂZĂRENI HILLS (NORTH-WESTERN ROMANIA), Laura Mariana LACATOŞ (HERMAN), Grigore Vasile HERMAN<br />
......................................................................................................................................................................................................................................................... 248<br />
GENESIS AND DYNAMICS OF A GEO-DEMOGRAPHIC SINGULARITY. A CASE STUDY - THE GIPSY<br />
COMMUNITY OF TOFLEA (BRĂHĂŞEŞTI COMMUNE, GALAłI COUNTY), Ionel MUNTELE, Raluca HOREA-ŞERBAN<br />
........................................................................................................................................................................................................................................................... 256<br />
THE VILLAGES FROM SALAJ IN THE EASTERN PART OF JIBOU LOCALITY – DEMOGRAPHIC POTENTIAL,<br />
Oana - Andreia PUIA<br />
.......................................................................................................................................................................................................................................................... 267<br />
COMMUNITIES BETWEEN PRESERVATION AND DISAPPEARANCE: THE DEMOGRAPHIC HAZARD IN BEIUS<br />
LAND, Claudiu FILIMON, LuminiŃa FILIMON<br />
.......................................................................................................................................................................................................................................................... 276<br />
DEMOGRAPHIC AND ECONOMIC VULNERABILITIES WITHIN THE SUBURBAN AREA OF TÂRGU JIU, Daniela<br />
ZAMFIR, Cristian BRAGHINĂ, Cristian TĂLÂNGĂ<br />
........................................................................................................................................................................................................................................................... 286<br />
THE EFFECTS OF POPULATION AGING ON RURAL AREAS. CASE STUDY: THE SARATEL HYDROGRAPHIC<br />
BASIN (BUZAU SUBCARPATHIANS), Ilinca-Valentina STOICA<br />
.......................................................................................................................................................................................................................................................... 294<br />
CHARACTERISTICS OF DEMOGRAPHICAL DYNAMICS IN AREAS OF URBAN INFLUENCE. CASE STUDY:<br />
INFLUENCE AREA OF RÂMNICU VÂLCEA CITY, Constantin Cristian DRĂGHICI, Daniel PEPTENATU, Daniel Radu PINTILII,<br />
Cristina MERCIU, Loreta Andreea CERCLEUX<br />
…………………………………………………………………………………………………………………………………………………………………….. 303<br />
WAYS OF MANAGING THE URBAN - RURAL INTERFACE. CASE STUDY: BUCHAREST, Ilinca-Valentina STOICA, Cristian<br />
TĂLÂNGĂ, Cristian BRAGHINĂ, Daniela ZAMFIR<br />
........................................................................................................................................................................................................................................................... 313<br />
SPORTS AND LEISURE TIME TOURISM – A WAY OF REVITALISING EMERGENT SPACES FROM THE<br />
METROPOLITAN AREA OF BUCHAREST, Radu - Daniel PINTILII, Florentina - Cristina MERCIU, Daniel PEPTENATU, Andreea - Loreta<br />
CERCLEUX, Cristian Constantin DRĂGHICI<br />
........................................................................................................................................................................................................................................................... 323<br />
INTERNAL TOURISM MOVEMENT AND THE MAIN ROMANIAN TOURIST DESTINATIONS (THE PERIOD 1990 -<br />
2008), Alexandru ILIEŞ, Dorina Camelia ILIEŞ, Cezar MORAR, Ioana JOSAN<br />
........................................................................................................................................................................................................................................................... 333<br />
ASPECTS REGAR<strong>DIN</strong>G THE ENVIRONMENTAL IMPACT OF TOURISM ACTIVITIES IN THE APUSENI NATURAL<br />
PARK (ROMANIA), Ribana LINC, Stelian NISTOR, David TURNOCK<br />
........................................................................................................................................................................................................................................................... 340<br />
MEANS OF CABLE TRANSPORTATION. AN INFRASTRUCTURAL COMPONENT OF THE GEOGRAPHICAL<br />
LANDSCAPE OF ALBAC - ARIEŞENI TERRITORIAL SYSTEM, Maria GOZNER, Ştefan BAIAS<br />
…………………………………………………………………………………………………………………………………………………………………….. 354<br />
USING GIS MODELING AND THE DAC STATISTIC TO ANALYZE THE SUSTAINABILITY OF DEVELOPMENT IN<br />
IALOMIłA HYDROGRAPHIC BASIN, Ioan IANOŞ, Alexandru-IonuŃ PETRIŞOR<br />
…………………………………………………………………………………………………………………………………………………………………….. 363<br />
GEOGRAPHICAL JOURNALS PUBLISHED IN ROMANIA - 2011, Dumitru RUS<br />
.......................................................................................................................................................................................................................................................... 370<br />
GEOGRAPHY AND TOURISM ON THE IADULUI VALLEY, Ribana LINC<br />
.......................................................................................................................................................................................................................................................... 374<br />
ISSN 1221-1273, E-ISSN 2065-3409