

Living Standards Measurements Study - Serbia 2002 - 2007
Living Standards Measurements Study - Serbia 2002 - 2007
Living Standards Measurements Study - Serbia 2002 - 2007

You also want an ePaper? Increase the reach of your titles
YUMPU automatically turns print PDFs into web optimized ePapers that Google loves.
7.8. Health care expenditures<br />
In <strong>2007</strong>, health care expenditures amounted to<br />
4.5 percent of total household expenditure. The<br />
share of health care expenditures in <strong>2002</strong> was<br />
slightly higher (5.4 percent). Graph 7 shows the<br />
share of health care expenditures according to the<br />
financial situation of households. It is indicative that<br />
all the observed groups of population spend around<br />
4.5 percent to 4.6 percent of their total expenditure<br />
on health care, except those living below the<br />
poverty line and the poorest households according<br />
to expenditure quintiles (3.1 percent and 3.9<br />
percent). If we consider the absolute values of<br />
average expenditures on health care, the differences<br />
become more prominent. People below poverty line<br />
spent only 188 dinars per household member per<br />
month, the poorest according to expenditure<br />
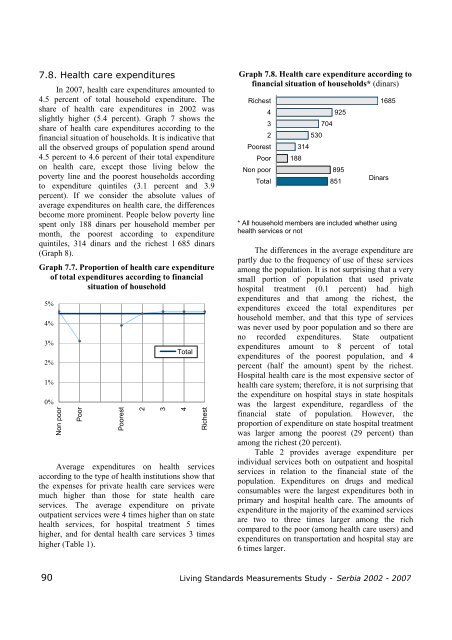
quintiles, 314 dinars and the richest 1 685 dinars<br />
(Graph 8).<br />
Graph 7.7. Proportion of health care expenditure<br />
of total expenditures according to financial<br />
situation of household<br />
5%<br />
4%<br />
3%<br />
2%<br />
1%<br />
0%<br />
Non poor<br />
Poor<br />
Poorest<br />
2<br />
3<br />
Total<br />
4<br />
Richest<br />
Average expenditures on health services<br />
according to the type of health institutions show that<br />
the expenses for private health care services were<br />
much higher than those for state health care<br />
services. The average expenditure on private<br />
outpatient services were 4 times higher than on state<br />
health services, for hospital treatment 5 times<br />
higher, and for dental health care services 3 times<br />
higher (Table 1).<br />
Graph 7.8. Health care expenditure according to<br />
financial situation of households* (dinars)<br />
Richest<br />
4<br />
3<br />
2<br />
Poorest<br />
Poor<br />
Non poor<br />
Total<br />
188<br />
314<br />
530<br />
704<br />
925<br />
895<br />
851<br />
1685<br />
Dinars<br />
* All household members are included whether using<br />
health services or not<br />
The differences in the average expenditure are<br />
partly due to the frequency of use of these services<br />
among the population. It is not surprising that a very<br />
small portion of population that used private<br />
hospital treatment (0.1 percent) had high<br />
expenditures and that among the richest, the<br />
expenditures exceed the total expenditures per<br />
household member, and that this type of services<br />
was never used by poor population and so there are<br />
no recorded expenditures. State outpatient<br />
expenditures amount to 8 percent of total<br />
expenditures of the poorest population, and 4<br />
percent (half the amount) spent by the richest.<br />
Hospital health care is the most expensive sector of<br />
health care system; therefore, it is not surprising that<br />
the expenditure on hospital stays in state hospitals<br />
was the largest expenditure, regardless of the<br />
financial state of population. However, the<br />
proportion of expenditure on state hospital treatment<br />
was larger among the poorest (29 percent) than<br />
among the richest (20 percent).<br />
Table 2 provides average expenditure per<br />
individual services both on outpatient and hospital<br />
services in relation to the financial state of the<br />
population. Expenditures on drugs and medical<br />
consumables were the largest expenditures both in<br />
primary and hospital health care. The amounts of<br />
expenditure in the majority of the examined services<br />
are two to three times larger among the rich<br />
compared to the poor (among health care users) and<br />
expenditures on transportation and hospital stay are<br />
6 times larger.<br />
90 <strong>Living</strong> <strong>Standards</strong> <strong>Measurements</strong> <strong>Study</strong> - <strong>Serbia</strong> <strong>2002</strong> - <strong>2007</strong>


