Living Standards Measurements Study - Serbia 2002 - 2007
Living Standards Measurements Study - Serbia 2002 - 2007
Living Standards Measurements Study - Serbia 2002 - 2007
You also want an ePaper? Increase the reach of your titles
YUMPU automatically turns print PDFs into web optimized ePapers that Google loves.
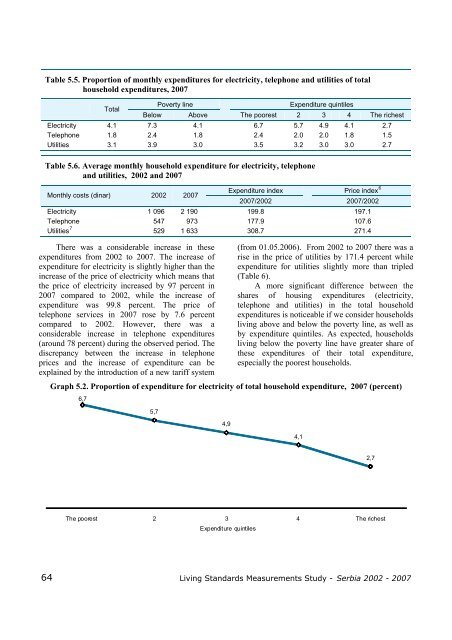
Table 5.5. Proportion of monthly expenditures for electricity, telephone and utilities of total<br />
household expenditures, <strong>2007</strong><br />
Total<br />
Poverty line<br />
Expenditure quintiles<br />
Below Above The poorest 2 3 4 The richest<br />
Electricity 4.1 7.3 4.1 6.7 5.7 4.9 4.1 2.7<br />
Telephone 1.8 2.4 1.8 2.4 2.0 2.0 1.8 1.5<br />
Utilities 3.1 3.9 3.0 3.5 3.2 3.0 3.0 2.7<br />
Table 5.6. Average monthly household expenditure for electricity, telephone<br />
and utilities, <strong>2002</strong> and <strong>2007</strong><br />
Monthly costs (dinar) <strong>2002</strong> <strong>2007</strong><br />
Expenditure index Price index 6<br />
<strong>2007</strong>/<strong>2002</strong> <strong>2007</strong>/<strong>2002</strong><br />
Electricity 1 096 2 190 199.8 197.1<br />
Telephone 547 973 177.9 107.6<br />
Utilities 7 529 1 633 308.7 271.4<br />
There was a considerable increase in these<br />
expenditures from <strong>2002</strong> to <strong>2007</strong>. The increase of<br />
expenditure for electricity is slightly higher than the<br />
increase of the price of electricity which means that<br />
the price of electricity increased by 97 percent in<br />
<strong>2007</strong> compared to <strong>2002</strong>, while the increase of<br />
expenditure was 99.8 percent. The price of<br />
telephone services in <strong>2007</strong> rose by 7.6 percent<br />
compared to <strong>2002</strong>. However, there was a<br />
considerable increase in telephone expenditures<br />
(around 78 percent) during the observed period. The<br />
discrepancy between the increase in telephone<br />
prices and the increase of expenditure can be<br />
explained by the introduction of a new tariff system<br />
(from 01.05.2006). From <strong>2002</strong> to <strong>2007</strong> there was a<br />
rise in the price of utilities by 171.4 percent while<br />
expenditure for utilities slightly more than tripled<br />
(Table 6).<br />
A more significant difference between the<br />
shares of housing expenditures (electricity,<br />
telephone and utilities) in the total household<br />
expenditures is noticeable if we consider households<br />
living above and below the poverty line, as well as<br />
by expenditure quintiles. As expected, households<br />
living below the poverty line have greater share of<br />
these expenditures of their total expenditure,<br />
especially the poorest households.<br />
Graph 5.2. Proportion of expenditure for electricity of total household expenditure, <strong>2007</strong> (percent)<br />
6,7<br />
5,7<br />
4,9<br />
4,1<br />
2,7<br />
The poorest 2 3 4 The richest<br />
Expenditure quintiles<br />
64 <strong>Living</strong> <strong>Standards</strong> <strong>Measurements</strong> <strong>Study</strong> - <strong>Serbia</strong> <strong>2002</strong> - <strong>2007</strong>


