

Living Standards Measurements Study - Serbia 2002 - 2007
Living Standards Measurements Study - Serbia 2002 - 2007
Living Standards Measurements Study - Serbia 2002 - 2007

Create successful ePaper yourself
Turn your PDF publications into a flip-book with our unique Google optimized e-Paper software.
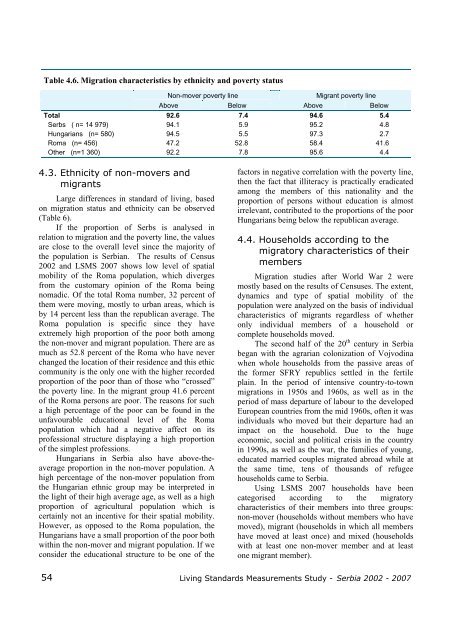
Table 4.6. Migration characteristics by ethnicity and poverty status<br />
Non-mover poverty line<br />
Migrant poverty line<br />
Above Below Above Below<br />
Total 92.6 7.4 94.6 5.4<br />
Serbs ( n= 14 979) 94.1 5.9 95.2 4.8<br />
Hungarians (n= 580) 94.5 5.5 97.3 2.7<br />
Roma (n= 456) 47.2 52.8 58.4 41.6<br />
Other (n=1 360) 92.2 7.8 95.6 4.4<br />
4.3. Ethnicity of non-movers and<br />
migrants<br />
Large differences in standard of living, based<br />
on migration status and ethnicity can be observed<br />
(Table 6).<br />
If the proportion of Serbs is analysed in<br />
relation to migration and the poverty line, the values<br />
are close to the overall level since the majority of<br />
the population is <strong>Serbia</strong>n. The results of Census<br />
<strong>2002</strong> and LSMS <strong>2007</strong> shows low level of spatial<br />
mobility of the Roma population, which diverges<br />
from the customary opinion of the Roma being<br />
nomadic. Of the total Roma number, 32 percent of<br />
them were moving, mostly to urban areas, which is<br />
by 14 percent less than the republican average. The<br />
Roma population is specific since they have<br />
extremely high proportion of the poor both among<br />
the non-mover and migrant population. There are as<br />
much as 52.8 percent of the Roma who have never<br />
changed the location of their residence and this ethic<br />
community is the only one with the higher recorded<br />
proportion of the poor than of those who “crossed”<br />
the poverty line. In the migrant group 41.6 percent<br />
of the Roma persons are poor. The reasons for such<br />
a high percentage of the poor can be found in the<br />
unfavourable educational level of the Roma<br />
population which had a negative affect on its<br />
professional structure displaying a high proportion<br />
of the simplest professions.<br />
Hungarians in <strong>Serbia</strong> also have above-theaverage<br />
proportion in the non-mover population. A<br />
high percentage of the non-mover population from<br />
the Hungarian ethnic group may be interpreted in<br />
the light of their high average age, as well as a high<br />
proportion of agricultural population which is<br />
certainly not an incentive for their spatial mobility.<br />
However, as opposed to the Roma population, the<br />
Hungarians have a small proportion of the poor both<br />
within the non-mover and migrant population. If we<br />
consider the educational structure to be one of the<br />
factors in negative correlation with the poverty line,<br />
then the fact that illiteracy is practically eradicated<br />
among the members of this nationality and the<br />
proportion of persons without education is almost<br />
irrelevant, contributed to the proportions of the poor<br />
Hungarians being below the republican average.<br />
4.4. Households according to the<br />
migratory characteristics of their<br />
members<br />
Migration studies after World War 2 were<br />
mostly based on the results of Censuses. The extent,<br />
dynamics and type of spatial mobility of the<br />
population were analyzed on the basis of individual<br />
characteristics of migrants regardless of whether<br />
only individual members of a household or<br />
complete households moved.<br />
The second half of the 20 th century in <strong>Serbia</strong><br />
began with the agrarian colonization of Vojvodina<br />
when whole households from the passive areas of<br />
the former SFRY republics settled in the fertile<br />
plain. In the period of intensive country-to-town<br />
migrations in 1950s and 1960s, as well as in the<br />
period of mass departure of labour to the developed<br />
European countries from the mid 1960s, often it was<br />
individuals who moved but their departure had an<br />
impact on the household. Due to the huge<br />
economic, social and political crisis in the country<br />
in 1990s, as well as the war, the families of young,<br />
educated married couples migrated abroad while at<br />
the same time, tens of thousands of refugee<br />
households came to <strong>Serbia</strong>.<br />
Using LSMS <strong>2007</strong> households have been<br />
categorised according to the migratory<br />
characteristics of their members into three groups:<br />
non-mover (households without members who have<br />
moved), migrant (households in which all members<br />
have moved at least once) and mixed (households<br />
with at least one non-mover member and at least<br />
one migrant member).<br />
54 <strong>Living</strong> <strong>Standards</strong> <strong>Measurements</strong> <strong>Study</strong> - <strong>Serbia</strong> <strong>2002</strong> - <strong>2007</strong>


