

Living Standards Measurements Study - Serbia 2002 - 2007
Living Standards Measurements Study - Serbia 2002 - 2007
Living Standards Measurements Study - Serbia 2002 - 2007

You also want an ePaper? Increase the reach of your titles
YUMPU automatically turns print PDFs into web optimized ePapers that Google loves.
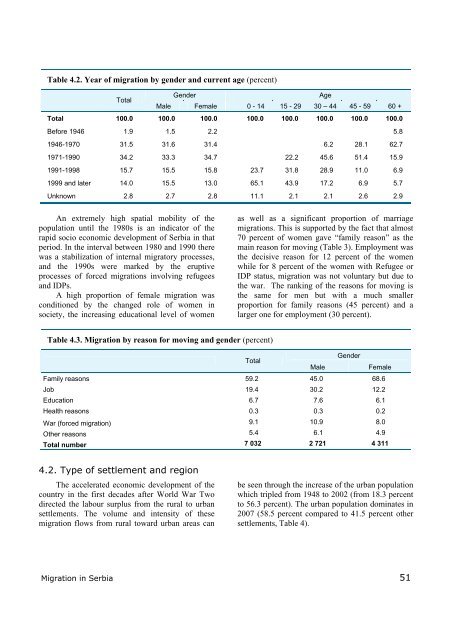
Table 4.2. Year of migration by gender and current age (percent)<br />
Total<br />
Gender<br />
Age<br />
Male Female 0 - 14 15 - 29 30 – 44 45 - 59 60 +<br />
Total 100.0 100.0 100.0 100.0 100.0 100.0 100.0 100.0<br />
Before 1946 1.9 1.5 2.2 5.8<br />
1946-1970 31.5 31.6 31.4 6.2 28.1 62.7<br />
1971-1990 34.2 33.3 34.7 22.2 45.6 51.4 15.9<br />
1991-1998 15.7 15.5 15.8 23.7 31.8 28.9 11.0 6.9<br />
1999 and later 14.0 15.5 13.0 65.1 43.9 17.2 6.9 5.7<br />
Unknown 2.8 2.7 2.8 11.1 2.1 2.1 2.6 2.9<br />
An extremely high spatial mobility of the<br />
population until the 1980s is an indicator of the<br />
rapid socio economic development of <strong>Serbia</strong> in that<br />
period. In the interval between 1980 and 1990 there<br />
was a stabilization of internal migratory processes,<br />
and the 1990s were marked by the eruptive<br />
processes of forced migrations involving refugees<br />
and IDPs.<br />
A high proportion of female migration was<br />
conditioned by the changed role of women in<br />
society, the increasing educational level of women<br />
as well as a significant proportion of marriage<br />
migrations. This is supported by the fact that almost<br />
70 percent of women gave “family reason” as the<br />
main reason for moving (Table 3). Employment was<br />
the decisive reason for 12 percent of the women<br />
while for 8 percent of the women with Refugee or<br />
IDP status, migration was not voluntary but due to<br />
the war. The ranking of the reasons for moving is<br />
the same for men but with a much smaller<br />
proportion for family reasons (45 percent) and a<br />
larger one for employment (30 percent).<br />
Table 4.3. Migration by reason for moving and gender (percent)<br />
Total<br />
Gender<br />
Male<br />
Female<br />
Family reasons 59.2 45.0 68.6<br />
Job 19.4 30.2 12.2<br />
Education 6.7 7.6 6.1<br />
Health reasons 0.3 0.3 0.2<br />
War (forced migration) 9.1 10.9 8.0<br />
Other reasons 5.4 6.1 4.9<br />
Total number 7 032 2 721 4 311<br />
4.2. Type of settlement and region<br />
The accelerated economic development of the<br />
country in the first decades after World War Two<br />
directed the labour surplus from the rural to urban<br />
settlements. The volume and intensity of these<br />
migration flows from rural toward urban areas can<br />
be seen through the increase of the urban population<br />
which tripled from 1948 to <strong>2002</strong> (from 18.3 percent<br />
to 56.3 percent). The urban population dominates in<br />
<strong>2007</strong> (58.5 percent compared to 41.5 percent other<br />
settlements, Table 4).<br />
Migration in <strong>Serbia</strong><br />
51


