- Page 1:
Living Standards Measurement Study
- Page 4 and 5:
Publisher: Statistical Office of th
- Page 6 and 7:
The statistical system of Serbia ha
- Page 9:
Living Standards Measurements Study
- Page 12 and 13:
1. POVERTY PROFILE IN SERBIA IN THE
- Page 14 and 15:
Absolute and extreme poverty of Rom
- Page 16 and 17:
Table 1.4. Subjective evaluation of
- Page 18 and 19:
However, notwithstanding the highli
- Page 20 and 21:
Table 1.8. Poverty by regions in Se
- Page 22 and 23:
1.9. Education and demographic feat
- Page 24 and 25:
Table 1.14. Poverty by household ty
- Page 26 and 27:
Table 1.16. Regression of consumpti
- Page 28 and 29:
2. The total number of the poor hal
- Page 31 and 32:
Natasa Mijakovac Income and expendi
- Page 33 and 34:
Aggregate income does not contain r
- Page 35 and 36:
In the five-year period, the struct
- Page 37 and 38:
’Х’ axis, except for the last
- Page 39 and 40:
Таble 2.6. Average monthly expend
- Page 41 and 42:
Graph 2.5. Cumulative overview of h
- Page 43:
2.5. Conclusion 1. From 2002 - 2007
- Page 46 and 47:
3. DEMOGRAPHIC CHARACTERISTICS OF T
- Page 48 and 49:
widows were aged over 60 and 17 per
- Page 50 and 51:
However, there is an increase in th
- Page 52 and 53:
4. MIGRATION IN SERBIA Migration as
- Page 54 and 55:
Table 4.4. Migration by type of set
- Page 56 and 57:
Table 4.6. Migration characteristic
- Page 58 and 59:
Graph 4.3. Households by migratory
- Page 60 and 61:
5. HOUSING CONDITIONS AND POSSESION
- Page 62 and 63:
Table 5.1. Indicators of housing co
- Page 64 and 65:
Table 5.2. Households by type of he
- Page 66 and 67:
Table 5.5. Proportion of monthly ex
- Page 68 and 69:
Table 5.10. Average number of month
- Page 71 and 72:
Mirosinka Dinkic Social welfare in
- Page 73 and 74:
municipality level. Again, municipa
- Page 75 and 76:
6.1.4. Amounts of benefit received
- Page 77 and 78:
support from authorities to fill in
- Page 79 and 80:
It is noticeable that more PWDs age
- Page 81 and 82:
Graph 6.6. PWDs by education level
- Page 83 and 84:
6.2.6. Health care of PWDs LSMS sho
- Page 85 and 86:
Jasmina Grozdanov Health 7 7.1. Int
- Page 87 and 88:
educe the negative trends in the he
- Page 89 and 90:
7.5. Use of Health Care Services ac
- Page 91 and 92:
given significantly more by residen
- Page 93 and 94:
Table 7.1. Average expenditure on s
- Page 95 and 96:
Snezana Klasnja Education 8 Introdu
- Page 97 and 98:
study of mother tongue and elements
- Page 99 and 100:
Graph 8.1. School attendance, relat
- Page 101 and 102:
distributed geographically. Accordi
- Page 103 and 104:
8.3. Primary education 8.3.1. Gener
- Page 105 and 106:
and only children from families wit
- Page 107 and 108:
The number of classes and teachers
- Page 109 and 110:
Participation of young people in va
- Page 111 and 112:
universities, pursuant to approved
- Page 113 and 114:
Table 8.1. shows the proportion of
- Page 115:
Endnotes, Part 8 1 All data refer t
- Page 118 and 119:
9. EMPLOYMENT STATUS Despite signif
- Page 120 and 121:
the past five years did not lead to
- Page 122 and 123:
Table 9.6. Employment and unemploym
- Page 124 and 125:
If the economic position of the emp
- Page 126 and 127:
possible to examine hidden unemploy
- Page 128 and 129:
Graph 9.7. Employment and unemploym
- Page 130 and 131:
job. While 26 percent of the popula
- Page 132 and 133:
Table 9.13. Respondents aged 15+ by
- Page 135 and 136:
Natalija Bogdanov Agriculture 10 10
- Page 137 and 138:
10.2. Rural poverty in Serbia Inter
- Page 139 and 140:
Box 4. Types of Individual Agricult
- Page 141 and 142:
Graph 10.2. Income of rural househo
- Page 143 and 144:
favourable compared to the non-agri
- Page 145 and 146:
The physical capital of agricultura
- Page 147 and 148:
Graph 10.12. Structure of farms by
- Page 149 and 150:
The greatest profit from animal liv
- Page 151 and 152: Table 10.5. Features of agricultura
- Page 153: 7. Bogdanov N. (2007): «Small Rura
- Page 156 and 157: 11. WATER AND SANITATION SERVICES (
- Page 158 and 159: Table 11.2. Water and sewerage char
- Page 160 and 161: The improvements varied by both typ
- Page 162 and 163: 11.13. Contact with water suppliers
- Page 164 and 165: 162 Living Standards Measurements S
- Page 166 and 167: 12. METHODOLOGY 12.1. Fieldwork App
- Page 168 and 169: 12.2. Data production Data files ar
- Page 170 and 171: p hij = overall probability of sele
- Page 172 and 173: 12.4.1. Comparing number of househo
- Page 174 and 175: Table 12.6. New Estimates of Total
- Page 176 and 177: ent paid by the tenants was used. I
- Page 178 and 179: from the separate survey on regiona
- Page 180 and 181: steps. First, the daily caloric val
- Page 182 and 183: poverty in Serbia in 2007 were impr
- Page 185 and 186: Annex А 183
- Page 187 and 188: Annex Table 1.2. Household Sample S
- Page 189 and 190: Annex Table 2.2. Monthly consumptio
- Page 191 and 192: Annex Table 2.4. Monthly income per
- Page 193 and 194: Annex Table 3.3. Household residenc
- Page 195 and 196: Annex Table 3.5. Education level (p
- Page 197 and 198: Annex Table 3.7. Reason why do not
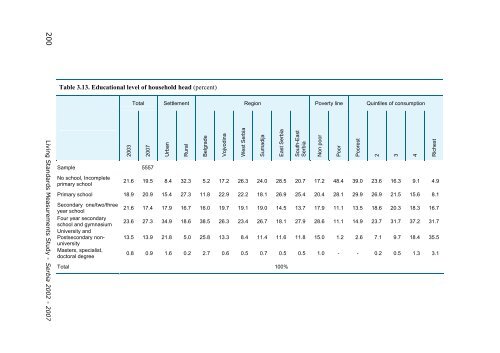
- Page 199 and 200: Annex Table 3.9. Individual economi
- Page 201: Annex Table 3.12. Marital status of
- Page 205 and 206: Annex Table 3.16. Number of househo
- Page 207 and 208: Annex Table 3.19. Households with o
- Page 209 and 210: Annex Table 3.21. Households by num
- Page 211 and 212: Annex Table 5.3. Average number of
- Page 213 and 214: Annex Table 5.6. Households with in
- Page 215 and 216: Annex Table 5.8. Average household
- Page 217 and 218: Annex Table 5.10. Average household
- Page 219 and 220: Annex Table 5.14. Household durable
- Page 221 and 222: Annex Table 5.16. Household ownersh
- Page 223 and 224: Annex Table 6.2. Average amount rec
- Page 225 and 226: Annex Table 6.4. Reasons for non ap
- Page 227 and 228: Annex Table 6.7. Reason did not app
- Page 229 and 230: Annex Table 6.10. Reason did not ap
- Page 231 and 232: Annex Table 7.1. Whether respondent
- Page 233 and 234: Annex Table 7.3. Whether respondent
- Page 235 and 236: Annex Table 7.6. Whether respondent
- Page 237 and 238: Annex Table 7.9. Respondents use of
- Page 239 and 240: Annex Table 7.12. Average frequency
- Page 241 and 242: Table 7.14. Respondents insured in
- Page 243 and 244: Annex Table 7.16. Respondents with
- Page 245 and 246: Annex Table 8.2. Children from 3 to
- Page 247 and 248: Annex Table 8.4. Children from 3 to
- Page 249 and 250: Table 8.6. Average number of hours
- Page 251 and 252: Annex Table 8.9. Children from 7 to
- Page 253 and 254:
Annex Table 8.12. Average amount sp
- Page 255 and 256:
Table 8.14. Children from 15 to 19
- Page 257 and 258:
Annex Table 8.17. Percentage of cit
- Page 259 and 260:
Annex Table 8.20. Average value of
- Page 261 and 262:
Annex Table 9.2. Population 15+ by
- Page 263 and 264:
Annex Table 9.5. Employed 15+ by Ac
- Page 265 and 266:
Annex Table 9.8. Employment by owne
- Page 267 and 268:
Annex Table 9.11. Average number of
- Page 269 and 270:
Annex Table 9.15. Average amount re
- Page 271 and 272:
Annex Table 10.2. Agricultural hous
- Page 273 and 274:
Annex Table 10.5. Agricultural hous
- Page 275 and 276:
Annex Table 10.9. Agricultural hous
- Page 277 and 278:
Annex Table 10.11. Households which
- Page 279 and 280:
Annex Table 10.13. Estimated value
- Page 281 and 282:
Annex Table 10.15. Average estimate
- Page 283 and 284:
Annex Table 10.18. Agricultural hou