

Living Standards Measurements Study - Serbia 2002 - 2007
Living Standards Measurements Study - Serbia 2002 - 2007
Living Standards Measurements Study - Serbia 2002 - 2007

Create successful ePaper yourself
Turn your PDF publications into a flip-book with our unique Google optimized e-Paper software.
from the separate survey on regional property<br />
market prices in <strong>Serbia</strong>.<br />
The food price index was calculated for 6 basic<br />
regions in <strong>Serbia</strong>, as well as for urban/rural areas<br />
within each region. Hence, the regional food price<br />
index covered 12 regions. These regions were also<br />
used to calculate the regional property price index.<br />
As the LSMS did not collect data on prices of<br />
goods, the price per unit of a good was calculated as<br />
the ratio of expenditures and quantities purchased<br />
for each food item. These unit prices were used to<br />
calculate the individual food price index for each<br />
household. The price of food item k for region r is<br />
calculated as the median of the unit price for that<br />
good in that region. The reference price p k,0 is<br />
calculated as the median unit price of that good for<br />
the whole country. If the frequency of the price of a<br />
food item in one region is less than 5, or if it has<br />
been determined that the value is an outlier (5 times<br />
greater than the unit price for the whole country or<br />
less than one-fifth of the national unit price), then its<br />
regional price is replaced with the country-level<br />
price of the good. The regional food price index is<br />
the median food price index of all households in the<br />
region.<br />
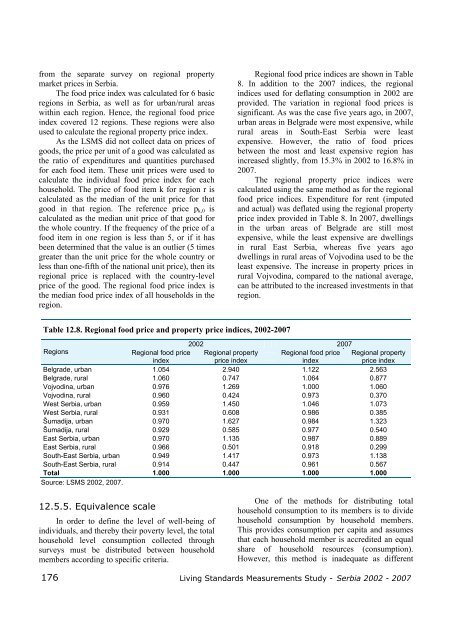
Regional food price indices are shown in Table<br />
8. In addition to the <strong>2007</strong> indices, the regional<br />
indices used for deflating consumption in <strong>2002</strong> are<br />
provided. The variation in regional food prices is<br />
significant. As was the case five years ago, in <strong>2007</strong>,<br />
urban areas in Belgrade were most expensive, while<br />
rural areas in South-East <strong>Serbia</strong> were least<br />
expensive. However, the ratio of food prices<br />
between the most and least expensive region has<br />
increased slightly, from 15.3% in <strong>2002</strong> to 16.8% in<br />
<strong>2007</strong>.<br />
The regional property price indices were<br />
calculated using the same method as for the regional<br />
food price indices. Expenditure for rent (imputed<br />
and actual) was deflated using the regional property<br />
price index provided in Table 8. In <strong>2007</strong>, dwellings<br />
in the urban areas of Belgrade are still most<br />
expensive, while the least expensive are dwellings<br />
in rural East <strong>Serbia</strong>, whereas five years ago<br />
dwellings in rural areas of Vojvodina used to be the<br />
least expensive. The increase in property prices in<br />
rural Vojvodina, compared to the national average,<br />
can be attributed to the increased investments in that<br />
region.<br />
Table 12.8. Regional food price and property price indices, <strong>2002</strong>-<strong>2007</strong><br />
<strong>2002</strong> <strong>2007</strong><br />
Regions<br />
Regional food price<br />
index<br />
Regional property<br />
price index<br />
Regional food price<br />
index<br />
Regional property<br />
price index<br />
Belgrade, urban 1.054 2.940 1.122 2.563<br />
Belgrade, rural 1.060 0.747 1.064 0.877<br />
Vojvodina, urban 0.976 1.269 1.000 1.060<br />
Vojvodina, rural 0.960 0.424 0.973 0.370<br />
West <strong>Serbia</strong>, urban 0.959 1.450 1.046 1.073<br />
West <strong>Serbia</strong>, rural 0.931 0.608 0.986 0.385<br />
Šumadija, urban 0.970 1.627 0.984 1.323<br />
Šumadija, rural 0.929 0.585 0.977 0.540<br />
East <strong>Serbia</strong>, urban 0.970 1.135 0.987 0.889<br />
East <strong>Serbia</strong>, rural 0.966 0.501 0.918 0.299<br />
South-East <strong>Serbia</strong>, urban 0.949 1.417 0.973 1.138<br />
South-East <strong>Serbia</strong>, rural 0.914 0.447 0.961 0.567<br />
Total 1.000 1.000 1.000 1.000<br />
Source: LSMS <strong>2002</strong>, <strong>2007</strong>.<br />
12.5.5. Equivalence scale<br />
In order to define the level of well-being of<br />
individuals, and thereby their poverty level, the total<br />
household level consumption collected through<br />
surveys must be distributed between household<br />
members according to specific criteria.<br />
One of the methods for distributing total<br />
household consumption to its members is to divide<br />
household consumption by household members.<br />
This provides consumption per capita and assumes<br />
that each household member is accredited an equal<br />
share of household resources (consumption).<br />
However, this method is inadequate as different<br />
176 <strong>Living</strong> <strong>Standards</strong> <strong>Measurements</strong> <strong>Study</strong> - <strong>Serbia</strong> <strong>2002</strong> - <strong>2007</strong>


