

Living Standards Measurements Study - Serbia 2002 - 2007
Living Standards Measurements Study - Serbia 2002 - 2007
Living Standards Measurements Study - Serbia 2002 - 2007

Create successful ePaper yourself
Turn your PDF publications into a flip-book with our unique Google optimized e-Paper software.
p hij = overall probability of selection for a<br />
sample household in the j-th sample dwelling unit<br />
selected in the i-th sample ED in stratum h<br />
n h = number of sample EDs selected in<br />
stratum h<br />
M hi = number of occupied dwelling units<br />
from the <strong>2002</strong> <strong>Serbia</strong> Census frame for the i-th<br />
sample ED in stratum h<br />
M h = total number of occupied dwelling<br />
units in the <strong>2002</strong> Census frame (cumulated measure<br />
of size) for stratum h<br />
m hi = 14 = number of occupied dwelling<br />
units selected for the LSMS from the updated listing<br />
in the i-th sample ED in stratum h<br />
M’ hi = number of currently occupied<br />
dwelling units the i-th sample ED in stratum h from<br />
the updated listing<br />
k hij = number of households in the j-th<br />
sample dwelling unit selected in the i-th sample ED<br />
in stratum h<br />
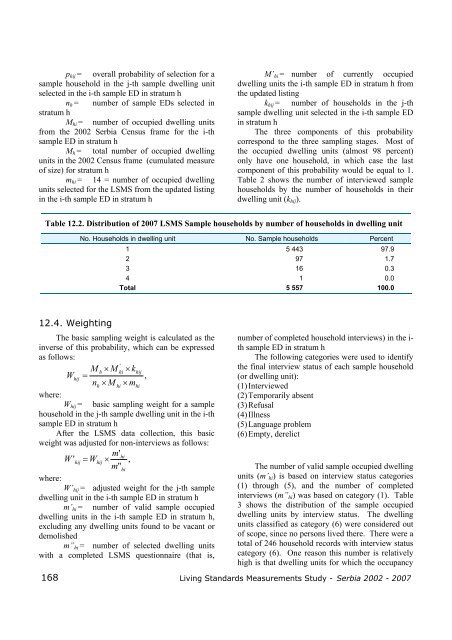
The three components of this probability<br />
correspond to the three sampling stages. Most of<br />
the occupied dwelling units (almost 98 percent)<br />
only have one household, in which case the last<br />
component of this probability would be equal to 1.<br />
Table 2 shows the number of interviewed sample<br />
households by the number of households in their<br />
dwelling unit (k hij ).<br />
Table 12.2. Distribution of <strong>2007</strong> LSMS Sample households by number of households in dwelling unit<br />
No. Households in dwelling unit No. Sample households Percent<br />
1 5 443 97.9<br />
2 97 1.7<br />
3 16 0.3<br />
4 1 0.0<br />
Total 5 557 100.0<br />
12.4. Weighting<br />
The basic sampling weight is calculated as the<br />
inverse of this probability, which can be expressed<br />
as follows:<br />
'<br />
M<br />
h<br />
× M<br />
hi<br />
× khij<br />
Whij<br />
=<br />
,<br />
nh<br />
× M<br />
hi<br />
× mhi<br />
where:<br />
W hij = basic sampling weight for a sample<br />
household in the j-th sample dwelling unit in the i-th<br />
sample ED in stratum h<br />
After the LSMS data collection, this basic<br />
weight was adjusted for non-interviews as follows:<br />
m'<br />
hi<br />
W '<br />
hij<br />
= Whij<br />
× ,<br />
m"<br />
hi<br />
where:<br />
W’ hij = adjusted weight for the j-th sample<br />
dwelling unit in the i-th sample ED in stratum h<br />
m’ hi = number of valid sample occupied<br />
dwelling units in the i-th sample ED in stratum h,<br />
excluding any dwelling units found to be vacant or<br />
demolished<br />
m” hi = number of selected dwelling units<br />
with a completed LSMS questionnaire (that is,<br />
number of completed household interviews) in the i-<br />
th sample ED in stratum h<br />
The following categories were used to identify<br />
the final interview status of each sample household<br />
(or dwelling unit):<br />
(1) Interviewed<br />
(2) Temporarily absent<br />
(3) Refusal<br />
(4) Illness<br />
(5) Language problem<br />
(6) Empty, derelict<br />
The number of valid sample occupied dwelling<br />
units (m’ hi ) is based on interview status categories<br />
(1) through (5), and the number of completed<br />
interviews (m” hi ) was based on category (1). Table<br />
3 shows the distribution of the sample occupied<br />
dwelling units by interview status. The dwelling<br />
units classified as category (6) were considered out<br />
of scope, since no persons lived there. There were a<br />
total of 246 household records with interview status<br />
category (6). One reason this number is relatively<br />
high is that dwelling units for which the occupancy<br />
168 <strong>Living</strong> <strong>Standards</strong> <strong>Measurements</strong> <strong>Study</strong> - <strong>Serbia</strong> <strong>2002</strong> - <strong>2007</strong>


