

Living Standards Measurements Study - Serbia 2002 - 2007
Living Standards Measurements Study - Serbia 2002 - 2007
Living Standards Measurements Study - Serbia 2002 - 2007

Create successful ePaper yourself
Turn your PDF publications into a flip-book with our unique Google optimized e-Paper software.
job. While 26 percent of the population receive<br />
pensions and slightly over one third of respondents<br />
said that they do not have any labour-related<br />
income.<br />
Differences in type of income are closely<br />
linked with gender and education. Nearly 45 percent<br />
of men earn income from their current job compared<br />
to 29 percent of women. But over 40 percent of<br />
women do not have any labour-related income<br />
compared to 26 percent of men. In relation to those<br />
with a low level of education it is typical that more<br />
people generate income from pensions (36.4<br />
percent) than from salaries (17.8 percent), which is<br />
the result of their difficulties to find employment,<br />
while 45.1 percent of the poorly educated do not<br />
earn any labour-related income. Among people with<br />
secondary education, the majority (45.5 percent) of<br />
them earn income from their current job, 31 percent<br />
are without any income, while 18.5 percent get<br />
income from pensions. As much as 55 percent of<br />
the population with college and university education<br />
earns income from their current job, a quarter from<br />
pensions and 12 percent do not have any income at<br />
all.10F10F11<br />
There are no major regional differences in<br />
relation to sources of labour income.<br />
More than 52 percent of people aged 15+ who<br />
are living below poverty line have no labour-related<br />
income. Only 21 percent of the poor get income<br />
from a main job.<br />
From <strong>2002</strong> to <strong>2007</strong> the average employees’<br />
labour-related income from main job increased by<br />
2.5 times. Nominally it grew at an impressive<br />
average annual rate of 19.6 percent. The actual<br />
growth during the five years (following deflation<br />
12<br />
based on the Cost of <strong>Living</strong> Index)11F11F was 43<br />
percent.<br />
There are significant differences in average<br />
incomes from main job. In relation to education<br />
level, the salaries of those with college and<br />
university education are 2.7 times higher than the<br />
average income of those with a lower level of<br />
education. The salaries in urban areas are 49<br />
percent higher than the salaries in other areas. The<br />
average salary for women is lower than the average<br />
salary for men by 9 percent. Regionally, the<br />
average salaries in Belgrade are 50 percent higher<br />
than average salaries in other regions. There are no<br />
significant differences in the level of average<br />
salaries between the other regions.<br />
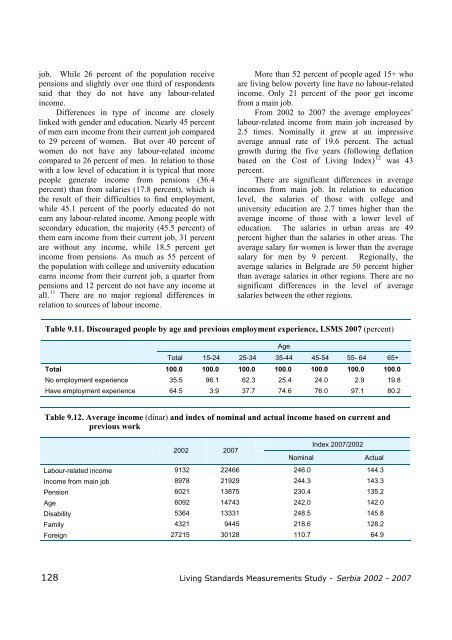
Table 9.11. Discouraged people by age and previous employment experience, LSMS <strong>2007</strong> (percent)<br />
Age<br />
Total 15-24 25-34 35-44 45-54 55- 64 65+<br />
Total 100.0 100.0 100.0 100.0 100.0 100.0 100.0<br />
No employment experience 35.5 96.1 62.3 25.4 24.0 2.9 19.8<br />
Have employment experience 64.5 3.9 37.7 74.6 76.0 97.1 80.2<br />
Table 9.12. Average income (dinar) and index of nominal and actual income based on current and<br />
previous work<br />
<strong>2002</strong> <strong>2007</strong><br />
Nominal<br />
Index <strong>2007</strong>/<strong>2002</strong><br />
Actual<br />
Labour-related income 9132 22466 246.0 144.3<br />
Income from main job 8978 21929 244.3 143.3<br />
Pension 6021 13875 230.4 135.2<br />
Age 6092 14743 242.0 142.0<br />
Disability 5364 13331 248.5 145.8<br />
Family 4321 9445 218.6 128.2<br />
Foreign 27215 30128 110.7 64.9<br />
128 <strong>Living</strong> <strong>Standards</strong> <strong>Measurements</strong> <strong>Study</strong> - <strong>Serbia</strong> <strong>2002</strong> - <strong>2007</strong>


