

Living Standards Measurements Study - Serbia 2002 - 2007
Living Standards Measurements Study - Serbia 2002 - 2007
Living Standards Measurements Study - Serbia 2002 - 2007

You also want an ePaper? Increase the reach of your titles
YUMPU automatically turns print PDFs into web optimized ePapers that Google loves.
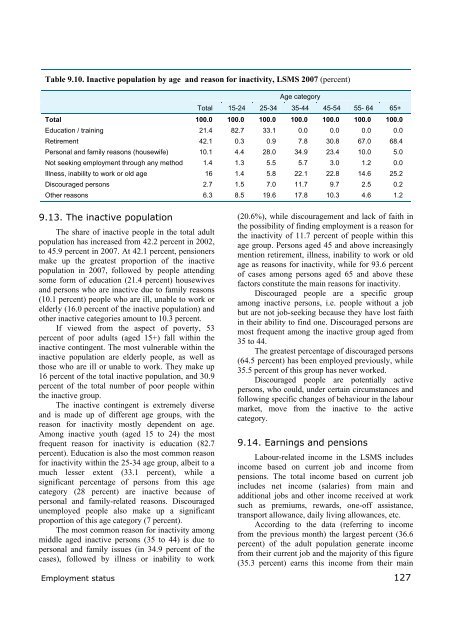
Table 9.10. Inactive population by age and reason for inactivity, LSMS <strong>2007</strong> (percent)<br />
Age category<br />
Total 15-24 25-34 35-44 45-54 55- 64 65+<br />
Total 100.0 100.0 100.0 100.0 100.0 100.0 100.0<br />
Education / training 21.4 82.7 33.1 0.0 0.0 0.0 0.0<br />
Retirement 42.1 0.3 0.9 7.8 30.8 67.0 68.4<br />
Personal and family reasons (housewife) 10.1 4.4 28.0 34.9 23.4 10.0 5.0<br />
Not seeking employment through any method 1.4 1.3 5.5 5.7 3.0 1.2 0.0<br />
Illness, inability to work or old age 16 1.4 5.8 22.1 22.8 14.6 25.2<br />
Discouraged persons 2.7 1.5 7.0 11.7 9.7 2.5 0.2<br />
Other reasons 6.3 8.5 19.6 17.8 10.3 4.6 1.2<br />
9.13. The inactive population<br />
The share of inactive people in the total adult<br />
population has increased from 42.2 percent in <strong>2002</strong>,<br />
to 45.9 percent in <strong>2007</strong>. At 42.1 percent, pensioners<br />
make up the greatest proportion of the inactive<br />
population in <strong>2007</strong>, followed by people attending<br />
some form of education (21.4 percent) housewives<br />
and persons who are inactive due to family reasons<br />
(10.1 percent) people who are ill, unable to work or<br />
elderly (16.0 percent of the inactive population) and<br />
other inactive categories amount to 10.3 percent.<br />
If viewed from the aspect of poverty, 53<br />
percent of poor adults (aged 15+) fall within the<br />
inactive contingent. The most vulnerable within the<br />
inactive population are elderly people, as well as<br />
those who are ill or unable to work. They make up<br />
16 percent of the total inactive population, and 30.9<br />
percent of the total number of poor people within<br />
the inactive group.<br />
The inactive contingent is extremely diverse<br />
and is made up of different age groups, with the<br />
reason for inactivity mostly dependent on age.<br />
Among inactive youth (aged 15 to 24) the most<br />
frequent reason for inactivity is education (82.7<br />
percent). Education is also the most common reason<br />
for inactivity within the 25-34 age group, albeit to a<br />
much lesser extent (33.1 percent), while a<br />
significant percentage of persons from this age<br />
category (28 percent) are inactive because of<br />
personal and family-related reasons. Discouraged<br />
unemployed people also make up a significant<br />
proportion of this age category (7 percent).<br />
The most common reason for inactivity among<br />
middle aged inactive persons (35 to 44) is due to<br />
personal and family issues (in 34.9 percent of the<br />
cases), followed by illness or inability to work<br />
Employment status<br />
(20.6%), while discouragement and lack of faith in<br />
the possibility of finding employment is a reason for<br />
the inactivity of 11.7 percent of people within this<br />
age group. Persons aged 45 and above increasingly<br />
mention retirement, illness, inability to work or old<br />
age as reasons for inactivity, while for 93.6 percent<br />
of cases among persons aged 65 and above these<br />
factors constitute the main reasons for inactivity.<br />
Discouraged people are a specific group<br />
among inactive persons, i.e. people without a job<br />
but are not job-seeking because they have lost faith<br />
in their ability to find one. Discouraged persons are<br />
most frequent among the inactive group aged from<br />
35 to 44.<br />
The greatest percentage of discouraged persons<br />
(64.5 percent) has been employed previously, while<br />
35.5 percent of this group has never worked.<br />
Discouraged people are potentially active<br />
persons, who could, under certain circumstances and<br />
following specific changes of behaviour in the labour<br />
market, move from the inactive to the active<br />
category.<br />
9.14. Earnings and pensions<br />
Labour-related income in the LSMS includes<br />
income based on current job and income from<br />
pensions. The total income based on current job<br />
includes net income (salaries) from main and<br />
additional jobs and other income received at work<br />
such as premiums, rewards, one-off assistance,<br />
transport allowance, daily living allowances, etc.<br />
According to the data (referring to income<br />
from the previous month) the largest percent (36.6<br />
percent) of the adult population generate income<br />
from their current job and the majority of this figure<br />
(35.3 percent) earns this income from their main<br />
127


