Future Outlook PLN's Coal Fired Power Plant
Future Outlook PLN's Coal Fired Power Plant
Future Outlook PLN's Coal Fired Power Plant

You also want an ePaper? Increase the reach of your titles
YUMPU automatically turns print PDFs into web optimized ePapers that Google loves.
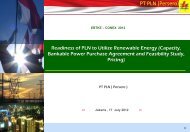
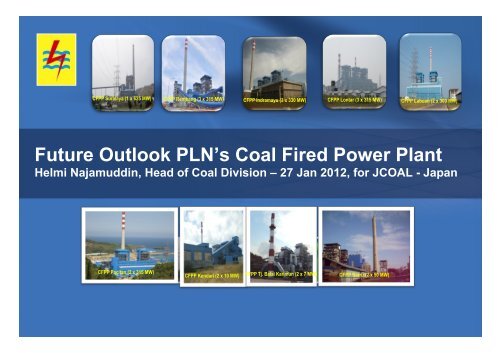
CFPP Suralaya (1 x 625 MW)<br />
CFPP Rembang (3 x 315 MW)<br />
CFPP Indramayu (3 x 330 MW)<br />
CFPP Lontar (3 x 315 MW)<br />
CFPP Labuan (2 x 300 MW)<br />
<strong>Future</strong> <strong>Outlook</strong> PLN’s <strong>Coal</strong> <strong>Fired</strong> <strong>Power</strong> <strong>Plant</strong><br />
Helmi Najamuddin, Head of <strong>Coal</strong> Division – 27 Jan 2012, for JCOAL - Japan<br />
CFPP Pacitan (2 x 315 MW)<br />
CFPP Kendari (2 x 10 MW)<br />
CFPP Tj. Balai Karimun (2 x 7 MW)<br />
CFPP Barru (2 x 50 MW)
Table of Contents<br />
1. Company Overview<br />
2. <strong>Coal</strong> Overview<br />
3. Update 10 000 MW – Fast Track Program Phase I<br />
4. <strong>Coal</strong> Policy in PLN<br />
5. Business Opportunities<br />
1
1. Company Overview
Corporate Structure<br />
Ministry of State Owned<br />
Enterprises (MSOE)<br />
Ministry of Energy and Mineral<br />
Resources (MEMR)<br />
Ministry of Finance (MoF)<br />
Ministry of the Environment<br />
National Development Planning<br />
Authority (BAPPENAS)<br />
Oversight<br />
PT PLN (Persero)<br />
100% Owned by Government of<br />
Indonesia<br />
PT Indonesia <strong>Power</strong><br />
PT Pembangkitan<br />
Jawa Bali<br />
PT PLN Batam<br />
PT PLN Tarakan<br />
Electricity Generation<br />
Electricity Generation<br />
Regional Fully<br />
Integrated Electric Utility<br />
Regional Fully<br />
Integrated Electric Utility<br />
Majapahit Holding B.V.<br />
Financial Institution<br />
PT Indonesia Comnets<br />
Plus<br />
Telecommunications for<br />
the Electricity Sector<br />
PT Prima Layanan<br />
Nasional Enjiniring<br />
Engineering and<br />
Construction Services<br />
PT PLN Batubara<br />
<strong>Coal</strong> Supplier for PLN<br />
PT Pelayaran<br />
Bahtera Adhiguna<br />
<strong>Coal</strong> Shipping Activities<br />
PT PLN Geothermal<br />
Geothermal Energy<br />
Generation<br />
Note: Excludes Joint Ventures.<br />
3
Introduction<br />
PLN is the only state-owned power utility company and the only fully-integrated power utility company in Indonesia.<br />
<br />
<br />
<br />
PLN is Indonesia’s state-owned electric utility company, wholly-owned by the Republic of Indonesia and is represented by the Ministry of State-Owned<br />
Enterprises (SOEs)<br />
PLN is the major provider of all public electricity and electricity infrastructure in Indonesia, including power generation, transmission, distribution and retail sales<br />
of electricity<br />
Charges for electricity are based on electricity tariff rates that are set by the Government<br />
– Law No. 19/2003 on SOEs: the Government is obligated to provide a subsidy to PLN for the difference between the price charged for electricity and the<br />
cost to produce electricity<br />
Key Business Segments<br />
<br />
<br />
<br />
Generation<br />
Controls approximately 28,308 MW of<br />
installed generating capacity, over 85% of<br />
Indonesia’s total<br />
Owns and operates 1,261 generation plants<br />
Main purchaser of electricity from<br />
Independent <strong>Power</strong> Producers (IPPs)<br />
<br />
<br />
<br />
Transmission<br />
Sole provider of power transmission in<br />
Indonesia<br />
Approximately 36,741 kmc of transmission<br />
lines<br />
66,354 MVA of transmission transformer<br />
capacity<br />
<br />
<br />
<br />
Distribution<br />
Sole distributor of electricity to end<br />
customers in Indonesia (1)<br />
Approximately 685,785 kmc of distribution<br />
lines and 36,430 MVA of transformer<br />
capacity<br />
Serving approximately 44 million customers<br />
Electricity Sales<br />
(In TWh)<br />
180<br />
Customer Base<br />
(In millions)<br />
60<br />
150<br />
120<br />
113<br />
121<br />
129<br />
135<br />
147<br />
50<br />
40<br />
36<br />
37<br />
39 40<br />
42<br />
44<br />
90<br />
77<br />
30<br />
60<br />
20<br />
30<br />
10<br />
0<br />
2006 2007 2008 2009 2010 1H 2011<br />
0<br />
2006 2007 2008 2009 2010 1H 2011<br />
4<br />
(1) PLN is also the provider of electricity of last resort, in that if PLN is not supplying a particular area and there are no regional-owned companies, private enterprises or<br />
cooperatives that elect to supply electricity in that area, the Government is obligated to instruct SOEs (which includes PLN) to supply electricity to the area.
2<br />
Dominant Presence in the Indonesian Electricity Market<br />
PLN is the only integrated electric utility company in Indonesia, controls the majority of generation capacity and is the<br />
sole transmission and distribution provider.<br />
Generation<br />
Transmission<br />
Distribution<br />
<br />
28,308 MW of installed capacity out of 36,741 kmc of transmission lines<br />
33,251 MW in Indonesia (1) 66,354 MVA of transmission transformer<br />
capacity<br />
<br />
<br />
685,785 kmc of distribution lines<br />
36,430 MVA of transformer capacity<br />
PLN<br />
85%<br />
IPPs<br />
15%<br />
PLN<br />
100%<br />
PLN<br />
100%<br />
<br />
<br />
PLN remains the country’s largest electricity producer and the only business entity in charge of transmitting and distributing electric power in<br />
Indonesia<br />
Under the New Electricity Law (No. 30/2009), SOEs, which includes PLN, have the first priority to decide whether to be the electricity<br />
supplier for the public needs of a specified area before such right can be awarded to anyone else<br />
– If PLN declines to undertake a public electricity supply business for a certain area, the Government or regional governments may offer<br />
this right to regional-owned companies, private enterprises or cooperatives<br />
§<br />
If there are no regional-owned companies, private enterprises or cooperatives that elect to supply electricity in that area, the<br />
Government is obligated to instruct SOEs (which includes PLN) to supply electricity to the area<br />
(1) As of June 30, 2011.<br />
5
Business Snapshot as of June 30, 2011<br />
PLN distributes and sells electricity to several customer types. The electricity sold is either generated by PLN or<br />
purchased from IPPs.<br />
Generation Composition<br />
Generating Capacity<br />
Transmission Network Detail<br />
Distribution Network Detail<br />
Purchased<br />
22%<br />
78%<br />
Own <br />
P ro duc tio n<br />
G eo thermal<br />
Hydro<br />
12%<br />
2%<br />
22%<br />
Gas 28%<br />
Oil<br />
27%<br />
31%<br />
<strong>Coal</strong><br />
500 kV interconnected transmission<br />
system with 5,092 kilometers-circuits<br />
150 kV transmission system with<br />
26,733 kilometers-circuits<br />
4,916 kilometers-circuits of<br />
transmissions systems up to 70 kV<br />
Transformer capacity of 66,354 MVA<br />
Medium-voltage line distribution<br />
network of 278,277 kilometerscircuits<br />
Low-voltage 2% line distribution network<br />
of 407,508 kilometer-circuits<br />
300,149 units of distribution<br />
12%<br />
transformers with total capacity of<br />
26%<br />
approximately 36,430 MVA<br />
Total: 88,751 GWh<br />
Total: 28,308 MW<br />
Electricity Transmitted and Distributed by Customer Type<br />
Number of Customers by Type<br />
(in TWh)<br />
160<br />
140<br />
120<br />
100<br />
80<br />
60<br />
40<br />
20<br />
0<br />
112.6<br />
121.2<br />
147.3<br />
129.0<br />
134.6<br />
59.8<br />
43.8 47.3 50.2 54.9<br />
77.5<br />
51.0 31.3<br />
43.6<br />
45.8 48.0 46.2<br />
18.4<br />
27.3<br />
20.6 22.9 24.8 27.2<br />
9.3 14.1<br />
6.8 7.5 7.9 8.6 4.8<br />
2006 2007 2008 2009 2010 1H2011<br />
Public Business Industrial Residential<br />
(in millions)<br />
42.4<br />
44.0<br />
35.8<br />
37.3 38.6<br />
40.1<br />
33.1 34.7 35.8 37.1 39.3 40.8<br />
0.05 0.05 0.05 0.05 0.05 0.05<br />
1.7 1.6 1.7 1.9 1.9 2.0<br />
0.9 1.0<br />
1.0<br />
1.1<br />
1.2<br />
1.2<br />
2006 2007 2008 2009 2010 1H2011<br />
Public Business Industrial Residential<br />
6
Demand Forecasting 2011- 2020<br />
24 TWh<br />
55 TWh<br />
WR : 10,2%<br />
13 TWh<br />
31 TWh<br />
ER : 10,8%<br />
125 TWh<br />
241 TWh<br />
JB : 7,9%<br />
Electricity demand grows at around 9% per year<br />
2011 2020<br />
7
Extensive Generation Network as per June 2011<br />
PLN has an extensive generation portfolio with total installed capacity of approximately 33,251 MW across Indonesia.<br />
Sumatera<br />
Hydro<br />
Geothermal<br />
Steam-turbine<br />
Combined Cycle<br />
Gas-turbine<br />
Diesel<br />
IPP<br />
TOTAL<br />
867 MW<br />
0 MW<br />
1,175 MW<br />
858 MW<br />
874 MW<br />
953 MW<br />
601 MW<br />
5,328 MW<br />
Kalimantan<br />
Hydro<br />
Steamturbine<br />
Steamturbine<br />
Combined<br />
Cycle<br />
Gas-turbine<br />
Diesel<br />
Others<br />
IPP<br />
TOTAL<br />
32 MW<br />
201 MW<br />
60 MW<br />
113 MW<br />
969 MW<br />
39 MW<br />
45 MW<br />
1,459 MW<br />
Sulawesi<br />
Hydro<br />
Geothermal<br />
Gas-turbine<br />
Diesel<br />
IPP<br />
TOTAL<br />
220 MW<br />
60 MW<br />
55 MW<br />
123 MW<br />
567 MW<br />
300 MW<br />
1,325 MW<br />
Maluku<br />
Diesel<br />
TOTAL<br />
198 MW<br />
198 MW<br />
Total<br />
Hydro<br />
Geothermal<br />
Steamturbine<br />
Combined<br />
Cycle<br />
Gas-turbine<br />
Diesel<br />
Others<br />
IPP<br />
TOTAL<br />
3,523 MW<br />
439 MW<br />
10,111 MW<br />
7,704 MW<br />
3,224 MW<br />
3,268 MW<br />
39 MW<br />
4,943 MW<br />
33,251 MW<br />
Sumatera<br />
Kalimantan<br />
Sulawesi<br />
Maluku<br />
Papua<br />
Java-Bali<br />
Hydro<br />
Geo<br />
Steamturbine<br />
Combined<br />
Cycle<br />
Gas turbine<br />
Diesel<br />
IPP<br />
TOTAL<br />
2,399 MW<br />
375 MW<br />
8,680 MW<br />
6,786 MW<br />
2,114 MW<br />
120 MW<br />
3,997 MW<br />
24,471 MW<br />
Java-Bali<br />
NTB<br />
Diesel<br />
Hydro<br />
TOTAL<br />
NTB<br />
141 MW<br />
1 MW<br />
142 MW<br />
NTT<br />
NTT<br />
Diesel<br />
Geothermal<br />
Hydro<br />
TOTAL<br />
53 MW<br />
4 MW<br />
1 MW<br />
58 MW<br />
Papua<br />
Diesel<br />
Hydro<br />
TOTAL<br />
266 MW<br />
4 MW<br />
270 MW<br />
8
1<br />
Strong Government Support<br />
The Government of Indonesia’s active involvement emphasizes the importance of PLN’s role in ensuring stable<br />
electricity supply in Indonesia.<br />
Government<br />
Financial<br />
Assistance<br />
Close<br />
Involvement of<br />
Indonesian<br />
Government<br />
Timely<br />
& Adequate<br />
Subsidies<br />
Extended government loan maturities, converted overdue & penalties into equity in 1998<br />
Channels loans in which GoI is the primary obligor to lenders (2-step loan)<br />
Law No. 19/2003: Obligation to provide subsidy to PLN<br />
GoI injected equity to fund development plans: Rp3.9 trillion in 2009 and Rp2.3 trillion in 2010<br />
Irrevocable and unconditional guarantee on loans for FTP I<br />
Presidential Regulation No.8/2011: GoI raised the electricity tariff effective July 2010<br />
<br />
<br />
<br />
<br />
<br />
<br />
<br />
In 2010, GoI approved a Rp7.5 trillion loan to finance a portion of PLN’s capex for certain projects<br />
GoI is involved in almost every critical stage of PLN’s operations: budget setting, capital expenditure<br />
plans, IPP developments and primary energy supply<br />
Direct and close involvement of various ministries, such as the Ministry of State Owned Enterprises,<br />
Ministry of Energy and Mineral Resources, Ministry of Finance and Ministry of the Environment<br />
Government agencies (i.e. the Board of Finance & Development Control - BPKP, Corruption<br />
Eradication Commission (KPK) and Attorney General Office) assist in implementing Good Corporate<br />
Governance<br />
MoF Regulation No. 111/PMK.02/2007 and its amendments: Blanket Subsidy<br />
Continuous review ensuring adequate and timely subsidy payments<br />
8% margin for 2010 and 2011 approved<br />
Subsidy Calculation<br />
Costs covered by Subsidy<br />
§<br />
§<br />
§<br />
§<br />
§<br />
§<br />
§<br />
<strong>Power</strong> purchases<br />
Fuel and lubricants<br />
Maintenance<br />
Personnel<br />
Administration<br />
Depreciation<br />
Plus…<br />
Financing costs<br />
8% PSO Margin based on Unit<br />
Cost in each voltage level<br />
Minus…<br />
Electricity sales<br />
Equals...<br />
Electricity subsidy<br />
Total Government Subsidy to PLN (1)<br />
(Rp. in trillion)<br />
33.9<br />
37.5<br />
78.6<br />
53.7<br />
58.1<br />
40.9<br />
2006 2007 2008 2009 2010 1H2011<br />
Note: (1) Government’s electricity subsidy as a result of audit by state auditor, except for 1H2011 which is the subsidy accrued for the first half of 2011.<br />
9
3<br />
Growing Indonesia Electricity Market Benefits PLN<br />
Backed by strong macroeconomic indicators, energy demand in Indonesia is expected to grow significantly in the<br />
next few years.<br />
Growing Electricity Demand<br />
Relatively Low Per Capita Electricity Consumption<br />
(in TWh)<br />
350<br />
280<br />
210<br />
140<br />
70<br />
281<br />
234<br />
68<br />
194<br />
161<br />
55<br />
44<br />
36<br />
213<br />
179<br />
125 150<br />
2011 – 2019E CAGR: 9.6%<br />
334<br />
82<br />
253<br />
(in MWh per Capita)<br />
10.7<br />
9.7<br />
8.5<br />
8.0<br />
5.9<br />
3.7<br />
3.0<br />
2.2<br />
1.0 0.6 0.6 0.6 0.5<br />
0<br />
2011 2013 2015 2017 2019<br />
Java-Bali Outside Java-Bali<br />
Taiwan<br />
South Korea<br />
Singapore<br />
Japan<br />
Hong Kong<br />
Malaysia<br />
China<br />
Thailand<br />
Vietnam<br />
Indonesia<br />
Philippines<br />
India<br />
Pakistan<br />
<br />
<br />
With higher income levels, increasing urbanization and improving<br />
standard of living, electricity demand has increased<br />
Ongoing transformation from an agricultural to a manufacturingoriented<br />
economy has also played a particularly important role in the<br />
growth of demand for electricity<br />
Indonesia’s per capita consumption of electricity, electrification levels<br />
and the installed capacity levels are among the lowest in Asia<br />
Need for substantial increase in generating capacity is evident by<br />
increasing number of power outages in recent years<br />
As the major provider of electricity in Indonesia,<br />
PLN expects to benefit from Indonesia’s growth in demand for electricity.<br />
Source: PLN, EIU.<br />
10
PLN’s Highlights<br />
1<br />
Strong Government Support :Subsidy and Letter of Guarantee<br />
2<br />
Dominant Presence in the Indonesian Electricity Market<br />
3<br />
Benefit From a Fast-Growing Indonesian Electricity Market<br />
4<br />
Efficient Operations with Continuing Improvements<br />
5<br />
Stable Financial Profile<br />
11
2. <strong>Coal</strong> Overview
13<br />
INDONESIA COAL POTENCY
DISTRIBUTION OF INDONESIA COAL<br />
TOTAL RESOURCES<br />
105.187 Billion Ton<br />
TOTAL RESERVES<br />
21.131 Billion Ton<br />
Very High ( > 7100 kal/kg ) Medium ( 5100 - 6100 kal/kg )<br />
High ( 6100 - 7100 kal/kg ) Low ( < 5100 kal/kg )<br />
14<br />
Source: Geological Agency, 2010
51,92 B T<br />
52,44 B T<br />
0,002 B T<br />
0,15 B T<br />
0,23 B T<br />
TOTAL COAL RESOURCE <br />
105,187 BILLION TONS <br />
0,014 B T<br />
TOTAL COAL RESERVE <br />
21,131 BILLION TONS <br />
GEOLOGICAL AGENCY, 2009 <br />
15
REALIZATION OF COAL PRODUCTION, DOMESTIC, AND EXPORT<br />
( 2005 – 2011 )<br />
Realiza&on <br />
Production, 2011, 327<br />
Juta Ton <br />
million tones<br />
Production, 2005, 154<br />
Ekspor, 2006, 145<br />
Ekspor, 2005, 111<br />
Production, 2007, 217<br />
Ekspor, 2010, 208<br />
Production, 2006, 193<br />
Ekspor, 2008, 191 Ekspor, 2009, 198<br />
Ekspor, 2007, 163<br />
Production, 2010, 275<br />
Production, 2009, 256<br />
Ekspor, 2011, 248<br />
Production, 2008, 240<br />
Domestik, 2011, 79<br />
Domestik, 2005, 41 Domestik, 2006, 48 Domestik, 2007, 54 Domestik, 2010, 67<br />
Domestik, 2008, 49<br />
Domestik, 2009, 56<br />
Domes&k Domestic Ekspor Export Produc&on Production <br />
16<br />
16
17<br />
CURRENT CONDITION<br />
WORLD’S COAL RESERVE
18<br />
Indonesia is the Biggest <strong>Coal</strong> Exporter<br />
in the World
<strong>Coal</strong> Demand and Supply Forecasts<br />
DEMAND (Mt) 2010 2011 2012 2013 2014 2015 2016<br />
Japan 119.6 113.2 123.8 125.5 127.3 128.4 132.8<br />
South Korea 89.1 86.0 91.4 97.2 103.8 110.8 120.7<br />
Taiwan 53.2 62.4 62.4 62.4 62.4 62.4 61.9<br />
India 48.6 95.6 118.4 127.7 130.3 126.2 117.1<br />
EC 108.7 127.4 132.2 131.8 134.6 133.3 135.1<br />
Others 241.1 223.5 238.8 261.9 288.3 330.9 342.3<br />
Total 660.4 708.0 767.0 806.5 846.7 891.9 909.9<br />
SUPPLY (Mt) 2010 2011 2012 2013 2014 2015 2016<br />
Australia 140.9 152.9 177.5 186.6 200.5 215.6 219.8<br />
South Africa 70.0 73.0 74.0 77.0 80.0 82.3 82.0<br />
Russia 80.4 88.1 96.4 102.6 102.6 117.2 118.4<br />
Indonesia 215.5 242.0 265.0 300.0 320.0 323.6 341.9<br />
Columbia 62.0 64.0 69.1 69.1 69.1 75.2 79.2<br />
Vietnam 24.0 20.0 25.8 22.0 23.0 20.7 19.4<br />
Others 57.0 67.8 54.8 44.5 48.8 47.9 51.0<br />
Total 649.7 707.8 762.6 801.8 844.1 882.5 911.8<br />
IMPLIED MARKET BALANCE -‐10.7 -‐0.2 -‐4.4 -‐4.7 -‐2.7 -‐9.3 1.9<br />
Source : Wood Mackenzie, Tex Report, Platts, Citi Investment Research and Analysis, 8 January 2012<br />
19
Demand and Supply Forecast<br />
Total Demand Forecast<br />
Total,<br />
Others,<br />
1926.7,<br />
34%<br />
Total,<br />
Japan, Total,<br />
870.6, Taiwan,<br />
16% 427.1, 8%<br />
Total,<br />
Vietnam,<br />
154.9, 3% Total,<br />
Total,<br />
Columbia,<br />
487.8, 9%<br />
Total Supply Forecast<br />
Others,<br />
371.8, 7%<br />
Total,<br />
South<br />
Total,<br />
Africa,<br />
Australia,<br />
538.3,<br />
1293.8,<br />
9%<br />
23%<br />
Total, EC,<br />
902.9,<br />
16%<br />
Total,<br />
India,<br />
763.9,<br />
14%<br />
Total,<br />
South<br />
Korea,<br />
699.0,<br />
12%<br />
Total,<br />
Indonesia,<br />
2008.0,<br />
36%<br />
Total,<br />
Russia,<br />
705.7, 13%<br />
20
COAL PRICE POLICY<br />
Note: calculated in 6322 kkal/kg GAR<br />
21
3. Update 1000 MW - FTP Phase I
Rationale for Fast Track Program – Fuel Mix Improvement<br />
Fuel Cost Comparison<br />
Production by Fuel Source<br />
(Rp/kWh)<br />
2,400<br />
1,800<br />
2,359<br />
1,368<br />
1,610<br />
2,072<br />
(GWh)<br />
160<br />
120<br />
113.3<br />
120.6<br />
131.7<br />
1,200<br />
80<br />
68.9<br />
600<br />
659<br />
693<br />
560 602<br />
368 374<br />
268<br />
352<br />
249<br />
326 325 347<br />
40<br />
0<br />
2008 2009 2010 1H 2011<br />
Natural Gas <strong>Coal</strong> Geothermal Fuel oil<br />
0<br />
2008 2009 2010 1H 2011<br />
Fuel Oil Natural Gas <strong>Coal</strong> Geothermal Hydro<br />
Operating Expenses Breakdown<br />
Breakdown of Fuel and Lubricant Costs<br />
(Rp. in trillion)<br />
180<br />
120<br />
160.6<br />
135.3<br />
149.1<br />
90.6<br />
(Rp. in trillion)<br />
120<br />
80<br />
107.8<br />
76.2<br />
84.2<br />
58.0<br />
60<br />
40<br />
0<br />
2008 2009 2010 1H 2011<br />
0<br />
2008 2009 2010 1H 2011<br />
Fuel and lubricants Purchased electricity Maintenance<br />
Personnel Depreciation Others<br />
Fuel Oil Natural Gas <strong>Coal</strong> Geothermal Hydro<br />
The Fast Track Program is designed to reduce PLN’s reliance on fuel oil, which currently is<br />
PLN’s most expensive fuel cost of electricity on a per-kWh basis.<br />
23
Electrification Ratio Demonstrates Room for Growth<br />
Ample room for growth in electricity sector based on current Electrification Rate (1) in Indonesia.<br />
<br />
<br />
Low electrification ratio of 66.5% (as of end 2010) underscores undersupply<br />
PLN is mandated to implement Fast Track Programs for capacity expansion to meet Indonesia’s growing demand<br />
– Aim to achieve >90% electrification rate by end-2019<br />
– The role of IPPs in providing domestic power will also become increasingly important as the domestic electricity consumption<br />
increases<br />
Electrification Rate for Asian Developing Countries (2009)<br />
100.0% 99.7% 99.4% 99.4% 99.3% 97.6%<br />
89.7%<br />
2019 target:<br />
c. 90%<br />
76.6%<br />
67.0% 66.5% 66.3%<br />
62.4%<br />
Singapore Brunei China Malaysia Thailand Vietnam Philippines Sri Lanka Mongolia Indonesia India Pakistan<br />
24<br />
Source: IEA, World Energy <strong>Outlook</strong> 2010.<br />
(1) Percentage of population with electricity access.
COD Update of Fast Track Program Phase I 10.000 MW Java<br />
MW<br />
25
26<br />
COD Update of Fast Track Program Phase I 10.000 MW Outside Java
4. <strong>Coal</strong> Policy in PLN
COAL DIVISION IN PLN<br />
Vision :<br />
Guaranteeing the sustainable of coal supply to support operational power plant<br />
Mission :<br />
" To guarantee a security of coal supply<br />
" To manage coal contract<br />
" To plan demand and supply of coal, yearly and long term<br />
" To coordinate coal suppliers and power plant need in monthly and yearly<br />
meeting<br />
" To implement clean coal technologies.<br />
Measures :<br />
" Quantity fulfills security of the stockpile<br />
" Quality match to boiler specification and environntmental regulations.<br />
" Timing, not delay and not too early<br />
28
Estimated <strong>Coal</strong> Consumption for Electricity (PLN)<br />
Realization<br />
Estimation<br />
In Million Ton<br />
29
Rp/kg<br />
Average <strong>Coal</strong> Price bought by PLN<br />
Series1, 2009, 732.32<br />
Series1, 2010, 659.71<br />
* Up to Desember 2011<br />
Series1, 2011, 695<br />
Series1, 2008, 489.23<br />
Series1, 2006, Series1, 335.81 2007, 338.76<br />
Series1, 2005, 251.55<br />
Series1, 2003, Series1, 230.82 2004, 230.75<br />
Series1, 2002, 219.75<br />
30
TARGET & REALIZATION DMO<br />
(Domestic Market Obligation)<br />
Million Ton<br />
Year Target RealizaIon <br />
2010 54.2 23.8 <br />
2011 64.79 31.9* <br />
Due to Completion Project Delay of PLN and IPP<br />
*up to December 2011<br />
31
COAL SUPPLIERS to PLN 2011<br />
Total <strong>Coal</strong> Contracted 69,56 Million Ton,<br />
69.3% from Suppliers in DMO 2011 List and 30.7% from suplliers not in DMO 2011 List.<br />
No<br />
Suppliers in DMO 2011 List<br />
Suppliers<br />
DMO<br />
Contract <br />
Volume<br />
kilo T /year<br />
1 Adaro 10,053 8,298<br />
2 Arutmin 6,344 7,288<br />
3 Berau <strong>Coal</strong> 3,996 4,065<br />
4 PTBA 2,614 9,780<br />
5 Indominco 2,771 1,908<br />
6 Jorong 408 300<br />
7 Kideco 6,434 8,355<br />
8 KPC 11,178 7,640<br />
9 Lanna Harita 342 215<br />
Total 44,139 47,849<br />
Supplier not in DMO 2011 List<br />
No <strong>Coal</strong> Suppliers<br />
Contract<br />
Volume<br />
Kilo T / year<br />
1 Anzawara 84<br />
2 Batara Batari 1,121<br />
3 Cenko 1,208<br />
4 DGL 2,007<br />
5 GGB 576<br />
6 Hanson 3,078<br />
7 KUB & DBS 239<br />
8 Oktasan 1,359<br />
9 PLN BB 3,094<br />
10 PT BMP 1,758<br />
11 PT KII 1,470<br />
12 Rizki 975<br />
13 Spot 300<br />
14 TBI 240<br />
15 Titan 2,383<br />
16 WK Intrade 416<br />
17 Kontrak Unit 900<br />
TOTAL 21,207<br />
32
PLN’s <strong>Coal</strong> Supply Policy<br />
1<br />
To strengthen security of coal supply by :<br />
ü Long term supply contract<br />
ü Implementing online monitoring coal supply<br />
2<br />
To replace oil fuel by coal in fuel mix<br />
3<br />
Improvement in contract related to payment clause :<br />
faster and transparent settlements<br />
4<br />
To increase coal quality using appropriate coal<br />
upgrading technologies to meet boiler’s<br />
specifications and environmental regulations.<br />
33
Security of coal Supply : Long term contract<br />
In Million Ton<br />
2011 2012 2013 2014 2015<br />
HRC (5700 -‐ 6000 kCal/kg GAR ) :<br />
Demand 9.09 9.09 9.09 9.09 9.09<br />
Contracted 10.49 10.49 10.49 10.49 10.49<br />
Balance 1.40 1.40 1.40 1.40 1.40<br />
MRC (4900 -‐ 5200 kCal/kg GAR) :<br />
Demand 27.96 29.67 31.87 32.03 32.03<br />
Contracted 28.27 32.50 34.26 34.76 34.76<br />
Balance 0.31 2.83 2.39 2.73 2.73<br />
LRC (3800 -‐ 4500 kCal/kg GAR) :<br />
Demand 13.6 24.09 31.88 39.42 47.58<br />
Contracted 23.97 28.26 33.11 35.00 35.00<br />
Balance 10.37 4.17 1.23 -‐4.42 -‐12.58<br />
34
Fuel Mix 2005-2019 : <strong>Coal</strong> share to be increased<br />
LNG, 2005, LNG, 0 2006,<br />
LNG,<br />
0<br />
2007,<br />
LNG,<br />
0<br />
2008,<br />
LNG,<br />
0<br />
2009,<br />
LNG,<br />
0<br />
2010, LNG, 0 2011, 0<br />
PLTP, 2005, PLTP, 5% 2006,<br />
PLTP,<br />
5%<br />
2007,<br />
PLTP,<br />
5%<br />
2008, PLTP, 5% 2009, 6%<br />
LNG, 2012, LNG, 3% 2013, LNG, 2% 2014, LNG, 2% 2015, LNG, 2% 2016, LNG, 2% 2017,<br />
PLTP, 2010, PLTP, 6% 2011, 6%<br />
LNG, 3% 2018, LNG, LNG 4% 2019, 4%<br />
PLTP, 2012, PLTP, 6% 2013, 9%<br />
Hydro, 2005, Hydro, 8% 2006, Hydro, 7% 2007, Hydro, 8% 2008, Hydro, 7% 2009, Hydro, 7% 2010, Hydro, 6% 2011, 6%<br />
PLTP, 2014, PLTP, 12% 2015, PLTP, 13% 2016,<br />
PLTP,<br />
13%<br />
Hydropower<br />
2017, 13%<br />
Hydro, 2012, 5%<br />
PLTP, 2018, PLTP, 13% 2019, 13%<br />
Hydro, 2013, 5%<br />
Geothermal<br />
Hydro, 2014, Hydro, 5% 2015, Hydro, 4% 2016,<br />
Hydro,<br />
4%<br />
2017, 4%<br />
Gas, 2005,<br />
Gas,<br />
15%<br />
2006, Gas, 15% 2007, Gas, 16%<br />
Hydro, 2018, Hydro, 4% 2019, 4%<br />
2008, 17%<br />
Gas, 2010, 25%<br />
Gas, 2009, 22%<br />
21%<br />
Natural Gas<br />
Gas, 2012, 28%<br />
Gas, 2013, 29%<br />
Gas, 2014,<br />
Gas,<br />
26%<br />
2015,<br />
Gas,<br />
24%<br />
2016, Gas, 22% 2017, 19%<br />
Gas, 2018, Gas, 20% 2019, 19%<br />
Batubara,<br />
Batubara,<br />
2005, 41%<br />
2006,<br />
Batubara,<br />
45%<br />
2007, Batubara, 45% 2008, 43%<br />
Oil<br />
<strong>Coal</strong><br />
Batubara, 2009, 43%<br />
Batubara, 2010, 47%<br />
Batubara, 2011, 54%<br />
Batubara, 2012, 51%<br />
Batubara, 2013, Batubara, 52% 2014,<br />
Batubara,<br />
52%<br />
2015,<br />
Batubara,<br />
54%<br />
2016,<br />
Batubara,<br />
56%<br />
2017, 58%<br />
Batubara, Batubara, 2018, 57% 2019, 58%<br />
BBM, 2005, 31%<br />
BBM, 2006, BBM, 28% 2007, BBM, 27% 2008, 28%<br />
BBM, 2009, 23%<br />
BBM, 2010, 16%<br />
1% BBM, 2012, 7%<br />
BBM, 2013, BBM, 3% 2014, BBM, 3% 2015, BBM, 3% 2016, BBM, 3% 2017, BBM, 3% 2018, BBM, 2% 2019, 2%<br />
35<br />
35
INDONESIA FUEL MIX 2010-2019<br />
400.000<br />
Historical <br />
Projec&on <br />
350.000<br />
300.000<br />
250.000<br />
LNG <br />
Gas <br />
GWh<br />
200.000<br />
150.000<br />
<strong>Coal</strong> <br />
100.000<br />
HSD <br />
MFO <br />
50.000<br />
-<br />
Geothermal <br />
2005 2006 2007 2008 2009 2010 2011 2012 2013 2014 2015 2016 2017 2018 2019<br />
Hydro <br />
36
<strong>Coal</strong> <strong>Power</strong> <strong>Plant</strong> Capacity, Its <strong>Coal</strong> Demand and <strong>Coal</strong><br />
Contracted Volume<br />
Comparison Between Total Capacity Generated, <strong>Coal</strong> Demand and Contract Volume <br />
COAL DEMAND ( MILLION TON ) <br />
CAPACITY (GW) <br />
2011 2012 2013 2014 2015 <br />
<strong>Coal</strong> Demand (million ton) 32 40 83 95 105 <br />
Contract Volume (million ton) 77 85 88 88 88 <br />
Capacity (GW) <strong>Coal</strong> Demand (million 15 ton) Contract YEAR <br />
21 Volume (million 25 ton) Capacity 28 (GW) 31 <br />
37
5. Business Opportunities
Clean <strong>Coal</strong> Technologies Technologies<br />
1. <strong>Coal</strong> Dryer Technology:<br />
PLN Batubara is now constructing one coal dryer facility to be<br />
installed at PLTU Labuan site. The facility is expected to<br />
be able to increase coal quality up to 1000 kcal/Kg. PLN still needs<br />
more <strong>Coal</strong> Dryers.<br />
Also, in Rembang PP, STD (Steam Tuibe Dryer) is studied by TSK<br />
(Tsukishima Techno Machinery co. Ltd).<br />
2. <strong>Coal</strong> blending Facilities:<br />
PLN is now under cooperation with a company to study the<br />
cost/benefit and prepare a plan of having the facility with<br />
production capacity of 10 million ton per year<br />
3. Gasification <strong>Coal</strong> <strong>Power</strong> <strong>Plant</strong>:<br />
It will be operated in east Kalimantan, hopefully next month.<br />
39
Clean <strong>Coal</strong> Technologies Technologies<br />
3. Slurry (Liquid <strong>Coal</strong>):<br />
It will be lauched at Sinarmas Group <strong>Power</strong> <strong>Plant</strong> (Private Companay),<br />
Karawang - Jakarta, 22 March 2012. PLN has nominated to use the slurry<br />
at 5 <strong>Power</strong> <strong>Plant</strong>s i.e.: Belawan PP, Tanjung Priok PP, Tanjung Perak PP,<br />
Tambak Lorok PP, Tello PP. But, the slurry still need to be proven as for<br />
commercial technology.<br />
4. SynGas :<br />
SynGas products 2 commodities i.e.: Hot steam for oil lifting of PT<br />
PERTAMINA (State Oil co.) and Gas for PGN (State Gas co.) which<br />
directly passthrough to PLN.<br />
5. Human Resource Traing and realated business.<br />
40
q Growth rate of demand for electricity is still high<br />
(9.5% p.a up to 2029).<br />
q Electrification ratio is still low (67.2% in 2010).<br />
q Lack of electricity supply in some areas/regions.<br />
GW<br />
180 <br />
160 <br />
140 <br />
120 <br />
100 <br />
80 <br />
60 <br />
40 <br />
20 <br />
0 <br />
q PLN’s investment capability is limited (around 20%)<br />
q<br />
NECESSITY FOR PRIVATE POWER PARTICIPATION <br />
Additional <strong>Power</strong> Generation<br />
(based on draft RUKN 2010-2029)<br />
NEED A HUGE OF ADDITIONAL CAPACITY (estimated of 7,800 MW<br />
p.a during 20 years), investment required approx. USD 11.4 billion p.a)<br />
BUT<br />
The Government budget for infrastructure is very limited.<br />
THEREFORE<br />
TWh<br />
800 <br />
700 <br />
600 <br />
500 <br />
400 <br />
300 <br />
200 <br />
100 <br />
q Privates sector participation are required:<br />
• Engineering, Procurement and Construction (EPC)<br />
• Independent <strong>Power</strong> Producer (IPP) Project<br />
• Public Private Partnership (PPP) Project<br />
0 <br />
Jamali<br />
Outside Jamali<br />
INDONESIA<br />
Electricity Demand<br />
(based on draft RUKN 2010-2029)<br />
Infrastructure JAMALI Outside JAMALI Total<br />
Generation 121,217 79,607 200,824<br />
Transmission Line and<br />
Substation<br />
Investment Requirement<br />
(based on draft RUKN 2010-2029)<br />
Million USD<br />
9,180 5,844 15,024<br />
Distribution Line 6,546 4,728 11,275<br />
Total 136,944 90,179 227,122<br />
41<br />
Note: RUKN : National Electricity General Plan<br />
FTP-1 : Fast Track Program 10,000 MW Phase I<br />
FTP-2 : Fast Track Program 10,000 MW Phase II
CONCLUSION <br />
q<br />
q<br />
q<br />
q<br />
q<br />
q<br />
Indonesia electricity demand is still high thus need a huge additional capacity of<br />
generation, transmission and distribution.<br />
The government encourages participation of private sector to cooperate with<br />
PLN through EPC project, IPP project and PPP (Public Private Partnership)<br />
project.<br />
The government is committed to maintain the PLN’s financial viability in order<br />
to meet its obligations to other parties, by providing subsidy.<br />
For the next 10 years, the electricity supply in Indonesia is still relying on CFPP<br />
(<strong>Coal</strong> <strong>Power</strong> <strong>Plant</strong>), it is because the availability of coal abundant as primary<br />
energy and cost of production is relatively cheap compare others power<br />
generation, but still taking into account of environmental sounds.<br />
PLN is the biggest coal buyer in Indonesia i.e.: 57 million Ton in 2012, and<br />
>100 million Ton/year after 2015.<br />
PLN needs Clean <strong>Coal</strong> Technologies and Fund from offshore.<br />
42
FEEDBACK to METI <br />
q<br />
q<br />
q<br />
All Japanese companies and their Fund companies should play significant role<br />
in approach to Indonesian Government, especially in electricity sectors for<br />
EPC, IPP, or PPP projects.<br />
Chinese’s Electricity Equipment product is more likely cheaper than Japanese’s<br />
products, but the quality has likely not yet proven. The fact, we suffer from<br />
project completion delay.<br />
PLN needs best quality, best price and long lifetime Electricity<br />
Equipment.<br />
43
Further contact :<br />
helminajamuddin@pln.co.id<br />
Phone: +628121220450<br />
44