

Bonds - Wiser Wealth Management, Inc
Bonds - Wiser Wealth Management, Inc
Bonds - Wiser Wealth Management, Inc

You also want an ePaper? Increase the reach of your titles
YUMPU automatically turns print PDFs into web optimized ePapers that Google loves.
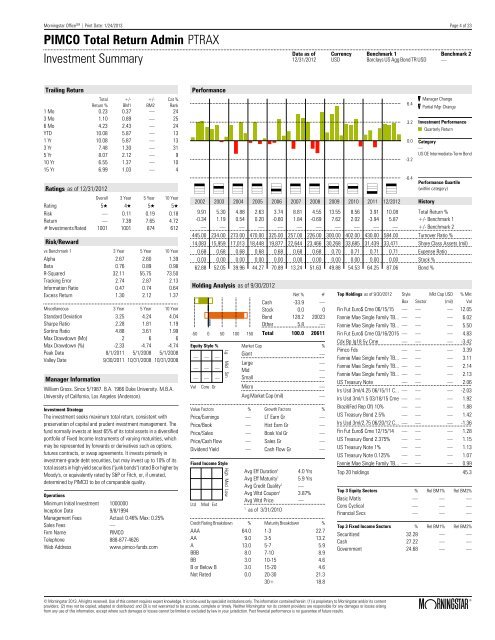
Morningstar Office SM | Print Date: 1/24/2013 Page 4 of 23<br />
PIMCO Total Return Admin PTRAX<br />
Investment Summary<br />
Data as of Currency Benchmark 1 Benchmark 2<br />
12/31/2012 USD Barclays US Agg Bond TR USD —<br />
Trailing Return<br />
Total<br />
Return %<br />
+/-<br />
BM1<br />
+/-<br />
BM2<br />
Cat %<br />
Rank<br />
1 Mo 0.23 0.37 — 24<br />
3 Mo 1.10 0.89 — 25<br />
6 Mo 4.23 2.43 — 24<br />
YTD 10.08 5.87 — 13<br />
1 Yr 10.08 5.87 — 13<br />
3 Yr 7.48 1.30 — 31<br />
5 Yr 8.07 2.12 — 9<br />
10 Yr 6.55 1.37 — 10<br />
15 Yr 6.99 1.03 — 4<br />
Ratings as of 12/31/2012<br />
Overall 3 Year 5 Year 10 Year<br />
Rating 5Q 4Q 5Q 5Q<br />
Risk — 0.11 0.19 0.18<br />
Return — 7.38 7.65 4.72<br />
# Investments Rated 1001 1001 874 612<br />
Risk/Reward<br />
vs Benchmark 1 3 Year 5 Year 10 Year<br />
Alpha 2.67 2.60 1.39<br />
Beta 0.76 0.89 0.98<br />
R-Squared 32.11 55.75 73.50<br />
Tracking Error 2.74 2.87 2.13<br />
Information Ratio 0.47 0.74 0.64<br />
Excess Return 1.30 2.12 1.37<br />
Miscellaneous 3 Year 5 Year 10 Year<br />
Standard Deviation 3.25 4.24 4.04<br />
Sharpe Ratio 2.28 1.81 1.19<br />
Sortino Ratio 4.88 3.61 1.99<br />
Max Drawdown (Mo) 2 6 6<br />
Max Drawdown (%) -2.33 -4.74 -4.74<br />
Peak Date 8/1/2011 5/1/2008 5/1/2008<br />
Valley Date 9/30/2011 10/31/2008 10/31/2008<br />
Manager Information<br />
William Gross. Since 5/1987. B.A. 1966 Duke University. M.B.A.<br />
University of California, Los Angeles (Anderson).<br />
Investment Strategy<br />
The investment seeks maximum total return, consistent with<br />
preservation of capital and prudent investment management. The<br />
fund normally invests at least 65% of its total assets in a diversified<br />
portfolio of Fixed <strong>Inc</strong>ome Instruments of varying maturities, which<br />
may be represented by forwards or derivatives such as options,<br />
futures contracts, or swap agreements. It invests primarily in<br />
investment-grade debt securities, but may invest up to 10% of its<br />
total assets in high yield securities ("junk bonds") rated B or higher by<br />
Moody's, or equivalently rated by S&P or Fitch, or, if unrated,<br />
determined by PIMCO to be of comparable quality.<br />
Operations<br />
Minimum Initial Investment 1000000<br />
<strong>Inc</strong>eption Date 9/8/1994<br />
<strong>Management</strong> Fees Actual: 0.46% Max: 0.25%<br />
Sales Fees —<br />
Firm Name<br />
PIMCO<br />
Telephone 888-877-4626<br />
Web Address<br />
www.pimco-funds.com<br />
Performance<br />
& * & & ( & & * * ) &<br />
2002 2003 2004 2005 2006 2007 2008 2009 2010 2011 12/2012 History<br />
9.91 5.30 4.88 2.63 3.74 8.81 4.55 13.55 8.56 3.91 10.08 Total Return %<br />
-0.34 1.19 0.54 0.20 -0.60 1.84 -0.69 7.62 2.02 -3.94 5.87 +/- Benchmark 1<br />
— — — — — — — — — — — +/- Benchmark 2<br />
445.00 234.00 273.00 470.00 325.00 257.00 226.00 300.00 402.00 430.00 584.00 Turnover Ratio %<br />
14,083 15,959 17,013 18,448 19,877 22,644 23,466 30,268 33,685 31,439 33,471 Share Class Assets (mil)<br />
0.68 0.68 0.68 0.68 0.68 0.68 0.68 0.70 0.71 0.71 0.71 Expense Ratio<br />
0.03 0.00 0.00 0.00 0.00 0.00 0.00 0.00 0.00 0.00 0.00 Stock %<br />
62.88 52.05 39.96 44.27 70.89 13.24 51.63 49.88 54.53 64.25 87.06 Bond %<br />
Holding Analysis as of 9/30/2012<br />
-50 0 50 100 150<br />
Net % #<br />
Cash -33.9 —<br />
Stock 0.0 0<br />
Bond 128.2 20023<br />
Other 5.8 —<br />
Total 100.0 20611<br />
Equity Style % Market Cap %<br />
— — —<br />
Giant —<br />
Large —<br />
— — —<br />
Mid —<br />
— — — Small —<br />
Val<br />
Core Gr<br />
Lg Mid Sm<br />
Micro —<br />
Avg Market Cap (mil) —<br />
Value Factors % Growth Factors %<br />
Price/Earnings — LT Earn Gr —<br />
Price/Book — Hist Earn Gr —<br />
Price/Sales — Book Val Gr —<br />
Price/Cash Flow — Sales Gr —<br />
Dividend Yield — Cash Flow Gr —<br />
Fixed <strong>Inc</strong>ome Style<br />
Ltd<br />
Mod Ext<br />
High Med Low<br />
Avg Eff Duration 1 4.0 Yrs<br />
Avg Eff Maturity 1 5.9 Yrs<br />
Avg Credit Quality 1 —<br />
Avg Wtd Coupon 1 3.87%<br />
Avg Wtd Price —<br />
1<br />
as of 3/31/2010<br />
Credit Rating Breakdown % Maturity Breakdown %<br />
AAA 64.0 1-3 22.7<br />
AA 9.0 3-5 13.2<br />
A 13.0 5-7 5.9<br />
BBB 8.0 7-10 8.9<br />
BB 3.0 10-15 4.6<br />
B or Below B 3.0 15-20 4.6<br />
Not Rated 0.0 20-30 21.3<br />
30+ 18.8<br />
Top Holdings as of 9/30/2012<br />
6.4<br />
3.2<br />
0.0<br />
-3.2<br />
-6.4<br />
Style<br />
Manager Change<br />
Partial Mgr Change<br />
Investment Performance<br />
Quarterly Return<br />
Category<br />
—<br />
US OE Intermediate-Term Bond<br />
Performance Quartile<br />
(within category)<br />
Mkt Cap USD<br />
% Mkt<br />
Box Sector (mil) Val<br />
Fin Fut Euro$ Cme 06/15/15 — — — 12.05<br />
Fannie Mae Single Family TB... — — — 6.02<br />
Fannie Mae Single Family TB... — — — 5.50<br />
Fin Fut Euro$ Cme 03/16/2015 — — — 4.83<br />
Cdx Bp Ig18 5y Cme — — — -3.42<br />
Pimco Fds — — — 3.39<br />
Fannie Mae Single Family TB... — — — 3.11<br />
Fannie Mae Single Family TB... — — — 2.14<br />
Fannie Mae Single Family TB... — — — 2.13<br />
US Treasury Note — — — 2.06<br />
Irs Usd 3ml/4.25 06/15/11 C... — — — -2.03<br />
Irs Usd 3ml/1.5 03/18/15 Cme — — — 1.92<br />
Brazil(Fed Rep Of) 10% — — — 1.88<br />
US Treasury Bond 2.5% — — — 1.42<br />
Irs Usd 3ml/2.75 06/20/12 C... — — — -1.36<br />
Fin Fut Euro$ Cme 12/15/14 — — — 1.28<br />
US Treasury Bond 2.375% — — — 1.15<br />
US Treasury Note 1% — — — 1.13<br />
US Treasury Note 0.125% — — — 1.07<br />
Fannie Mae Single Family TB... — — — 0.99<br />
Top 20 holdings 45.3<br />
Top 3 Equity Sectors % Rel BM1% Rel BM2%<br />
Basic Matls — — —<br />
Cons Cyclical — — —<br />
Financial Svcs — — —<br />
Top 3 Fixed <strong>Inc</strong>ome Sectors % Rel BM1% Rel BM2%<br />
Securitized 32.28 — —<br />
Cash 27.22 — —<br />
Government 24.68 — —<br />
© Morningstar 2013. All rights reserved. Use of this content requires expert knowledge. It is to be used by specialist institutions only. The information contained herein: (1) is proprietary to Morningstar and/or its content<br />
providers; (2) may not be copied, adapted or distributed; and (3) is not warranted to be accurate, complete or timely. Neither Morningstar nor its content providers are responsible for any damages or losses arising ß ®<br />
from any use of this information, except where such damages or losses cannot be limited or excluded by law in your jurisdiction. Past financial performance is no guarantee of future results.
JPMCB Stable Asset <strong>Inc</strong>ome Fund*<br />
Class F<br />
September 30, 2012<br />
OVERALL RISK LEVEL:<br />
Conservative Moderate Aggressive<br />
1 2 3 4 5<br />
KEY FUND STATISTICS<br />
Fund Size:<br />
$1,677.36 million<br />
<strong>Inc</strong>eption Date: October 31, 1986<br />
Blended Yield (Gross of fees): 1.94%<br />
Average Portfolio Quality: AA+<br />
Duration:<br />
2.73 yrs<br />
Market-to-Book-Value-Ratio¹: 101.99%<br />
FUND COMPOSITION:<br />
The JPMCB Stable Asset <strong>Inc</strong>ome Fund seeks to provide<br />
capital preservation, liquidity, and current income at levels<br />
that are typically higher than those provided by money<br />
market funds.<br />
Investment Strategy<br />
The JPMCB Stable Asset <strong>Inc</strong>ome Fund (“SAIF”) is primarily comprised of<br />
investment contracts called benefit responsive wraps ("wrap contracts") that are<br />
issued by banks and insurance companies. The wrap contracts help to stabilize<br />
the value and returns of the fund. These contracts are backed by fixed income<br />
portfolios that primarily consist of U.S. Treasury, Agency, Investment Grade<br />
Corporates, Mortgage-Backed and Asset-Backed Securities.<br />
WRAPPED PORTFOLIO ALLOCATIONS<br />
SECTOR ALLOCATION<br />
% OF MARKET VALUE<br />
CONTRACT DIVERSIFICATION<br />
Liquidity<br />
5%<br />
Prudential<br />
18%<br />
MetLife<br />
17%<br />
ING<br />
20%<br />
AIG<br />
20%<br />
AEGON<br />
20%<br />
PORTFOLIOS ALLOCATION<br />
Liquidity<br />
Prudential 5%<br />
Fixed<br />
<strong>Inc</strong>ome<br />
18%<br />
JPMorgan<br />
77%<br />
CMBS<br />
5.9%<br />
Private Mortgages 3.5%<br />
Agency MBS<br />
34.0%<br />
ABS 0.6%<br />
Investment Grade Credit<br />
22.4%<br />
Agency Debt 3.2%<br />
Treasury/Cash<br />
30.3%<br />
0% 5% 10% 15% 20% 25% 30% 35% 40%<br />
Synthetic Wrap ³<br />
Separate Account Wrap ³<br />
JPMorgan Liquidity<br />
Wrap Fees 4 :<br />
JPMorgan Managed <strong>Bonds</strong><br />
Sub-Advised <strong>Bonds</strong><br />
JPMorgan Liquidity<br />
20.3 bps<br />
FUND EXPENSES**:<br />
Per<br />
Exp. Ratio $1,000<br />
<strong>Management</strong> Fees 0.30% $3.00<br />
Service Fees 0.00% $0.00<br />
Other Expenses 0.01% $0.10<br />
Current Expense Ratio 0.31% $3.10<br />
AA<br />
QUALITY ALLOCATION<br />
% OF MARKET VALUE<br />
BBB<br />
A<br />
BB<br />
JPMCB Stable Asset <strong>Inc</strong>ome Fund*<br />
Class F<br />
September 30, 2012<br />
INVESTMENT PERFORMANCE (%)<br />
Trailing<br />
4%<br />
4%<br />
3%<br />
3%<br />
2%<br />
2%<br />
1%<br />
1%<br />
0%<br />
Stable Asset <strong>Inc</strong>ome Fund (Net of Fees)<br />
Citigroup 3-Month T-Bill Index<br />
Quarter 1 Year 3 Years 5 Years 10 Years<br />
Stable Asset <strong>Inc</strong>ome Fund (Net of Fees) 0.38% 1.67% 1.94% 2.69% 3.57%<br />
Citigroup 3-Month T-Bill Index 0.02% 0.05% 0.09% 0.64% 1.73%<br />
Excess Return 0.36% 1.62% 1.84% 2.05% 1.84%<br />
Past performance is not indicative of comparable future returns. Total return assumes the reinvestment of income.<br />
<strong>Inc</strong>eption date of the Class F is 8/1/2006. Prior return data is calculated using the Investment Class return, less the Class F fee of 30 bps. Performance for<br />
time periods greater than one year are annualized<br />
CALENDAR YEAR PERFORMANCE (%)<br />
Annual<br />
6%<br />
5%<br />
4%<br />
3%<br />
2%<br />
1%<br />
0%<br />
Stable Asset <strong>Inc</strong>ome Fund (Net of Fees)<br />
Citigroup 3-Month T-Bill Index<br />
2011 2010 2009 2008 2007 2006 2005 2004<br />
Stable Asset <strong>Inc</strong>ome Fund (Net of Fees) 2.00% 2.12% 2.08% 4.77% 5.12% 5.00% 4.70% 3.60%<br />
Citigroup 3-Month T-Bill Index 0.08% 0.13% 0.16% 1.80% 4.74% 4.76% 3.00% 1.24%<br />
Excess Return 1.93% 1.98% 1.92% 2.98% 0.38% 0.24% 1.70% 2.36%<br />
Past performance is not indicative of comparable future returns. Total return assumes the reinvestment of income.<br />
*The Commingled Pension Trust Fund (Stable Asset <strong>Inc</strong>ome) of JPMorgan Chase Bank N.A. is a collective trust fund established and maintained by JPMorgan Chase Bank, N.A. under a<br />
declaration of trust. The fund is not required to file a prospectus or registration statement with the SEC, and accordingly, neither is available. The fund is available only to certain qualified<br />
retirement plans and governmental plans and is not offered to the general public. Units of the fund are not bank deposits and are not insured or guaranteed by any bank, government entity,<br />
the FDIC or any other type of deposit insurance. You should carefully consider the investment objectives, risk, charges, and expenses of the fund before investing.<br />
This information is for educational purposes only and is not intended as investment advice or investment recommendation; you are ultimately responsible for your own investment decisions.<br />
Risks associated with the JPMCB Stable Asset <strong>Inc</strong>ome Fund include the following:<br />
Credit risk: The risk that the wrap contracts will not absorb losses in the event of certain credit downgrades of default by issuers of underlying securities. Interest-rate risk: The risk that<br />
increases in interest rates may decrease the value of debt securities held by the fund. This risk is mitigated by the wrap contracts. There is also the risk that when interest rates are re-set,<br />
typically on a quarterly basis, the new rate will be less than the prevailing market rate, in order to amortize past losses occasioned by book value payments to withdrawing participants.<br />
Inflation Risk: The risk that the guaranteed rate of return won't keep up with inflation. Wrap Risk: Participants will be subject to general market value risk associated with any bond fund, and<br />
thus may lose money if the fund cannot enter into wrap contracts that will cover all its assets, the risk that the wrap provider cannot meet its obligations, or the risk that the wrap contract will<br />
not cover certain employer -initiated or corporate events that result in mass withdrawals from the fund (such as early retirement programs, layoffs, divestitures, bankruptcy, etc.). Plan<br />
Termination Risk: Plans terminating from SAIF are paid at either book or market value, whichever is lower. This has no impact on participant-elected withdrawals, which always are made at<br />
book value.<br />
Past performance is not a guarantee of and may not be indicative of future results. Investment returns and principal value of an investment will fluctuate so that the value of an investor’s<br />
units when redeemed may be worth more or less than original cost or the performance quoted. Current performance may be higher or lower than the performance data shown.<br />
J.P. Morgan Asset <strong>Management</strong> is the marketing name for the asset management businesses of JPMorgan Chase & Co. Those businesses include, but are not limited to, JPMorgan Chase<br />
Bank, N.A., J.P. Morgan Investment <strong>Management</strong> <strong>Inc</strong>., Security Capital Research & <strong>Management</strong> <strong>Inc</strong>orporated and J.P. Morgan Alternative Asset <strong>Management</strong> <strong>Inc</strong>.<br />
270 Park Avenue, New York, NY 10017<br />
© 2012 JPMorgan Chase & Co.


