Lakes and Watercourses
Lakes and Watercourses Lakes and Watercourses
Internationally, the most widely accepted framework for environmental indicators is based on PSR-chains (Pressure-State-Response). Indicators are chosen which reflect the relationship between environmental effects, and/or there causes and measures taken. There is also a more sophisticated version, called DPSIR (Driving forces-Pressure-State-Impact-Response). Variants of the PSR/DPSIR systems are used by, among others, the OECD, the Nordic Council of Ministers, the United Nations, the World Bank, the European Union's Environmental Agency. ASSESSMENT PROCEDURE Measurements/data Assessment of current conditions — indicates environmental effects associated with current conditions Assessments of deviation from reference values — indicates environmental impact of human activity Assessment of current conditions Wherever possible, the scale used in assessments of current conditions is correlated with effects on different parts of the ecosystems and their biodiversity, or on human health (”effect-related classification”). In some cases, the assessment is based only on a statistical distribution of national data (”statistical classification”). The scale is usually divided into five classes. Where the assessment is based on effects, Class 1 indicates conditions at which there are no known negative effects on the environment and/or human health. The remaining classes indicate effects of increasing magnitude. Class 5 includes conditions leading to the most serious negative effects on the environment and/or human health. Due to wide natural variations, especially with regard to biological phenomena, the indicated effects are not always the result of human activities, in which case they can not be labelled as “negative”(see below). Where the assessment is based only on a statistical distribution, there is no well-defined relationship between effects and class limits. It should be noted that parameters that are evaluated on the basis of different criteria cannot be compared with each other. Reference values Ideally, the reference value for a given parameter represents a natural state that has not been affected by any human activity. In practice, however, reference values are usually based on observations made in areas that have experienced some slight human impact. In some cases, historical data or model- 11
ased estimates are used. Given that there are wide natural variations of several of the parameters, reference values in many cases vary by region or type of ecoystem. Deviations from reference values The extent of human impact can be estimated by calculating deviations from reference values, which are usually stated as the quotient between a measured value and the corresponding reference value: Measured value Deviation = ------------------------------------- Reference value The extent of deviation is usually classified on a five-level scale. Class 1 includes conditions with little or no deviation from the reference value, which means that effects of human activity are negligible. The remaining classes indicate increasing levels of deviation (increasing degree of impact). Class 5 usually indicates very significant impact from local sources. Organic pollutants and metals in heavily polluted areas are dealt with in greater detail in a separate report, Contaminated Sites, which includes a further sub-division of Class 5, as follows: Contaminated Sites Impact from point sources: None/ Moderate Substantial Very slight great Class 1 Class 2 Class 3 Class 4 Class 5 Other reports 12
- Page 1 and 2: Environmental Quality Criteria - La
- Page 3 and 4: TO ORDER Swedish Environmental Prot
- Page 5 and 6: Reference Group Mats Bengtsson, Swe
- Page 7 and 8: Summary This report on lakes and wa
- Page 11: included. In addition to a large nu
- Page 15 and 16: TABLE 1. SUMMARY of parameters incl
- Page 17 and 18: 16 The current conditions scale in
- Page 19 and 20: (in Swedish with English summary).
- Page 21 and 22: conditions for watercourse flora an
- Page 23 and 24: show the availability of nitrogen i
- Page 25 and 26: Mean concentration of total phospho
- Page 27 and 28: TABLE 9. DEVIATION from reference v
- Page 29 and 30: Comments Classifications must be ba
- Page 31 and 32: winter/spring, i.e. ice-covered per
- Page 33 and 34: Light conditions Introduction Light
- Page 35 and 36: TABLE 13. CURRENT CONDITIONS: turbi
- Page 37 and 38: Acidity / acidification Introductio
- Page 39 and 40: industrial pH). The change in acidi
- Page 41 and 42: The pre-industrial concentration of
- Page 43 and 44: very high degree of reliability and
- Page 45 and 46: TABLE 19. CURRENT CONDITIONS: metal
- Page 47 and 48: TABLE 22. DEVIATION from reference
- Page 49 and 50: TABLE 24. (continued) Cu Zn Cd Pb C
- Page 51 and 52: Swedish EPA (1993): Metals and the
- Page 53 and 54: Assessment of current conditions TA
- Page 55 and 56: TABLE 29. CURRENT CONDITIONS: poten
- Page 57 and 58: TABLE 32. DEVIATION from reference
- Page 59 and 60: References Cronberg, G., Lindmark,
- Page 61 and 62: (see Appendix 1). If submerged and
Internationally, the most widely accepted framework for environmental indicators<br />
is based on PSR-chains (Pressure-State-Response). Indicators are<br />
chosen which reflect the relationship between environmental effects, <strong>and</strong>/or<br />
there causes <strong>and</strong> measures taken. There is also a more sophisticated version,<br />
called DPSIR (Driving forces-Pressure-State-Impact-Response). Variants of<br />
the PSR/DPSIR systems are used by, among others, the OECD, the Nordic<br />
Council of Ministers, the United Nations, the World Bank, the European<br />
Union's Environmental Agency.<br />
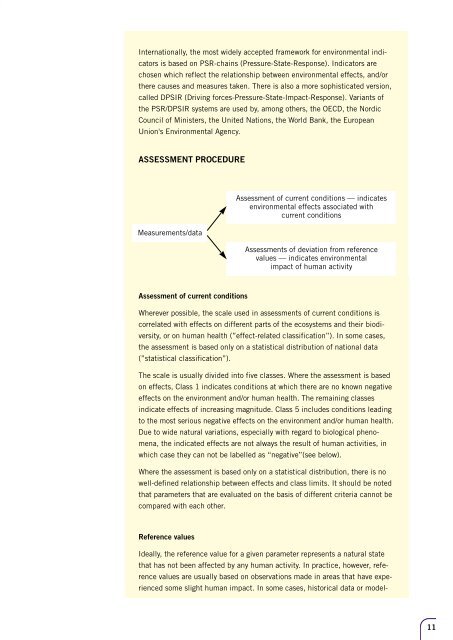
ASSESSMENT PROCEDURE<br />
Measurements/data<br />
Assessment of current conditions — indicates<br />
environmental effects associated with<br />
current conditions<br />
Assessments of deviation from reference<br />
values — indicates environmental<br />
impact of human activity<br />
Assessment of current conditions<br />
Wherever possible, the scale used in assessments of current conditions is<br />
correlated with effects on different parts of the ecosystems <strong>and</strong> their biodiversity,<br />
or on human health (”effect-related classification”). In some cases,<br />
the assessment is based only on a statistical distribution of national data<br />
(”statistical classification”).<br />
The scale is usually divided into five classes. Where the assessment is based<br />
on effects, Class 1 indicates conditions at which there are no known negative<br />
effects on the environment <strong>and</strong>/or human health. The remaining classes<br />
indicate effects of increasing magnitude. Class 5 includes conditions leading<br />
to the most serious negative effects on the environment <strong>and</strong>/or human health.<br />
Due to wide natural variations, especially with regard to biological phenomena,<br />
the indicated effects are not always the result of human activities, in<br />
which case they can not be labelled as “negative”(see below).<br />
Where the assessment is based only on a statistical distribution, there is no<br />
well-defined relationship between effects <strong>and</strong> class limits. It should be noted<br />
that parameters that are evaluated on the basis of different criteria cannot be<br />
compared with each other.<br />
Reference values<br />
Ideally, the reference value for a given parameter represents a natural state<br />
that has not been affected by any human activity. In practice, however, reference<br />
values are usually based on observations made in areas that have experienced<br />
some slight human impact. In some cases, historical data or model-<br />
11


