Wetland Determination Data Form - U.S. Army
Wetland Determination Data Form - U.S. Army
Wetland Determination Data Form - U.S. Army

Create successful ePaper yourself
Turn your PDF publications into a flip-book with our unique Google optimized e-Paper software.
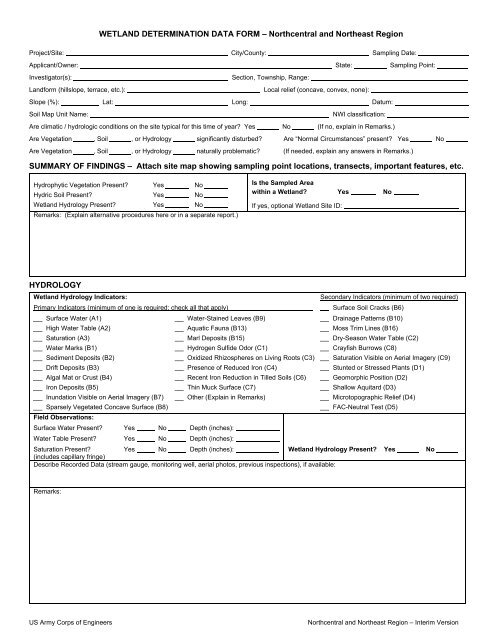
WETLAND DETERMINATION DATA FORM – Northcentral and Northeast Region<br />
Project/Site: City/County: Sampling Date:<br />
Applicant/Owner: State: Sampling Point:<br />
Investigator(s):<br />
Section, Township, Range:<br />
Landform (hillslope, terrace, etc.):<br />
Local relief (concave, convex, none):<br />
Slope (%): Lat: Long: Datum:<br />
Soil Map Unit Name:<br />
NWI classification:<br />
Are climatic / hydrologic conditions on the site typical for this time of year? Yes No (If no, explain in Remarks.)<br />
Are Vegetation , Soil , or Hydrology significantly disturbed? Are “Normal Circumstances” present? Yes No<br />
Are Vegetation , Soil , or Hydrology naturally problematic? (If needed, explain any answers in Remarks.)<br />
SUMMARY OF FINDINGS – Attach site map showing sampling point locations, transects, important features, etc.<br />
Hydrophytic Vegetation Present? Yes No<br />
Hydric Soil Present? Yes No<br />
<strong>Wetland</strong> Hydrology Present? Yes No<br />
Remarks: (Explain alternative procedures here or in a separate report.)<br />
Is the Sampled Area<br />
within a <strong>Wetland</strong>? Yes No<br />
If yes, optional <strong>Wetland</strong> Site ID:<br />
HYDROLOGY<br />
<strong>Wetland</strong> Hydrology Indicators:<br />
Secondary Indicators (minimum of two required)<br />
Primary Indicators (minimum of one is required; check all that apply)<br />
Surface Soil Cracks (B6)<br />
Surface Water (A1) Water-Stained Leaves (B9) Drainage Patterns (B10)<br />
High Water Table (A2) Aquatic Fauna (B13) Moss Trim Lines (B16)<br />
Saturation (A3) Marl Deposits (B15) Dry-Season Water Table (C2)<br />
Water Marks (B1) Hydrogen Sulfide Odor (C1) Crayfish Burrows (C8)<br />
Sediment Deposits (B2) Oxidized Rhizospheres on Living Roots (C3) Saturation Visible on Aerial Imagery (C9)<br />
Drift Deposits (B3) Presence of Reduced Iron (C4) Stunted or Stressed Plants (D1)<br />
Algal Mat or Crust (B4) Recent Iron Reduction in Tilled Soils (C6) Geomorphic Position (D2)<br />
Iron Deposits (B5) Thin Muck Surface (C7) Shallow Aquitard (D3)<br />
Inundation Visible on Aerial Imagery (B7) Other (Explain in Remarks) Microtopographic Relief (D4)<br />
Sparsely Vegetated Concave Surface (B8)<br />
FAC-Neutral Test (D5)<br />
Field Observations:<br />
Surface Water Present? Yes No Depth (inches):<br />
Water Table Present? Yes No Depth (inches):<br />
Saturation Present? Yes No Depth (inches):<br />
<strong>Wetland</strong> Hydrology Present? Yes No<br />
(includes capillary fringe)<br />
Describe Recorded <strong>Data</strong> (stream gauge, monitoring well, aerial photos, previous inspections), if available:<br />
Remarks:<br />
US <strong>Army</strong> Corps of Engineers<br />
Northcentral and Northeast Region – Interim Version
VEGETATION – Use scientific names of plants.<br />
Absolute Dominant Indicator<br />
Tree Stratum (Plot size: ) % Cover Species? Status<br />
1.<br />
2.<br />
3.<br />
4.<br />
5.<br />
6.<br />
7.<br />
= Total Cover<br />
Sapling/Shrub Stratum (Plot size: )<br />
1.<br />
2.<br />
3.<br />
4.<br />
5.<br />
6.<br />
7.<br />
= Total Cover<br />
Herb Stratum (Plot size: )<br />
1.<br />
2.<br />
3.<br />
4.<br />
5.<br />
6.<br />
7.<br />
8.<br />
9.<br />
10.<br />
11.<br />
12.<br />
= Total Cover<br />
Woody Vine Stratum (Plot size: )<br />
1.<br />
2.<br />
3.<br />
4.<br />
= Total Cover<br />
Remarks: (Include photo numbers here or on a separate sheet.)<br />
Dominance Test worksheet:<br />
Number of Dominant Species<br />
That Are OBL, FACW, or FAC:<br />
Total Number of Dominant<br />
Species Across All Strata:<br />
Percent of Dominant Species<br />
That Are OBL, FACW, or FAC:<br />
Sampling Point:<br />
(A)<br />
(B)<br />
(A/B)<br />
Prevalence Index worksheet:<br />
Total % Cover of:<br />
Multiply by:<br />
OBL species x 1 =<br />
FACW species x 2 =<br />
FAC species x 3 =<br />
FACU species x 4 =<br />
UPL species x 5 =<br />
Column Totals: (A) (B)<br />
Prevalence Index = B/A =<br />
Hydrophytic Vegetation Indicators:<br />
Rapid Test for Hydrophytic Vegetation<br />
Dominance Test is >50%<br />
Prevalence Index is ≤3.0 1<br />
Morphological Adaptations 1 (Provide supporting<br />
data in Remarks or on a separate sheet)<br />
Problematic Hydrophytic Vegetation 1 (Explain)<br />
1<br />
Indicators of hydric soil and wetland hydrology must<br />
be present, unless disturbed or problematic.<br />
Definitions of Vegetation Strata:<br />
Tree – Woody plants 3 in. (7.6 cm) or more in diameter<br />
at breast height (DBH), regardless of height.<br />
Sapling/shrub – Woody plants less than 3 in. DBH<br />
and greater than 3.28 ft (1 m) tall.<br />
Herb – All herbaceous (non-woody) plants, regardless<br />
of size, and woody plants less than 3.28 ft tall.<br />
Woody vines – All woody vines greater than 3.28 ft in<br />
height.<br />
Hydrophytic<br />
Vegetation<br />
Present? Yes No<br />
US <strong>Army</strong> Corps of Engineers<br />
Northcentral and Northeast Region – Interim Version
SOIL<br />
Sampling Point:<br />
Profile Description: (Describe to the depth needed to document the indicator or confirm the absence of indicators.)<br />
Depth Matrix Redox Features<br />
(inches) Color (moist) % Color (moist) % Type 1 Loc 2 Texture Remarks<br />
1<br />
Type: C=Concentration, D=Depletion, RM=Reduced Matrix, CS=Covered or Coated Sand Grains.<br />
2 Location: PL=Pore Lining, M=Matrix.<br />
Hydric Soil Indicators: Indicators for Problematic Hydric Soils 3 :<br />
Histosol (A1) Polyvalue Below Surface (S8) (LRR R, 2 cm Muck (A10) (LRR K, L, MLRA 149B)<br />
Histic Epipedon (A2) MLRA 149B) Coast Prairie Redox (A16) (LRR K, L, R)<br />
Black Histic (A3) Thin Dark Surface (S9) (LRR R, MLRA 149B) 5 cm Mucky Peat or Peat (S3) (LRR K, L, R)<br />
Hydrogen Sulfide (A4) Loamy Mucky Mineral (F1) (LRR K, L) Dark Surface (S7) (LRR K, L)<br />
Stratified Layers (A5) Loamy Gleyed Matrix (F2) Polyvalue Below Surface (S8) (LRR K, L)<br />
Depleted Below Dark Surface (A11) Depleted Matrix (F3) Thin Dark Surface (S9) (LRR K, L)<br />
Thick Dark Surface (A12) Redox Dark Surface (F6) Iron-Manganese Masses (F12) (LRR K, L, R)<br />
Sandy Mucky Mineral (S1) Depleted Dark Surface (F7) Piedmont Floodplain Soils (F19) (MLRA 149B)<br />
Sandy Gleyed Matrix (S4) Redox Depressions (F8) Mesic Spodic (TA6) (MLRA 144A, 145, 149B)<br />
Sandy Redox (S5)<br />
Red Parent Material (TF2)<br />
Stripped Matrix (S6)<br />
Very Shallow Dark Surface (TF12)<br />
Dark Surface (S7) (LRR R, MLRA 149B)<br />
Other (Explain in Remarks)<br />
3<br />
Indicators of hydrophytic vegetation and wetland hydrology must be present, unless disturbed or problematic.<br />
Restrictive Layer (if observed):<br />
Type:<br />
Depth (inches): Hydric Soil Present? Yes No<br />
Remarks:<br />
US <strong>Army</strong> Corps of Engineers<br />
Northcentral and Northeast Region – Interim Version