VHL2 LM-79-08 Test Report - Howard Lighting
VHL2 LM-79-08 Test Report - Howard Lighting
VHL2 LM-79-08 Test Report - Howard Lighting

Create successful ePaper yourself
Turn your PDF publications into a flip-book with our unique Google optimized e-Paper software.
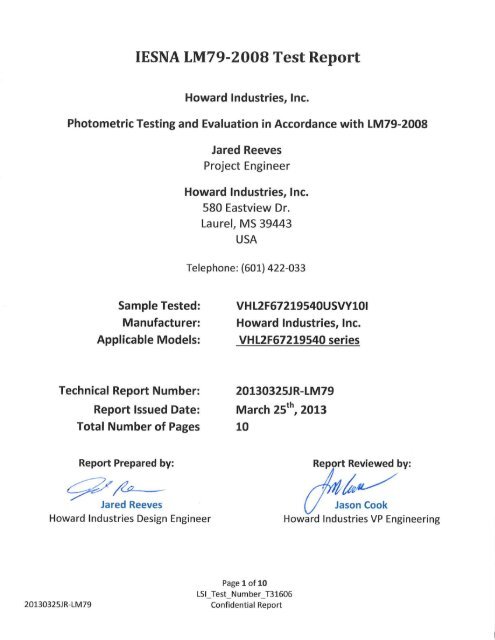
IESNA <strong>LM</strong><strong>79</strong>-20<strong>08</strong><br />
TEST REPORT<br />
<strong>Report</strong> # 20130325JR-<strong>LM</strong><strong>79</strong><br />
March 25, 2013<br />
<strong>Test</strong> performed by:<br />
<strong>Lighting</strong> Sciences, Inc.<br />
UL Verification Services<br />
7826 E. Evans Rd.<br />
Scottsdale, Arizona 85260 USA<br />
P: 480-991-9260 F: 480-991-0375<br />
lsi@ul.com<br />
INDEPENDENT TEST LABORATORY REPORT No. 31606<br />
20130325JR-<strong>LM</strong><strong>79</strong><br />
Page 2 of 11<br />
LSI_<strong>Test</strong>_Number_T31606<br />
Confidential <strong>Report</strong>
IESNA <strong>LM</strong><strong>79</strong>-20<strong>08</strong><br />
TEST REPORT<br />
<strong>Report</strong> # 20130325JR-<strong>LM</strong><strong>79</strong><br />
Summary of Key <strong>Test</strong> Results:<br />
Model#<br />
<strong>VHL2</strong>F67219540USVY10I<br />
Manufacturer <strong>Howard</strong> Industries, Inc.<br />
LSI <strong>Test</strong>#<br />
T31606<br />
Date of <strong>Test</strong> March 11 th , 2013<br />
Notes:<br />
<strong>Test</strong>ed in field application<br />
orientation.<br />
Parameter<br />
Luminous Flux<br />
Input Power<br />
Efficacy<br />
Measured Result<br />
17850 Lumens<br />
219.0 Watts<br />
81.5 Lumens per Watt<br />
C.C.T. 3903<br />
C.R.I. 84.8<br />
Beam Angle 104.6<br />
Stabilization Time<br />
120 minutes<br />
The above results are recorded / derived from measurments in accordance with <strong>LM</strong><strong>79</strong>-<strong>08</strong><br />
20130325JR-<strong>LM</strong><strong>79</strong><br />
Page 3 of 11<br />
LSI_<strong>Test</strong>_Number_T31606<br />
Confidential <strong>Report</strong>
IESNA <strong>LM</strong><strong>79</strong>-20<strong>08</strong><br />
TEST REPORT<br />
<strong>Report</strong> # 20130325JR-<strong>LM</strong><strong>79</strong><br />
Table of Contents<br />
<strong>Test</strong> Results ............................................................................................................................................................................. 5<br />
Spectral Flux and Chromaticity Diagram ............................................................................................................................. 6<br />
Zonal Lumens Summary ...................................................................................................................................................... 6<br />
Candela Plots ...................................................................................................................................................................... 7<br />
Canedle Power Data ............................................................................................................................................................ 8<br />
<strong>Lighting</strong> Sciences, Inc. <strong>Test</strong>ing Information ........................................................................................................................... 9<br />
Equipment List ..................................................................................................................................................................... 10<br />
20130325JR-<strong>LM</strong><strong>79</strong><br />
Page 4 of 11<br />
LSI_<strong>Test</strong>_Number_T31606<br />
Confidential <strong>Report</strong>
IESNA <strong>LM</strong><strong>79</strong>-20<strong>08</strong><br />
TEST REPORT<br />
<strong>Report</strong> # 20130325JR-<strong>LM</strong><strong>79</strong><br />
<strong>Test</strong> Results –<br />
The following results were obtained after stabilization of the sample in accordance with the requirements set forth<br />
in section 5.0 of IES <strong>LM</strong><strong>79</strong>-20<strong>08</strong>. Stability is achieved when the variation of 3 readings of light output and electrical<br />
power over a period of 30 minutes, taken 15 minutes apart, is less than 0.5%.<br />
Photometric Results<br />
<strong>VHL2</strong>F67219540USVY10I<br />
Integrating Sphere<br />
Goniophotometer<br />
Total Luminous Flux (Lumens) 17850 17039<br />
Luminous Efficacy (Lumens / Watt) 81.5 76.4<br />
Total Radiant Flux (Watts) 53.429 -<br />
Correlated Color Temperature (CCT) 3903 -<br />
Color Rendering Index (CRI - R a ) 84.8 -<br />
R g Value 23.3 -<br />
Chromaticity (Chroma x / Chroma y) 0.387 / 0.3875 -<br />
Chromaticity (Chroma u / Chroma v) 0.2252 / 0.3381 -<br />
Chromaticity (Chroma u’ / Chroma v’) 0.2252 / 0.5072 -<br />
Duv Value 0.0029 -<br />
Expanded Uncertainty (k=2) (Percent) 2.1 2.8<br />
Electrical Results<br />
<strong>VHL2</strong>F67219540USVY10I<br />
Integrating Sphere<br />
Goniophotometer<br />
Input Power (Watts) (120/277V) 224.6 / 219.0 223.0<br />
Input Voltage (Volts AC) (120/277V) 120.0 / 277.0 120<br />
Input Current (Amps) (120/277V) 1.881 / .881 1.871<br />
Power Factor (120/277V) 99.5 / 89.7 99.3<br />
Input Frequency (Hertz) 60.0 60.0<br />
A-THD (Current %) (120/277V) 6.56 / 17.89 % N/A<br />
Additional Parameters<br />
<strong>VHL2</strong>F67219540USVY10I<br />
Integrating Sphere<br />
Goniophotometer<br />
Stabilization Time (Light and Power) 120 120<br />
<strong>Test</strong> Geometry Configuration 4π Type C<br />
Spectroradiometer Labsphere <strong>LM</strong>S-760 <strong>Lighting</strong> Sciences 6000<br />
Ambient Temperature 25.0 25.0<br />
ISTMT (In-Situ Temperature Measurement)<br />
Not <strong>Test</strong>ed<br />
Spacing Criteria<br />
N/A<br />
20130325JR-<strong>LM</strong><strong>79</strong><br />
Page 5 of 11<br />
LSI_<strong>Test</strong>_Number_T31606<br />
Confidential <strong>Report</strong>
IESNA <strong>LM</strong><strong>79</strong>-20<strong>08</strong><br />
TEST REPORT<br />
<strong>Report</strong> # 20130325JR-<strong>LM</strong><strong>79</strong><br />
Spectral Flux and Chrmaticity Diagram –<br />
Spectral response of the Radiant Flux<br />
(380 to 780nm)<br />
20130325JR-<strong>LM</strong><strong>79</strong><br />
Tristimulus values<br />
x/ y = 0.3870 / 0.3875<br />
Zonal Lumens Summary –<br />
Zone Lumens % Luminaire<br />
0-30 4642 27.24<br />
0-40 7497 44.00<br />
0-60 12813 75.20<br />
0-90 16444 96.51<br />
40-90 8947 52.51<br />
60-90 3631 21.31<br />
Page 6 of 11<br />
LSI_<strong>Test</strong>_Number_T31606<br />
Confidential <strong>Report</strong>
IESNA <strong>LM</strong><strong>79</strong>-20<strong>08</strong><br />
TEST REPORT<br />
<strong>Report</strong> # 20130325JR-<strong>LM</strong><strong>79</strong><br />
90-180 595 3.49<br />
0-180 17039 100.00<br />
<strong>Test</strong> Results – Candela Plots<br />
The following images show the IsoFootcandle, Isocandela, and Zonal Distribution Plots respectively.<br />
20130325JR-<strong>LM</strong><strong>79</strong><br />
Page 7 of 11<br />
LSI_<strong>Test</strong>_Number_T31606<br />
Confidential <strong>Report</strong>
IESNA <strong>LM</strong><strong>79</strong>-20<strong>08</strong><br />
TEST REPORT<br />
<strong>Report</strong> # 20130325JR-<strong>LM</strong><strong>79</strong><br />
20130325JR-<strong>LM</strong><strong>79</strong><br />
Page 8 of 11<br />
LSI_<strong>Test</strong>_Number_T31606<br />
Confidential <strong>Report</strong>
IESNA <strong>LM</strong><strong>79</strong>-20<strong>08</strong><br />
TEST REPORT<br />
<strong>Report</strong> # 20130325JR-<strong>LM</strong><strong>79</strong><br />
<strong>Test</strong> Results –Candle Power Data<br />
The following table shows the Candela measurements from the ies file completed by the ganiophotometer.<br />
Maximum candela = 6069.5 located at horizontal : 67.5⁰, Vertical : 2.5⁰<br />
20130325JR-<strong>LM</strong><strong>79</strong><br />
Page 9 of 11<br />
LSI_<strong>Test</strong>_Number_T31606<br />
Confidential <strong>Report</strong>
IESNA <strong>LM</strong><strong>79</strong>-20<strong>08</strong><br />
TEST REPORT<br />
<strong>Report</strong> # 20130325JR-<strong>LM</strong><strong>79</strong><br />
<strong>Lighting</strong> Sciences, Inc. (LSI) <strong>Test</strong>ing Information<br />
The following information was taken directly from the LSI Lab <strong>Report</strong>:<br />
INDEPENDENT TEST LABORATORY REPORT No. 31606A<br />
HOWARD INDUSTRIES INC - VAPOR TIGHT LUMINAIRE,CAT# <strong>VHL2</strong>F67219540USVY10I<br />
WITH WHITE INTERIOR AND FROSTED PLASTIC DROP LENS<br />
672 LEDS. LUMINAIRE OUTPUT = 17039 <strong>LM</strong><br />
LUMINAIRE OPERATING AT 120 VAC AND 223 WATTS<br />
LUMINOUS OPENING SIDE VIEW.<br />
All testing was conducted in accordance with <strong>LM</strong>-<strong>79</strong>-<strong>08</strong>,<br />
Approved Method: Electrical and Photometric Measurements of Solid-State <strong>Lighting</strong> Products as published by the<br />
Illuminating Engineering Society of North America (IESNA).<br />
The condition of the item tested was new. Stabilization time before testing meets the stabilization requirements<br />
of <strong>LM</strong>-<strong>79</strong>-<strong>08</strong>.<br />
The test results (luminous distribution and flux) were obtained by using a <strong>Lighting</strong> Sciences series<br />
6000 Type C Moving Mirror Goniophotometer<br />
The photometric reference standard used is a set of three incandescent luminous intensity standard lamps calibrated<br />
and traceable to the U.S. National Institute of Standards and Technology.<br />
The test results (colorimetric and luminous flux) were obtained by using a Labsphere Model <strong>LM</strong>S-760 Integrating Sphere.<br />
4π geometry was used. Correction factors were applied for self-absorption.<br />
The colorimetric & photometric reference standard used is an incandescent spectral flux standard lamp calibrated and<br />
traceable to the U.S. National Institute of Standards and Technology.<br />
Power measurements were obtained with a Yokogawa WT210 power analyzer. Ambient temperature during testing was<br />
25⁰ C ± 1⁰ C, measured using an Omega model DP460.<br />
Calibration certificates are on file at the laboratories of <strong>Lighting</strong> Sciences Inc.<br />
The results in this report apply to the test sample(s) mentioned in this report at the time of the testing period only and are<br />
not to be used to indicate applicability to other similar products.<br />
20130325JR-<strong>LM</strong><strong>79</strong><br />
Page 10 of 11<br />
LSI_<strong>Test</strong>_Number_T31606<br />
Confidential <strong>Report</strong>
IESNA <strong>LM</strong><strong>79</strong>-20<strong>08</strong><br />
TEST REPORT<br />
<strong>Report</strong> # 20130325JR-<strong>LM</strong><strong>79</strong><br />
LSI Equipment List:<br />
All Calibration Data is on file at LSI.<br />
<strong>Lighting</strong> Sciences, Inc. equipment -<br />
Description Manufacturer / Model #<br />
Integrating Sphere Labsphere <strong>LM</strong>S-760<br />
Goniophotometer <strong>Lighting</strong> Sciences series 6000<br />
Power Analyzer<br />
Yokogawa WT210<br />
Thermometer<br />
Omega DP460<br />
20130325JR-<strong>LM</strong><strong>79</strong><br />
Page 11 of 11<br />
LSI_<strong>Test</strong>_Number_T31606<br />
Confidential <strong>Report</strong>