CTDI - ImPACT CT Scanner Evaluation Centre
CTDI - ImPACT CT Scanner Evaluation Centre
CTDI - ImPACT CT Scanner Evaluation Centre

Create successful ePaper yourself
Turn your PDF publications into a flip-book with our unique Google optimized e-Paper software.
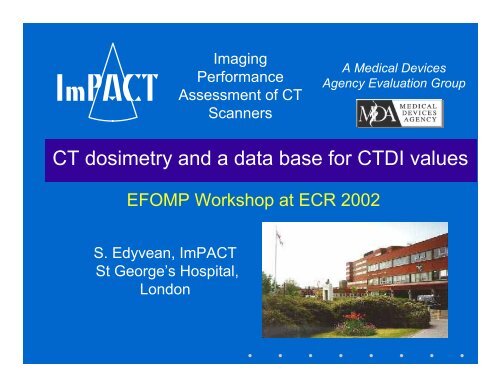
<strong>ImPA<strong>CT</strong></strong><br />
Imaging<br />
Performance<br />
Assessment of <strong>CT</strong><br />
<strong>Scanner</strong>s<br />
A Medical Devices<br />
Agency <strong>Evaluation</strong> Group<br />
<strong>CT</strong> dosimetry and a data base for <strong><strong>CT</strong>DI</strong> values<br />
EFOMP Workshop at ECR 2002<br />
S. Edyvean, <strong>ImPA<strong>CT</strong></strong><br />
St George’s Hospital,<br />
London
<strong>CT</strong> scanner dose distribution<br />
higher<br />
lower<br />
<strong>ImPA<strong>CT</strong></strong> EFOMP 2002<br />
2
<strong>CT</strong> scanner dosimetry<br />
• Computed Tomography Dose Index (<strong><strong>CT</strong>DI</strong>)<br />
– <strong><strong>CT</strong>DI</strong> FDA<br />
– <strong><strong>CT</strong>DI</strong> 100<br />
– <strong><strong>CT</strong>DI</strong> w<br />
<strong><strong>CT</strong>DI</strong> 100<br />
=<br />
1<br />
T<br />
+ 50<br />
∫<br />
−50<br />
D(z)dz<br />
<strong><strong>CT</strong>DI</strong> w =1/3<strong><strong>CT</strong>DI</strong> c +2/3<strong><strong>CT</strong>DI</strong> p<br />
c = centre positon, p= periphery position<br />
<strong>ImPA<strong>CT</strong></strong> EFOMP 2002<br />
3
<strong>CT</strong> scanner dosimetry<br />
• Monte Carlo Calculations<br />
• NRPB (1991,1993)<br />
• GSF (1991)<br />
• WinDose<br />
<strong>ImPA<strong>CT</strong></strong> EFOMP 2002<br />
4
NRPB <strong>CT</strong> organ dose datasets<br />
• NRPB SR250, 1993<br />
• 23 Organ dose data sets generated using MC calculations<br />
→ Effective Dose<br />
• Organ dose and ED expressed relative to <strong><strong>CT</strong>DI</strong> in air<br />
→ n D mGy / mGy, n ED mSv/ mGy<br />
• Numerical phantom<br />
NRPB R248 , 249, 250, SR250<br />
<strong>ImPA<strong>CT</strong></strong> EFOMP 2002<br />
5
NRPB <strong>CT</strong> organ dose datasets<br />
• Relevant information from manufacturers<br />
for 27 scanner models<br />
• Condensed to 13 scanner groups<br />
based on scanners with<br />
similar dosimetry characteristics<br />
• Different kVs<br />
23 Monte Carlo<br />
organ dose data sets<br />
<strong>ImPA<strong>CT</strong></strong> EFOMP 2002<br />
6
Purpose of <strong>ImPA<strong>CT</strong></strong> survey<br />
• In 1996 80 scanner models with different names<br />
in use in the UK<br />
• NRPB SR250 MC data sets not applicable to ~65% of<br />
scanners in UK<br />
• increasing due to number of newer scanner models<br />
• How to estimate patient doses on these scanners ?<br />
<strong>ImPA<strong>CT</strong></strong> EFOMP 2002<br />
7
Three choices<br />
1. Generate new MC datasets<br />
– no relevant expertise<br />
– difficult to acquire accurate information<br />
on ~ 80 scanner models<br />
<strong>ImPA<strong>CT</strong></strong> EFOMP 2002<br />
8
Three choices<br />
2. Data set from an ‘average’ scanner<br />
– does not address differences between models<br />
3. Use dose distribution characteristics to<br />
match new scanner models to those<br />
used in NRPB SR250<br />
Then use appropriate MC data set<br />
– Based on assumption that old and<br />
new scanners fell within similar ranges<br />
– method chosen<br />
<strong>ImPA<strong>CT</strong></strong> EFOMP 2002<br />
9
<strong>Scanner</strong> Characteristics Survey<br />
• Measurement based approach<br />
– easy to carry out on existing and future scanners<br />
• Standard protocol<br />
– how to do the measurements<br />
– accuracy and tolerances of set up<br />
– data sheets<br />
• 30 centres, 74 scanners<br />
• UK + Holland,France,Spain<br />
x-ray tube<br />
x-ray slice<br />
y-axis<br />
ion chamber<br />
scanner z-axis<br />
tilt<br />
<strong>Scanner</strong> couch<br />
<strong>ImPA<strong>CT</strong></strong> EFOMP 2002<br />
detectors<br />
10
<strong>Scanner</strong> models<br />
• 80 models ~ 40 groups<br />
– at first by partial knowledge<br />
– then refined by review of measurement data<br />
<strong>ImPA<strong>CT</strong></strong> EFOMP 2002<br />
11
<strong><strong>CT</strong>DI</strong> air<br />
X-ray source<br />
<strong><strong>CT</strong>DI</strong> phantom<br />
Ion<br />
chamber<br />
Perspex<br />
Phantom<br />
Detectors<br />
HVL<br />
Off-axis variation<br />
Aluminium
<strong>ImPA<strong>CT</strong></strong> survey data<br />
• Separated scanners into<br />
– those with NRPB SR250 MC data sets<br />
– newer models without<br />
<strong>ImPA<strong>CT</strong></strong> EFOMP 2002<br />
13
<strong>Scanner</strong>s with NRPB SR250 MC data sets<br />
• Survey measurement data versus calculated ED<br />
• Establish which combination of data gave best<br />
correlation<br />
<strong><strong>CT</strong>DI</strong> air<br />
<strong><strong>CT</strong>DI</strong> ph<br />
HVL<br />
<strong>ImPA<strong>CT</strong></strong> EFOMP 2002<br />
14
<strong>Scanner</strong>s with NRPB SR250 MC data sets<br />
• Survey measurement data versus calculated ED<br />
• Establish which combination of data gave best<br />
correlation<br />
<strong><strong>CT</strong>DI</strong> air<br />
<strong><strong>CT</strong>DI</strong> ph<br />
HVL<br />
<strong>ImPA<strong>CT</strong></strong> EFOMP 2002<br />
15
<strong>Scanner</strong>s with NRPB SR250 MC data sets<br />
• Survey measurement data versus calculated ED<br />
• Establish which combination of data gave best<br />
correlation with ED<br />
<strong><strong>CT</strong>DI</strong> air<br />
<strong><strong>CT</strong>DI</strong> ph<br />
HVL<br />
<strong>ImPA<strong>CT</strong></strong> EFOMP 2002<br />
16
<strong><strong>CT</strong>DI</strong> data : phantom factor<br />
<strong><strong>CT</strong>DI</strong> air<br />
<strong><strong>CT</strong>DI</strong> ph<br />
HVL<br />
Phantom Factor = <strong><strong>CT</strong>DI</strong> w / <strong><strong>CT</strong>DI</strong> air<br />
Gelijns, K.<br />
Patient Dosimetry in Diagnostic Radiology, Chest Examinations<br />
and Computed Tomography, PhD Thesis, Leiden<br />
<strong>ImPA<strong>CT</strong></strong> EFOMP 2002<br />
17
‘<strong>ImPA<strong>CT</strong></strong>’ factor<br />
<strong><strong>CT</strong>DI</strong> air<br />
<strong><strong>CT</strong>DI</strong> ph<br />
<strong><strong>CT</strong>DI</strong> air<br />
<strong><strong>CT</strong>DI</strong> c ,<strong><strong>CT</strong>DI</strong> p<br />
HVL<br />
• Multi-variate analysis<br />
– for combination which gave best correlation<br />
‘<strong>ImPA<strong>CT</strong></strong>’ Factor<br />
ImF = a. (<strong><strong>CT</strong>DI</strong>c / <strong><strong>CT</strong>DI</strong>air)+ b. (<strong><strong>CT</strong>DI</strong>p / <strong><strong>CT</strong>DI</strong>air)+ constant<br />
<strong>ImPA<strong>CT</strong></strong> EFOMP 2002<br />
18
HVL vs normalised ED<br />
12<br />
10<br />
y = 7.6119x + 0.0736<br />
R 2 = 0.9131<br />
8<br />
HVL (mm)<br />
6<br />
4<br />
2<br />
0<br />
0 0.2 0.4 0.6 0.8 1 1.2 1.4<br />
Normalised Effective Dose<br />
( ED / <strong><strong>CT</strong>DI</strong> air )<br />
(mSv/mGy)<br />
<strong>ImPA<strong>CT</strong></strong> EFOMP 2002<br />
19
HVL vs normalised ED<br />
12<br />
10<br />
y = 7.6119x + 0.0736<br />
R 2 = 0.9131<br />
8<br />
HVL (mm)<br />
6<br />
4<br />
2<br />
0<br />
0 0.2 0.4 0.6 0.8 1 1.2 1.4<br />
Normalised Effective Dose<br />
( ED / <strong><strong>CT</strong>DI</strong> air )<br />
(mSv/mGy)<br />
<strong>ImPA<strong>CT</strong></strong> EFOMP 2002<br />
20
Phantom factor vs normalised ED<br />
Phantom Factor (<strong><strong>CT</strong>DI</strong> w / <strong><strong>CT</strong>DI</strong> air )<br />
1<br />
0.9<br />
0.8<br />
0.7<br />
0.6<br />
0.5<br />
0.4<br />
0.3<br />
0.2<br />
0.1<br />
y = 0.7089x + 0.0012<br />
R 2 = 0.9369<br />
0<br />
0.0 0.2 0.4 0.6 0.8 1.0 1.2 1.4<br />
Normalised Effective Dose<br />
<strong>ImPA<strong>CT</strong></strong> EFOMP 2002<br />
( ED / <strong><strong>CT</strong>DI</strong> air )<br />
21
ImF vs Effective Dose<br />
1.6<br />
1.4<br />
1.2<br />
y = 0.977x + 0.0203<br />
R 2 = 0.977<br />
1.0<br />
0.8<br />
0.6<br />
0.4<br />
0.2<br />
0.0<br />
0 0.2 0.4 0.6 0.8 1 1.2 1.4 1.6<br />
Normalised Effective Dose (Abdomen)<br />
( ED / <strong><strong>CT</strong>DI</strong> air )<br />
<strong>ImPA<strong>CT</strong></strong> EFOMP 2002<br />
22
Correlations for data combinations<br />
Correlation co-efficient (r^2)<br />
(r 2 )<br />
1<br />
0.975<br />
0.95<br />
0.925<br />
0.9<br />
0.875<br />
0.85<br />
0.825<br />
0.8<br />
<strong>ImPA<strong>CT</strong></strong> EFOMP 2002<br />
HVL <strong><strong>CT</strong>DI</strong> <strong><strong>CT</strong>DI</strong> HVL,<br />
<strong><strong>CT</strong>DI</strong><br />
HVL <strong><strong>CT</strong>DI</strong> CDTI HVL & <strong><strong>CT</strong>DI</strong><br />
(PF) (ImF)<br />
head<br />
neck<br />
chest<br />
abdo<br />
pelvis<br />
23
Newer scanner models<br />
• ImF calculated<br />
• Compare to ImFs for SR250 scanners<br />
• Find closest match<br />
• Use that MC dataset<br />
New<br />
ImF<br />
<strong>Scanner</strong><br />
Philips AV 0.62<br />
SR250 ImF<br />
<strong>Scanner</strong><br />
xxx 0.60<br />
yyy 0.75<br />
Data Set<br />
MC 1<br />
MC 2<br />
<strong>ImPA<strong>CT</strong></strong> EFOMP 2002<br />
24
<strong><strong>CT</strong>DI</strong> data<br />
<strong>ImPA<strong>CT</strong></strong> EFOMP 2002<br />
25
<strong>ImPA<strong>CT</strong></strong> Factor - scanner matching<br />
<strong>ImPA<strong>CT</strong></strong> EFOMP 2002<br />
26
Organ and Effective Dose<br />
<strong>ImPA<strong>CT</strong></strong> EFOMP 2002<br />
28
Spiral scanning<br />
<strong>ImPA<strong>CT</strong></strong> EFOMP 2002<br />
29
<strong><strong>CT</strong>DI</strong> and collimation<br />
relative <strong><strong>CT</strong>DI</strong><br />
2.50<br />
2.00<br />
1.50<br />
1.00<br />
0.50<br />
0.00<br />
Single slice<br />
plus4<br />
Multi-slice<br />
vol zoom<br />
0 5 10 15 20<br />
collimation<br />
<strong>ImPA<strong>CT</strong></strong> EFOMP 2002<br />
30
<strong><strong>CT</strong>DI</strong> and slice width<br />
<strong>ImPA<strong>CT</strong></strong> EFOMP 2002<br />
31
Multi-slice scanners<br />
<strong>ImPA<strong>CT</strong></strong> EFOMP 2002<br />
32
<strong>ImPA<strong>CT</strong></strong> 1996-1997 survey<br />
• Enabled NRPB datasets to be used for<br />
99% of installed scanners in the UK<br />
• New scanners are measured routinely<br />
by <strong>ImPA<strong>CT</strong></strong> and published<br />
<strong><strong>CT</strong>DI</strong> in air and in phantom ImF<br />
<strong>ImPA<strong>CT</strong></strong> EFOMP 2002<br />
33
EUR16262 Quality Criteria for <strong>CT</strong><br />
• Dose Reference Levels <strong><strong>CT</strong>DI</strong> w , DLP<br />
<strong><strong>CT</strong>DI</strong> w =1/3<strong><strong>CT</strong>DI</strong> c +2/3<strong><strong>CT</strong>DI</strong> p<br />
c = centre positon, p= periphery position<br />
<strong>ImPA<strong>CT</strong></strong> EFOMP 2002<br />
34
<strong>Scanner</strong> models<br />
• Name can be misleading<br />
– Siemens Plus, Plus 4<br />
– Philips LX, AV Expander<br />
• Filtration can change on existing<br />
scanner models<br />
– name stays the same<br />
– need to identify by model name & date<br />
<strong>ImPA<strong>CT</strong></strong> EFOMP 2002<br />
35
<strong>ImPA<strong>CT</strong></strong> data<br />
• Survey data tried to minimise errors<br />
– chambers cross checked<br />
– extensive work checking consistency of data<br />
• data > 10% from mean of a group looked at<br />
• newer scanners use our own data<br />
• checked against manufacturers data<br />
• Data for 10 mm slices only<br />
• used for matching<br />
• look-up tables simplified<br />
• need focal spot with narrow slices<br />
<strong>ImPA<strong>CT</strong></strong> EFOMP 2002<br />
36
• Goal achieved<br />
<strong>ImPA<strong>CT</strong></strong> survey<br />
– matching new scanners to NRPB MC datasets<br />
• Additional use for phantom <strong><strong>CT</strong>DI</strong><br />
– EUR16262 (10 mm data)<br />
• Data continuously updated<br />
– Need to keep aware of manufacturers’ changes<br />
<strong><strong>CT</strong>DI</strong> air<br />
<strong><strong>CT</strong>DI</strong> Px<br />
<strong>ImPA<strong>CT</strong></strong> EFOMP 2002<br />
37
Acknowledgements<br />
• N. Keat, M.A. Lewis, H. Kiremidjian, Dr. S. Sassi,<br />
Dr. A.J Britten,<br />
• S E Jackson (DoH)<br />
• Department of Health Grant Ref RPP 26<br />
• Dr. P. Shrimpton (nrpb)<br />
• Participating centres<br />
<strong>ImPA<strong>CT</strong></strong><br />
Imaging Performance<br />
Assessment of <strong>CT</strong><br />
<strong>Scanner</strong>s<br />
A Medical Devices<br />
Agency <strong>Evaluation</strong> Group<br />
<strong>ImPA<strong>CT</strong></strong> EFOMP 2002<br />
www.impactscan.org<br />
38