Leaflet - ImPACT CT Scanner Evaluation Centre
Leaflet - ImPACT CT Scanner Evaluation Centre
Leaflet - ImPACT CT Scanner Evaluation Centre

Create successful ePaper yourself
Turn your PDF publications into a flip-book with our unique Google optimized e-Paper software.
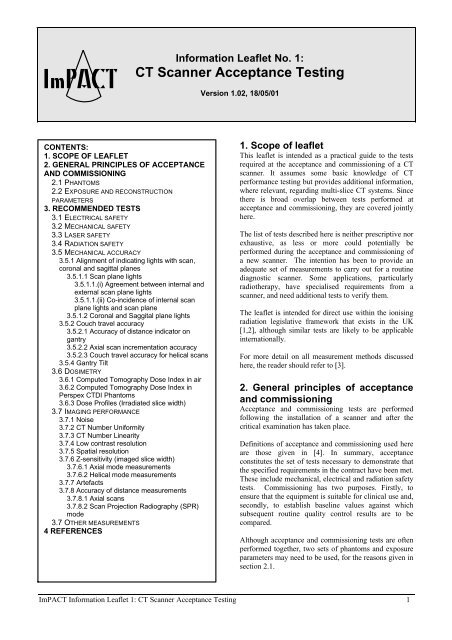
<strong>ImPA<strong>CT</strong></strong><br />
Information <strong>Leaflet</strong> No. 1:<br />
<strong>CT</strong> <strong>Scanner</strong> Acceptance Testing<br />
Version 1.02, 18/05/01<br />
CONTENTS:<br />
1. SCOPE OF LEAFLET<br />
2. GENERAL PRINCIPLES OF ACCEPTANCE<br />
AND COMMISSIONING<br />
2.1 PHANTOMS<br />
2.2 EXPOSURE AND RECONSTRU<strong>CT</strong>ION<br />
PARAMETERS<br />
3. RECOMMENDED TESTS<br />
3.1 ELE<strong>CT</strong>RICAL SAFETY<br />
3.2 MECHANICAL SAFETY<br />
3.3 LASER SAFETY<br />
3.4 RADIATION SAFETY<br />
3.5 MECHANICAL ACCURACY<br />
3.5.1 Alignment of indicating lights with scan,<br />
coronal and sagittal planes<br />
3.5.1.1 Scan plane lights<br />
3.5.1.1.(i) Agreement between internal and<br />
external scan plane lights<br />
3.5.1.1.(ii) Co-incidence of internal scan<br />
plane lights and scan plane<br />
3.5.1.2 Coronal and Saggital plane lights<br />
3.5.2 Couch travel accuracy<br />
3.5.2.1 Accuracy of distance indicator on<br />
gantry<br />
3.5.2.2 Axial scan incrementation accuracy<br />
3.5.2.3 Couch travel accuracy for helical scans<br />
3.5.4 Gantry Tilt<br />
3.6 DOSIMETRY<br />
3.6.1 Computed Tomography Dose Index in air<br />
3.6.2 Computed Tomography Dose Index in<br />
Perspex <strong>CT</strong>DI Phantoms<br />
3.6.3 Dose Profiles (Irradiated slice width)<br />
3.7 IMAGING PERFORMANCE<br />
3.7.1 Noise<br />
3.7.2 <strong>CT</strong> Number Uniformity<br />
3.7.3 <strong>CT</strong> Number Linearity<br />
3.7.4 Low contrast resolution<br />
3.7.5 Spatial resolution<br />
3.7.6 Z-sensitivity (imaged slice width)<br />
3.7.6.1 Axial mode measurements<br />
3.7.6.2 Helical mode measurements<br />
3.7.7 Artefacts<br />
3.7.8 Accuracy of distance measurements<br />
3.7.8.1 Axial scans<br />
3.7.8.2 Scan Projection Radiography (SPR)<br />
mode<br />
3.7 OTHER MEASUREMENTS<br />
4 REFERENCES<br />
1. Scope of leaflet<br />
This leaflet is intended as a practical guide to the tests<br />
required at the acceptance and commissioning of a <strong>CT</strong><br />
scanner. It assumes some basic knowledge of <strong>CT</strong><br />
performance testing but provides additional information,<br />
where relevant, regarding multi-slice <strong>CT</strong> systems. Since<br />
there is broad overlap between tests performed at<br />
acceptance and commissioning, they are covered jointly<br />
here.<br />
The list of tests described here is neither prescriptive nor<br />
exhaustive, as less or more could potentially be<br />
performed during the acceptance and commissioning of<br />
a new scanner. The intention has been to provide an<br />
adequate set of measurements to carry out for a routine<br />
diagnostic scanner. Some applications, particularly<br />
radiotherapy, have specialised requirements from a<br />
scanner, and need additional tests to verify them.<br />
The leaflet is intended for direct use within the ionising<br />
radiation legislative framework that exists in the UK<br />
[1,2], although similar tests are likely to be applicable<br />
internationally.<br />
For more detail on all measurement methods discussed<br />
here, the reader should refer to [3].<br />
2. General principles of acceptance<br />
and commissioning<br />
Acceptance and commissioning tests are performed<br />
following the installation of a scanner and after the<br />
critical examination has taken place.<br />
Definitions of acceptance and commissioning used here<br />
are those given in [4]. In summary, acceptance<br />
constitutes the set of tests necessary to demonstrate that<br />
the specified requirements in the contract have been met.<br />
These include mechanical, electrical and radiation safety<br />
tests. Commissioning has two purposes. Firstly, to<br />
ensure that the equipment is suitable for clinical use and,<br />
secondly, to establish baseline values against which<br />
subsequent routine quality control results are to be<br />
compared.<br />
Although acceptance and commissioning tests are often<br />
performed together, two sets of phantoms and exposure<br />
parameters may need to be used, for the reasons given in<br />
section 2.1.<br />
<strong>ImPA<strong>CT</strong></strong> Information <strong>Leaflet</strong> 1: <strong>CT</strong> <strong>Scanner</strong> Acceptance Testing 1
2.1 Phantoms<br />
Some parameters, such as noise, dose and low contrast<br />
resolution, are dependent on the type of phantom used to<br />
make the measurements. In these cases, phantom<br />
selection is important and depends on the purpose of the<br />
tests.<br />
For acceptance testing, where comparison with<br />
manufacturers’ specifications is required, the phantoms<br />
should match those used by the manufacturer in their<br />
specification documentation. One option is to ask the<br />
manufacturer to supply appropriate phantoms for the<br />
duration of acceptance testing.<br />
When establishing baseline values, the types of<br />
phantoms used should be the same as those that will be<br />
available for the subsequent routine quality control tests.<br />
2.2 Exposure and reconstruction<br />
parameters<br />
Again, these must be considered carefully. At<br />
acceptance, it is important to use the same scan settings<br />
as those selected by the manufacturer in their<br />
documentation.<br />
For commissioning, the most relevant scan settings to<br />
select are those that will be used clinically. For example,<br />
these could cover local clinical settings for a standard<br />
brain scan, a high resolution inner ear scan, and a<br />
standard helical abdomen scan.<br />
3. Recommended tests<br />
3.1 Electrical safety<br />
Electrical safety features, for all components of a<br />
scanner system, should be checked at acceptance and<br />
appropriate guidance is provided in [5,6].<br />
3.2 Mechanical safety<br />
Mechanical safety features such as devices designed to<br />
reduce the risk of collision with the patient, patient<br />
release devices and emergency stop controls or switches<br />
should be tested as part of an acceptance test. Relevant<br />
guidance can be found in IEC standards [5,7].<br />
3.3 Laser safety<br />
Manufacturers’ documentation, guidance notes and<br />
warning notices, regarding the use of any laser<br />
alignment lights installed on the system, should be<br />
checked at acceptance. The person accepting the scanner<br />
should be satisfied that the necessary information has<br />
been provided and that warning notices are displayed in<br />
appropriate locations. He/she should be satisfied that any<br />
safety precautions are well documented. Relevant<br />
guidance on laser safety may be found in [8].<br />
3.4 Radiation safety<br />
The person accepting the scanner must be satisfied that<br />
the scanner system and x-ray room comply with current<br />
radiation safety legislation and guidance [1,2]. The<br />
relevant radiation safety tests, however, should already<br />
have been performed as part of the Critical Examination.<br />
These are discussed for x-ray equipment in general in<br />
[9].<br />
3.5 Mechanical accuracy<br />
3.5.1 Alignment of indicating lights with<br />
scan, coronal and sagittal planes<br />
Figure 1: Alignment of indicating lights to planes<br />
There are a number of methods that can be used to<br />
perform these tests. The techniques described here are<br />
straightforward to implement and require little specialist<br />
test equipment.<br />
3.5.1.1 Scan plane lights<br />
y<br />
x-y: scan (transaxial) plane<br />
x-z: coronal plane<br />
y-z: sagittal plane<br />
3.5.1.1.(i) Agreement between internal and<br />
external scan plane lights<br />
This test is performed to check that the correct distance<br />
separates the internal and external scan plane lights.<br />
When performing the test immediately prior to<br />
3.5.1.1(ii), it is easiest to use the envelope-wrapped film<br />
recommended for that measurement, however, a piece of<br />
paper or card can also be used. The wrapped film is<br />
placed flat on the table and illuminated by the external<br />
scan plane light. The position of the light is marked on<br />
the film envelope and the table is moved automatically<br />
to the scan plane. If the distance between the internal<br />
and external lights is correct, the internal light should<br />
now coincide with the mark on the film envelope.<br />
3.5.1.1.(ii) Co-incidence of internal scan plane<br />
lights and scan plane<br />
Pin pricks are made in a piece of therapy verification<br />
film (or similar) along the line of the internal scan plane<br />
light, and the film is exposed to a narrow axial scan and<br />
developed (figure 2). Coincidence between the pin<br />
pricks and the x-ray beam exposure indicates alignment<br />
between the internal lights and the scan plane.<br />
z<br />
x<br />
2 <strong>ImPA<strong>CT</strong></strong> Information <strong>Leaflet</strong> 1: <strong>CT</strong> <strong>Scanner</strong> Acceptance Testing
For multi-slice scanners, pin pricks (and, thus, the<br />
internal alignment light) are usually found to coincide<br />
with the centre of the four slices. To plan a scan so that<br />
the x-ray beam is centred over the internal scan plane<br />
lights at zero, it will be necessary to centre the first and<br />
last slices symmetrically around zero (e.g. four slices<br />
from –7.5 mm to +7.5 mm on a 4 x 5 mm scan).<br />
Wrapped film<br />
Pin pricks made<br />
in film at<br />
position of scan<br />
plane light<br />
Figure 2: Technique for assessing alignment of internal<br />
scan plane light to scan plane<br />
3.5.1.2 Coronal and Saggital plane lights<br />
A long, thin object, with a high <strong>CT</strong> number relative to<br />
air, such as the ‘lead’ in a pencil or a straightened paper<br />
clip, can be used as a marker to perform this test. The<br />
marker is supported above the patient table and aligned,<br />
using the indicating lights, so that it is positioned at the<br />
isocentre, parallel to the z-axis and perpendicular to the<br />
scan plane. If indicating lights are accurately aligned to<br />
the coronal and sagittal planes, the marker should appear<br />
as a dot at exactly x=0, y=0 on the axial image.<br />
z<br />
Developed film<br />
x-ray beam<br />
exposure<br />
x<br />
A ruler or tape measure placed alongside the table, as<br />
shown in figure 3, can be used to check that the degree<br />
of couch movement indicated on the gantry agrees with<br />
the actual distance moved. A load of approximately 70-<br />
80 kg should be placed on the table in order to simulate<br />
the weight of a patient. The test should be performed<br />
twice: by driving the table top both away from and<br />
towards the gantry.<br />
3.5.2.2 Axial scan incrementation accuracy<br />
Verification of incrementation accuracy between<br />
successive axial slices can be achieved by placing<br />
envelope-wrapped film on the couch (in the isocentre<br />
plane) and exposing it to an axial scan sequence. Narrow<br />
slices separated by a couch increment greater than 1<br />
slice width can be used, and the distance between the<br />
lines on the film measured.<br />
3.5.2.3 Couch travel accuracy for helical scans<br />
In helical scanning, it is not sufficient to use a simple<br />
mechanical test such as in 3.5.2.1 because the distance<br />
imaged depends on couch speed and scanner software.<br />
One method of assessing imaged distance accuracy is to<br />
use a Perspex test object containing two small radioopaque<br />
markers, separated by a fixed distance (e.g. 20<br />
cm), as shown in figure 4.<br />
Gantry<br />
Radio-opaque<br />
markers<br />
‘Patient’ load<br />
Alignment light accuracy is often assessed at the<br />
isocentre. However, in practice, the lights are more<br />
likely to be used for positioning at the surface of the<br />
patient. Therefore, it may also be useful to perform tests<br />
3.5.1.1 and 3.5.1.2 with marker displaced by e.g. 10cm<br />
from the isocentre. This could be achieved by placing it<br />
on the surface of a phantom.<br />
3.5.2 Couch travel accuracy<br />
3.5.2.1 Accuracy of distance indicator on<br />
gantry<br />
Gantry<br />
Gantry display,<br />
should indicate<br />
1m<br />
Start<br />
position<br />
marker<br />
1m ruler<br />
Direction of<br />
table top<br />
movement<br />
‘Patient’ load<br />
Figure 3: Assessment of distance indicator accuracy<br />
Table top<br />
Couch base<br />
Figure 4: Assessment of couch travel accuracy for<br />
helical scans<br />
The test object is scanned in Scan Projection<br />
Radiography (SPR) mode and a helical run is planned to<br />
start at the first marker and to end at a distance x from<br />
the first marker. If couch travel is accurate during the<br />
helical scan, the markers should be clearly seen on the<br />
first and final images of the series.<br />
3.5.4 Gantry Tilt<br />
The accuracy of displayed gantry tilt can be assessed by<br />
supporting envelope-wrapped x-ray film at the gantry<br />
end of the patient table. The film must be held vertically<br />
(e.g. by taping to a Perspex block), so that it is parallel<br />
to the sagittal plane and intersects scan and coronal<br />
planes at right angles. Three axial exposures are made<br />
using the same film: one for the maximum superior<br />
gantry tilt, one for the maximum inferior gantry tilt and a<br />
third at 0º gantry tilt. The three scan planes should then<br />
be visible on the developed film (figure 5). The angles<br />
θ + and θ - between scan planes at maximum tilt relative<br />
to that at 0º tilt should equal tilt angles displayed on the<br />
gantry.<br />
<strong>ImPA<strong>CT</strong></strong> Information <strong>Leaflet</strong> 1: <strong>CT</strong> <strong>Scanner</strong> Acceptance Testing 3
y<br />
θ-<br />
θ +<br />
X-ray<br />
beam<br />
exposure<br />
Axial slice positions<br />
Developed<br />
film<br />
Figure 5: Assessment of accuracy of gantry tilt angles<br />
displayed on the gantry<br />
3.6 Dosimetry<br />
3.6.1 Computed Tomography Dose Index<br />
in air<br />
The Computed Tomography Dose Index (<strong>CT</strong>DI) in air<br />
[10] can be measured using a 10cm pencil ionisation<br />
chamber, bisected by the scan plane at the isocentre,<br />
supported from the patient table (as shown in figure 6).<br />
The ion chamber can be supported using a retort stand<br />
and clamp, if a dedicated holder is not available.<br />
z<br />
Helical scan (pitch 1)<br />
Figure 7: Technique to obtain a helical ‘<strong>CT</strong>DI’<br />
3.6.2 Computed Tomography Dose Index<br />
in Perspex <strong>CT</strong>DI Phantoms<br />
In their specification documentation, manufacturers<br />
often quote <strong>CT</strong>DI measurements at the centre and<br />
periphery of standard Perspex (PMMA) phantoms<br />
(illustrated in figure 8). To make corresponding<br />
measurements at acceptance take care to make any<br />
appropriate conversions between methods, e.g. <strong>CT</strong>DI FDA<br />
to <strong>CT</strong>DI air : refer to [3] for more details.<br />
320 mm<br />
Insert to plug holes<br />
160 mm<br />
10 mm<br />
Figure 6: Measurement of <strong>CT</strong>DI in air<br />
When commissioning a <strong>CT</strong> scanner, it is valuable to<br />
measure the <strong>CT</strong>DI in air under the following conditions:<br />
For all beam shaping filters<br />
For all nominal slice widths<br />
For all clinical kV settings<br />
For a range of scan times<br />
For a range of mA settings<br />
An additional test is to compare the dose from a helical<br />
scan with that from an axial scan. However, a helical<br />
<strong>CT</strong>DI value cannot be measured directly, as <strong>CT</strong>DI is a<br />
single slice measurement. To obtain a relative dose for<br />
helical scanning, the entire length of the chamber can be<br />
scanned firstly in axial mode (contiguous slices) and<br />
secondly in helical mode, at pitch 1 (figure 7). The ratio<br />
of the 2 doses provides a correction factor, which can<br />
then be used to convert axial <strong>CT</strong>DIs into ‘helical<br />
<strong>CT</strong>DI’s.<br />
Scanning the chamber length with different pitches<br />
allows assessment of the variation of dose with pitch.<br />
Figure 8: Perspex (PMMA) Head and body phantoms<br />
for measurement of <strong>CT</strong>DI. Both phantoms are ≥ 140<br />
mm in z-axis length.<br />
The body phantom placed on the patient table and the<br />
head phantom is supported in the head rest. Phantoms<br />
are aligned centred at the scan isocentre. The ion<br />
chamber is inserted into either the central or one of the<br />
peripheral cavities of the phantom (all other cavities<br />
being filled with Perspex rods). Dose measurements at<br />
the centre are used to calculate the central <strong>CT</strong>DI. To<br />
obtain the periphery <strong>CT</strong>DI it is necessary to measure<br />
dose in at least four positions around the phantom, so as<br />
to achieve a true average. If gantry rotation is initiated<br />
from different angular positions for successive scans it<br />
may be necessary to take a number of measurements at<br />
each position in order to get a representative mean dose.<br />
Central and peripheral <strong>CT</strong>DI’s are used to calculate<br />
weighted <strong>CT</strong>DI, <strong>CT</strong>DI w :<br />
<strong>CT</strong>DI<br />
Head phantom<br />
w<br />
<strong>CT</strong>DI<br />
=<br />
centre<br />
Body phantom (or annulus to fit<br />
over head phantom)<br />
+ 2 × <strong>CT</strong>DI<br />
3<br />
periphery<br />
mGy<br />
4 <strong>ImPA<strong>CT</strong></strong> Information <strong>Leaflet</strong> 1: <strong>CT</strong> <strong>Scanner</strong> Acceptance Testing
<strong>CT</strong>DI w s can be compared against diagnostic reference<br />
levels for standard head and abdomen scans, quoted in<br />
[10].<br />
3.6.3 Dose Profiles (Irradiated slice width)<br />
Measurement of irradiated slice widths, for all nominal<br />
slice width settings, provides a direct test of pre-patient<br />
beam collimation functionality and allows geometric<br />
efficiencies to be calculated for the scanner.<br />
the chamber, care must be taken with regard to any nonuniformity<br />
in dose around the phantom.) Dose for<br />
helical scans can be calculated from the axial dose by<br />
applying the axial <strong>CT</strong>DI: helical <strong>CT</strong>DI correction factor<br />
(derived from in air dose measurements – see section<br />
3.6.1), divided by the pitch.<br />
Region of<br />
interest<br />
Geometric efficiency is defined as:<br />
imaged slice width<br />
Geometric Efficiency =<br />
×100%<br />
irradiated slice width<br />
It is recommended that the geometric efficiency is<br />
displayed on the console if it is less than 70% [11].<br />
Refer to section 3.7.6.1 for measurement of imaged slice<br />
width.<br />
One method of obtaining irradiated slice width<br />
measurements is to expose envelope-wrapped x-ray film,<br />
supported in air at the isocentre, at each of the slice<br />
width settings (figure 9). Once developed, optical<br />
density profiles may be plotted using a scanning<br />
microdensitometer or the width measured using a ruler.<br />
To provide an accurate dose profile, a calibration curve<br />
can be applied to convert optical density profiles into<br />
dose profiles, from which irradiated slice widths<br />
(FWHM of dose profiles) may be derived. An alternative<br />
technique is to measure dose profiles using TLD’s.<br />
x-ray beam<br />
exposure<br />
Developed<br />
film<br />
Figure 9: Measurement of irradiated slice widths for a<br />
range of nominal slice width settings<br />
3.7 Imaging performance<br />
3.7.1 Noise<br />
Noise is generally assessed using cylindrical phantoms,<br />
which are either filled with water or made of a tissue<br />
equivalent material. Once an axial image of the phantom<br />
has been acquired, noise is obtained from the standard<br />
deviation in <strong>CT</strong> number in a region of interest placed<br />
centrally within the image (figure 10).<br />
Noise figures given in manufacturers’ specifications are<br />
quoted for a specific phantom (e.g. manufacturer’s QA<br />
phantom) and for specified scan parameters. These<br />
conditions must be matched exactly for the purposes of<br />
the acceptance test. Manufacturers often quote noise at a<br />
particular surface dose. If this is the case, dose for axial<br />
scans can be measured by taping an ion chamber to the<br />
surface of the phantom. (When selecting the position of<br />
Figure 10: Axial image of a homogenous phantom used<br />
for the assessment of noise<br />
Baseline noise values should be obtained for several<br />
scan protocols that will be used clinically, using the<br />
routine QC noise phantom.<br />
To ensure that noise figures are both accurate and<br />
representative, it is essential to find the mean value from<br />
several scans. (<strong>ImPA<strong>CT</strong></strong> calculates the mean noise from<br />
10 scans.)<br />
An additional test for multi-slice scanners is to compare<br />
the noise for each of the images acquired in a single<br />
axial rotation. Differences in noise between images<br />
could indicate some degree of misalignment within the<br />
x-ray target / collimation / detector array system and / or<br />
differences in sensitivity of the parallel banks of<br />
detectors<br />
3.7.2 <strong>CT</strong> Number Uniformity<br />
<strong>CT</strong> number uniformity can be assessed at the same time<br />
as measuring noise, by placing four additional regions of<br />
interest (N, E, S and W) at positions near the edge of the<br />
image of a uniform phantom (figure 11). Mean <strong>CT</strong><br />
number is then noted for these four regions, as well as<br />
the central one. The deviation from the central value<br />
should be calculated. It can be valuable to check <strong>CT</strong><br />
number uniformity for large fields of view<br />
.Figure 11: Axial image of a homogenous phantom used<br />
for the assessment of <strong>CT</strong> number uniformity<br />
<strong>ImPA<strong>CT</strong></strong> Information <strong>Leaflet</strong> 1: <strong>CT</strong> <strong>Scanner</strong> Acceptance Testing 5
3.7.3 <strong>CT</strong> Number Linearity<br />
<strong>CT</strong> number linearity is assessed using a phantom<br />
containing inserts of a number of different materials. For<br />
a comprehensive linearity test, insert materials should<br />
cover a wide range of <strong>CT</strong> numbers. One example of a<br />
suitable phantom to use at acceptance is the Catphan<br />
(The Phantom Laboratory, Salem, NY,<br />
www.phantomlab.com), which contains four inserts with<br />
<strong>CT</strong> numbers ranging from approximately -1000HU to<br />
+1000HU (figure 12). For commissioning tests, it is<br />
important to use the same phantom as that available for<br />
subsequent routine QC.<br />
Teflon<br />
( ≈ 990HU)<br />
Acrylic ( ≈ 120HU)<br />
Air ( ≈ -1000HU)<br />
Low Density<br />
Polyethylene<br />
( ≈ -90HU)<br />
Figure 12: Phantom for the assessment of <strong>CT</strong> number<br />
linearity<br />
3.7.4 Low contrast resolution<br />
Low contrast resolution (or low contrast detectability) is<br />
often quoted in specification documentation, as the<br />
smallest visible object at a given contrast for a given<br />
dose. Since this measurement relates directly to imaging<br />
performance, it is an important parameter to verify at<br />
acceptance.<br />
The phantom and scan settings selected for the<br />
acceptance test will depend on those used by the<br />
manufacturer in the scanner specification. Common<br />
phantoms are the low contrast resolution (LCR) insert in<br />
the Catphan and the ATS insert of the AAPM phantom.<br />
Figure 13 shows a typical image of the Catphan LCR<br />
insert.<br />
At least 20 images of the low contrast insert should be<br />
acquired and then viewed by at least 3 observers under<br />
optimal viewing conditions, so as to obtain an average.<br />
The dose should be measured using an equivalent<br />
technique to that quoted in the manufacturer’s<br />
specification<br />
During commissioning, it may be useful to assess low<br />
contrast resolution for a number of clinical scan<br />
protocols, but only if further assessment of this<br />
parameter is planned for routine QC. It could be argued<br />
that low contrast measurements on a routine basis are<br />
not necessary since they are limited largely by random<br />
noise, which is assessed independently.specification, e.g.<br />
by placing the ion chamber on the surface of the<br />
phantom (taking care to consider any non-uniformity in<br />
dose around the phantom).<br />
Figure 13: Typical image of the Catphan LCR insert<br />
3.7.5 Spatial resolution<br />
High contrast spatial resolution can be measured using a<br />
number of techniques. These can be broadly split into<br />
two categories: those involving analysis of the point<br />
spread function, usually by calculation of the modulation<br />
transfer function (MTF), and those involving either<br />
objective analysis or visual assessment of images of a<br />
resolution bar phantom.<br />
The resolution is quoted as the spatial frequency (in line<br />
pairs / cm) at which the modulation falls to 50%, 10% or<br />
2% MTF. They also quote the limiting resolution<br />
(calculated from the 0% MTF) in mm. These figures are<br />
often given for more than one reconstruction algorithm,<br />
e.g. for standard and high-resolution scans.<br />
Figure 14: Bar phantom image from the Catphan<br />
When performing acceptance or commissioning tests,<br />
visual assessment of bar phantom images, such as that<br />
shown in figure 14, is often sufficient. The number of<br />
line pairs per cm just visible in the image is<br />
approximately equivalent to the 2% value of the MTF.<br />
This result can then be compared with the 2% MTF, if<br />
this is quoted in the manufacturer’s specification. To<br />
fulfil the requirements of acceptance, resolution should<br />
be measured for all scan settings and reconstruction<br />
algorithms quoted in the specification. For<br />
commissioning, it should be evaluated for a range of<br />
local clinical scan protocols.<br />
6 <strong>ImPA<strong>CT</strong></strong> Information <strong>Leaflet</strong> 1: <strong>CT</strong> <strong>Scanner</strong> Acceptance Testing
3.7.6 Z-sensitivity (imaged slice width)<br />
3.7.6.1 Axial mode measurements<br />
Phantoms used for axial measurements may contain thin<br />
metal plates (figure 15), wires or arrays of air holes,<br />
inclined at an angle to the image plane.<br />
Phantom<br />
and the FWHM of the profile is measured to obtain the<br />
imaged slice width.<br />
Tungsten<br />
disc<br />
Perspex<br />
x<br />
x-ray beam<br />
Metal plates<br />
Figure 15: Plan view of a test object used to measure<br />
imaged slice widths for axial scans<br />
Manufacturers should be able to supply an appropriate<br />
phantom or, alternatively, the Catphan contains an insert<br />
suitable for this test. A point to note here is that, in order<br />
to obtain meaningful measurements, the thickness of the<br />
plates, wires or holes cannot be greater than the nominal<br />
slice width concerned. This criterion may pose problems<br />
for the sub-millimetre slice widths offered on multi-slice<br />
scanners. <strong>ImPA<strong>CT</strong></strong> has developed a test object with thin<br />
plates for measuring sub-millimetre slices.<br />
Manufacturers may quote the tolerance for each nominal<br />
slice width setting in their specification documentation.<br />
Z-sensitivity measurements in axial mode can be used to<br />
check that imaged slice widths are within the tolerances<br />
given. They can also be used in conjunction with<br />
irradiated slice width measurements to assess the<br />
accuracy of post patient collimation and to calculate the<br />
geometric efficiency for the scanner (see section 3.6.3<br />
Dose Profiles).<br />
Z-sensitivity profiles for each of the images acquired in<br />
a single axial rotation for multi-slice scanners can be<br />
compared. Differences in these profiles between images<br />
could indicate misalignment within the x-ray target /<br />
collimation / detector array system and/or differences in<br />
sensitivity of the parallel banks of detectors<br />
z<br />
Figure 16: <strong>ImPA<strong>CT</strong></strong>’s helical z-sensitivity phantom<br />
Helical imaged slice widths could potentially be affected<br />
by software changes to the system and changes to the<br />
table speed. They should be measured at acceptance, but<br />
need only be re-measured after software upgrades. A<br />
typical set of measurements could use a set slice width<br />
(e.g. 5mm), for a range of pitch and interpolation<br />
algorithm combinations.<br />
3.7.7 Artefacts<br />
Although a potentially important area to test, there are<br />
currently no phantoms generally available that are<br />
dedicated to the assessment of artefacts.<br />
The presence of artefacts can be assessed subjectively<br />
throughout an acceptance test. Ring artefacts, for<br />
example, should be apparent on noise images when<br />
using a narrow window width. Use of the largest noise<br />
phantom, with a body FOV, allows a greater number of<br />
detectors to be evaluated.<br />
3.7.8 Accuracy of distance measurements<br />
3.7.8.1 Axial scans<br />
The accuracy of distance measurements made on axial<br />
images can be assessed using a phantom that contains<br />
high contrast markers separated by known distances in x<br />
and y (Lateral and PA/AP) directions. The phantom<br />
alignment insert of the Catphan is one test object that is<br />
suitable for this test. This insert contains four rods,<br />
oriented along the z-axis, separated by 50mm, which<br />
should appear in the image as shown in figure 17.<br />
Measured distances between pairs of rods in the image<br />
should equal 50mm.<br />
3.7.6.2 Helical mode measurements<br />
Appropriate phantoms for helical measurements contain<br />
Post<br />
either a high contrast bead of sub-millimetre diameter or<br />
a high contrast disc of sub-millimetre thickness.<br />
50mm<br />
Manufacturers’ phantoms may include a suitable insert.<br />
= =<br />
<strong>ImPA<strong>CT</strong></strong>’s phantom for helical scans (figure 16)<br />
contains a tungsten disc (6mm diameter, 0.05mm thick)<br />
Right<br />
50mm Left<br />
sandwiched within a Perspex rod.<br />
= =<br />
Axial images are reconstructed at suitable intervals (e.g.<br />
A<br />
one-tenth of the nominal slice width) along a helical<br />
scan of the test object and the <strong>CT</strong> number in a central<br />
region of each image is recorded. <strong>CT</strong> number is plotted<br />
Ant<br />
against z-axis position to obtain a <strong>CT</strong> number profile,<br />
Figure 17: Image of the Catphan phantom alignment<br />
insert<br />
<strong>ImPA<strong>CT</strong></strong> Information <strong>Leaflet</strong> 1: <strong>CT</strong> <strong>Scanner</strong> Acceptance Testing 7
3.7.8.2 Scan Projection Radiography (SPR)<br />
mode<br />
The accuracy of distance measurements in SPR mode<br />
can be assessed using any phantom that contains high<br />
contrast markers separated by a known distance in the x<br />
ad z-directions. Leeds test object M1, which contains a<br />
wire grid, is one example of a suitable phantom for this<br />
test (figure 18). By supporting this test object flat on the<br />
patient table at the isocentre and performing a PA or AP<br />
SPR scan, the following type of image is obtained:<br />
Right<br />
Sup<br />
Inf<br />
Left<br />
Figure 18: Leeds test object M1<br />
The distances between the outermost wires visible on the<br />
image are measured in both superior-inferior and lateral<br />
dimensions. These distances should equal the actual<br />
separations of the wires within the phantom.<br />
3.7 Other measurements<br />
Fundamental scanner features, such as focal spot size,<br />
half value layer (HVL) and kV accuracy should ideally<br />
be evaluated when commissioning a scanner, since the<br />
baseline data acquired can aid later fault diagnosis<br />
during routine Quality Control. For example, if there are<br />
discrepancies between measured and specified <strong>CT</strong>DI<br />
values, HVL measurements may be helpful in explaining<br />
the reason for the discrepancy. Methods for<br />
measurement of these parameters are covered in [3].<br />
As part of acceptance testing, it could be argued that<br />
assessment of these parameters is low priority, certainly<br />
in the first instance, since any problems with them<br />
should be apparent in other measurements, such as <strong>CT</strong>DI<br />
and spatial resolution.<br />
Testing of scanner software packages is another area that<br />
should be considered – as software becomes more<br />
advanced and specialised, the potential for errors in<br />
measurements provided by that software increases. This<br />
area is beyond the scope of this leaflet, but should not be<br />
ignored.<br />
4. References<br />
1. The Ionising Radiations Regulations 1999 SI<br />
1999/3232 Stationary Office 1999 ISBN 0 11<br />
085614 7<br />
2. Department of Health 2000 Ionising Radiation<br />
(Medical Exposure) Regulations Statutory<br />
Instrument 2000 No. 1059 (Her Majesty’s<br />
Stationary Office, London)<br />
3. Measurement of the Performance Characteristics<br />
of Diagnostic X-ray Systems Used in Medicine,<br />
Part III, Computed Tomography X-ray <strong>Scanner</strong>s.<br />
Diagnostic Radiology Topic Group Report No. 32<br />
(2001)<br />
4. Recommended Standards for the Routine<br />
Performance Testing of Diagnostic X-Ray<br />
Imaging Systems. IPEM Report No. 77 (1997)<br />
5. International Standard IEC 60601-1:1988.<br />
Medical electrical equipment – Part 1: General<br />
requirements for safety, and amendments 1<br />
(1991) and 2 (1995)<br />
6. Department of Health and Social Security. TRS<br />
89. Technical Requirements for the Supply and<br />
Installation of Apparatus for Diagnostic Imaging<br />
and Radiotherapy (1989)<br />
7. International Standard IEC 60601-2-32:1994.<br />
Medical electrical equipment – Part 2: Particular<br />
requirements for the safety of associated<br />
equipment of X-ray equipment<br />
8. Medical Devices Agency 1995 Guidance on the<br />
safe use of lasers in medical and dental practice.<br />
ISBN 1858394880 (Medical Devices Agency,<br />
Hannibal House, Elephant and Castle, London<br />
SE1 6TQ)<br />
9. The Critical Examination of X-ray Generating<br />
Equipment in Diagnostic Radiology. IPEM<br />
Report No. 79 (1998)<br />
10. European Commission. Quality Criteria for<br />
Computed Tomography. EUR 16262 EN Brussels<br />
(1999)<br />
11. International Standard IEC 60601-2-44:1999, Ed.<br />
1. Medical electrical equipment – Part 2-44:<br />
Particular requirements for the safety of X-ray<br />
equipment for computed tomography<br />
<strong>ImPA<strong>CT</strong></strong> is the UK’s national <strong>CT</strong> evaluation centre, providing publications, information and advice on all aspects of <strong>CT</strong><br />
scanning. Funded by the Medical Devices Agency, it is part of a comprehensive medical imaging device evaluation<br />
programme.<br />
<strong>ImPA<strong>CT</strong></strong><br />
Bence Jones Offices<br />
St George’s Hospital<br />
London SW17 0QT<br />
Tel: +44 (0)20 8208 3366, Fax: +44 (0)20 8725 3969<br />
e-mail: impact@impactscan.org<br />
www.impactscan.org<br />
© <strong>ImPA<strong>CT</strong></strong> 2001<br />
8 <strong>ImPA<strong>CT</strong></strong> Information <strong>Leaflet</strong> 1: <strong>CT</strong> <strong>Scanner</strong> Acceptance Testing