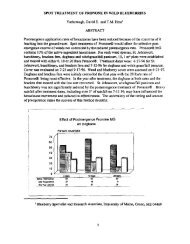
Vol. 51â1997 - NorthEastern Weed Science Society
Vol. 51â1997 - NorthEastern Weed Science Society
Vol. 51â1997 - NorthEastern Weed Science Society

Create successful ePaper yourself
Turn your PDF publications into a flip-book with our unique Google optimized e-Paper software.
194<br />
Who is going to provide the education and training in weed science to all of the future<br />
researchers, students in agriculture, county agents, crop consultants, ag chern. personnel,<br />
distributors, sales staff, the 1 million certified applicators and the people that work for them; now<br />
and in the f ture? Especially in this time when pesticide applications are being so closely monitored<br />
and controlled; and all applicators, including university research personnel, must be trained, licensed<br />
and attend t pdate training sessions to maintain their licenses.<br />
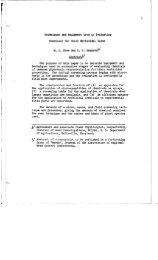
Table 1. In portance of pesticide expenditures to farmers (4,5,6). Excludes wood preservatives and<br />
di infectants.<br />
1984<br />
1988<br />
1993<br />
Total farm roduction expenditures $140.0 bit.<br />
$132.0 bit.<br />
$147.0 bil<br />
Farm pestic de expenditure<br />
4.8<br />
5.1<br />
6.1<br />
Percent<br />
3.4%<br />
3.9%<br />
4.2%<br />
Table 2. U er expenditures for pesticides in the U.S.(millions of dollars) (4,5,6).<br />
Herbicides<br />
Insecticides<br />
Fungicides<br />
1983 1988 1993 1983 1988 1993 1983 1988 1993<br />
Agriculture<br />
2800 3080 3987 1300 1110 1248 450 775 895<br />
Ind.lComrr .IGovt. 600 500 550 300 440 427 120 200 159<br />
Home/Gare en 250 350 219 500 660 875 98 125 124<br />
Total<br />
3650 3930 4756 2100 2210 2550 668 1100 1178<br />
Percent<br />
57 54 56 33 31 30 10 13 14<br />
Table 3. P sticide use in the U.S. (million pounds a.i.) (1,3,4,5,6). Data for 1964 and 1971 are for<br />
rr ajor agronomic field crops. For later years, pesticides used in fruits and vegetables are<br />
included, If pesticide use on rights-of-way were included the percentage of pesticide use<br />
that was herbicides would be even higher.<br />
Year Herbicides % Insecticidesk % Fungicide~ % Total<br />
1964 71 37 117 60 6 3 194<br />
1971 213 61 128 37 6 2 347<br />
1983 575 63 255 28 78 9 908<br />
1984 675 66 270 26 80 8 1025<br />
1988 660 62 268 25 132 13 1060<br />
1993 620 62 247 25 131 13 998<br />
11Includes miticides and nematicides<br />
'l/ Does no include wood preservatives<br />
Table 4. Festicide use in the U.S. by type and market sectors (million pounds a.i.) (4,5,6).<br />
Herbicides Insecticides Fungicides<br />
Agricultnn<br />
Ind.lComr l.lGoVt.<br />
Home/Gar Ien<br />
Total<br />
Percent<br />
1983 1988 1993 1983 1988 1993 1983 1988 1993<br />
445 510 481 185 185 171 103 150 159<br />
105 120 112 40 45 44 20 40 41<br />
25 30 27 30 38 32 10 12 14<br />
575 660 620 255 268 247 133 202 214<br />
60 58 57 26 24 23 14 18 20