Prob & Stats 2 OCR Past Papers - The Grange School Blogs
Prob & Stats 2 OCR Past Papers - The Grange School Blogs
Prob & Stats 2 OCR Past Papers - The Grange School Blogs

You also want an ePaper? Increase the reach of your titles
YUMPU automatically turns print PDFs into web optimized ePapers that Google loves.
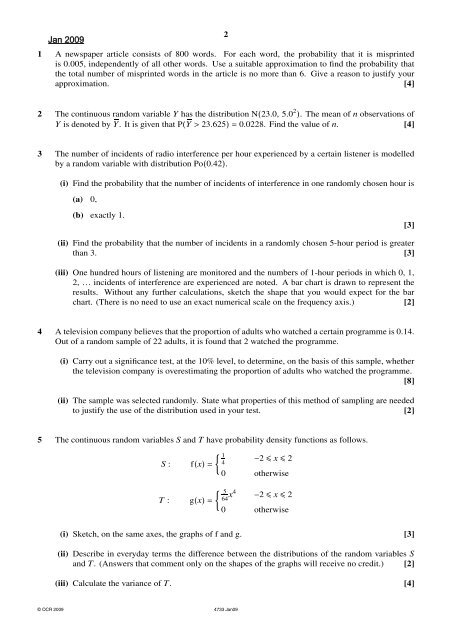
Jan 2009<br />
2<br />
1 A newspaper article consists of 800 words. For each word, the probability that it is misprinted<br />
is 0.005, independently of all other words. Use a suitable approximation to find the probability that<br />
the total number of misprinted words in the article is no more than 6. Give a reason to justify your<br />
approximation. [4]<br />
2 <strong>The</strong> continuous random variable Y has the distribution N(23.0, 5.0 2 ). <strong>The</strong> mean of n observations of<br />
Y is denoted by Y. It is given that P(Y > 23.625) = 0.0228. Find the value of n. [4]<br />
3 <strong>The</strong> number of incidents of radio interference per hour experienced by a certain listener is modelled<br />
by a random variable with distribution Po(0.42).<br />
(i) Find the probability that the number of incidents of interference in one randomly chosen hour is<br />
(a) 0,<br />
(b) exactly 1.<br />
[3]<br />
(ii) Find the probability that the number of incidents in a randomly chosen 5-hour period is greater<br />
than 3. [3]<br />
(iii) One hundred hours of listening are monitored and the numbers of 1-hour periods in which 0, 1,<br />
2, … incidents of interference are experienced are noted. A bar chart is drawn to represent the<br />
results. Without any further calculations, sketch the shape that you would expect for the bar<br />
chart. (<strong>The</strong>re is no need to use an exact numerical scale on the frequency axis.) [2]<br />
4 A television company believes that the proportion of adults who watched a certain programme is 0.14.<br />
Out of a random sample of 22 adults, it is found that 2 watched the programme.<br />
(i) Carry out a significance test, at the 10% level, to determine, on the basis of this sample, whether<br />
the television company is overestimating the proportion of adults who watched the programme.<br />
[8]<br />
(ii) <strong>The</strong> sample was selected randomly. State what properties of this method of sampling are needed<br />
to justify the use of the distribution used in your test. [2]<br />
5 <strong>The</strong> continuous random variables S and T have probability density functions as follows.<br />
S :<br />
1<br />
f(x) = { 4<br />
−2 ≤ x ≤ 2<br />
0 otherwise<br />
5<br />
T : g(x) = { 64 x4 −2 ≤ x ≤ 2<br />
0 otherwise<br />
(i) Sketch, on the same axes, the graphs of f and g. [3]<br />
(ii) Describe in everyday terms the difference between the distributions of the random variables S<br />
and T. (Answers that comment only on the shapes of the graphs will receive no credit.) [2]<br />
(iii) Calculate the variance of T. [4]<br />
© <strong>OCR</strong> 2009 4733 Jan09