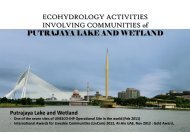
putrajaya lake
putrajaya lake
putrajaya lake

You also want an ePaper? Increase the reach of your titles
YUMPU automatically turns print PDFs into web optimized ePapers that Google loves.
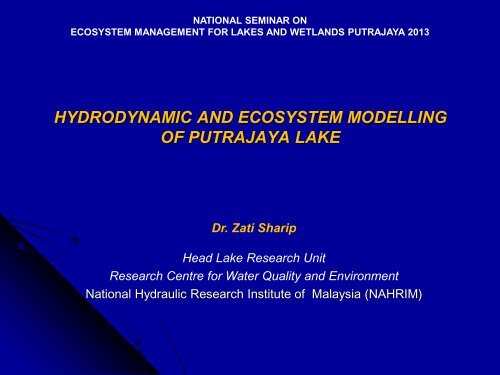
NATIONAL SEMINAR ON<br />
ECOSYSTEM MANAGEMENT FOR LAKES AND WETLANDS PUTRAJAYA 2013<br />
HYDRODYNAMIC AND ECOSYSTEM MODELLING<br />
OF PUTRAJAYA LAKE<br />
Dr. Zati Sharip<br />
Head Lake Research Unit<br />
Research Centre for Water Quality and Environment<br />
National Hydraulic Research Institute of Malaysia (NAHRIM)
Zati Sharip 1 , Normaliza Noordin 2 , Jarina M.Saman 2 ,<br />
Saim Suratman 1 , Ahmad Jamalluddin Shaaban 1 & Akashah Hj Majizat 2<br />
1<br />
National Hydraulic Research Institute of Malaysia (NAHRIM)<br />
2<br />
Lake and Wetland Unit, Putrajaya Corporation
Outlines<br />
• Introduction<br />
• Description of the Putrajaya Lake<br />
• Objectives<br />
• Materials and method<br />
• Data Collection<br />
• Model set up and simulation<br />
• Results<br />
• Summary
Malaysia’s administrative Centre<br />
Photo: Perbadanan Putrajaya<br />
PUTRAJAYA LAKE<br />
A scenic and self-sustaining ecosystem for<br />
recreation, sports and tourism
PUTRAJAYA LAKE AND WETLANDS<br />
• Part of Langat River<br />
Basin<br />
Langat River<br />
• Catchment area 51.0<br />
km 2<br />
• 56% discharges<br />
into wetlands<br />
• 44% flows directly<br />
into <strong>lake</strong>
THE PUTRAJAYA LAKE<br />
• Surface area of<br />
400 hectares<br />
• An average depth<br />
of 6.6 m<br />
• Mean hydraulic<br />
retention time of<br />
132 days<br />
Natural filtration system<br />
Source: Perbadanan Putrajaya
Challenges<br />
• Increasing development & land use<br />
changes<br />
• Vulnerable to pollution<br />
• The need to retain <strong>lake</strong> water quality at<br />
high standard<br />
‣ Integrated catchment management<br />
‣ Continuous environmental monitoring<br />
‣ Development of Ecosystem model
Objectives<br />
• To understand the ecohydrological<br />
dynamic for<br />
sustainable management of<br />
these urban water-bodies<br />
• To monitor the aquatic<br />
environment response to the<br />
increasing development and<br />
land-use changes, coupled<br />
with climate variations
Methodology<br />
Field Data:<br />
Meteorological, flow, Bathymetry<br />
Hydrodynamic model<br />
Ecosystem model<br />
Field data:<br />
Water quality, biological<br />
Calibration and verification<br />
Analysis
Data Collection<br />
Weather monitoring station<br />
Rainfall station<br />
Flow Measurement<br />
Water level Measurement<br />
Presint 13<br />
Presint 11<br />
Presint 1<br />
Presint 7<br />
Presint 2<br />
• Weather and rainfall<br />
monitoring<br />
Dam<br />
• Water level and flow<br />
measurement
Data Collection<br />
Biological Measurement<br />
WQ Measurement<br />
Diurnal WQ Measurement<br />
• Water quality measurement<br />
(monthly, bi-weekly, diurnal)<br />
Seri Wawasan<br />
Brudge<br />
Seri<br />
Bistari<br />
Bridge<br />
Photo: Perbadanan Putrajaya<br />
• Biological surveys<br />
Dam<br />
Photo: Perbadanan Putrajaya
Model set-up and assumptions<br />
• Lake shoreline and depth<br />
data - bathymetry survey<br />
• Complex morphology<br />
• Depth varies from ~ 3m<br />
(upstream) to ~14 m<br />
(downstream)<br />
0 305 610 m
Model set-up and assumptions<br />
• Grid size 100m x 100m<br />
• Inflow estimation based on<br />
designed flow ratio<br />
• Exclusion of groundwater<br />
exchange<br />
• Simulation period – dry<br />
season
Model Coupling<br />
Hydrodynamic Model<br />
Scalar transport<br />
Thermodynamics<br />
Boundary Conditions<br />
Initial Conditions<br />
Ecosystem Model<br />
Water Quality<br />
Biochemical<br />
parameters
Results<br />
Wind speed<br />
(m/s)<br />
Rainfall (mm)<br />
Air T (oC)<br />
6<br />
4<br />
2<br />
0<br />
07/05 17/05 27/05 06/06 16/06 26/06 06/07 16/07 26/07 05/08<br />
40<br />
20<br />
0<br />
07/05 17/05 27/05 06/06 16/06 26/06 06/07 16/07 26/07 05/08<br />
40<br />
30<br />
20<br />
07/05 17/05 27/05 06/06 16/06 26/06 06/07 16/07 26/07 05/08<br />
• Low wind<br />
speed<br />
• Low <strong>lake</strong><br />
inflow<br />
• High solar<br />
radiation<br />
Humidity (%)<br />
100<br />
50<br />
0<br />
07/05 17/05 27/05 06/06 16/06 26/06 06/07 16/07 26/07 05/08<br />
30<br />
Solar radiation<br />
(MJ/m2)<br />
20<br />
10<br />
0<br />
07/05 17/05 27/05 06/06 16/06 26/06 06/07 16/07 26/07 05/08
Diurnal variation<br />
a) Seri Bistari Bridge<br />
(a)<br />
T (oC)<br />
32<br />
31<br />
30<br />
0.3 m<br />
2.1 m<br />
4.4 m<br />
DO (mg/L)<br />
8<br />
6<br />
4<br />
0.3 m 2.1 m 4.4.m<br />
12:00 00:00 12:00<br />
2<br />
12:00 00:00 12:00<br />
b) Seri Wawasan Bridge<br />
(b)<br />
T (oC)<br />
32<br />
31<br />
30<br />
0.3 m<br />
2.2 m<br />
4.6 m<br />
12:00 00:00 12:00<br />
DO (mg/L)<br />
8<br />
6<br />
4<br />
2<br />
0.3 m 2.2 m 4.6 m<br />
12:00 00:00 12:00<br />
32<br />
0.3 m<br />
5.5 m<br />
8<br />
0.3 m 5.5 m 11.0 m<br />
c) Dam<br />
(c)<br />
T (oC)<br />
31<br />
30<br />
11.0 m<br />
DO (mg/L)<br />
6<br />
4<br />
12:00 00:00 12:00<br />
2<br />
12:00 00:00 12:00
Results<br />
• Water quality levels comply with the Class IIB<br />
requirement<br />
• Some parameters exceed the Putrajaya Lake and<br />
Wetlands Water Quality Standards<br />
• chlorophyll, total coliform and ammoniacal-N<br />
• TSI – Mesotrophic; TP
Results<br />
T (deg C)<br />
T (deg C)<br />
32<br />
31<br />
30<br />
04:48 09:36 14:24 19:12 00:00 04:48 09:36<br />
32<br />
31<br />
30<br />
04:48 09:36 14:24 19:12 00:00 04:48 09:36<br />
Reasonably matched<br />
between simulated and<br />
observed variables<br />
•Temperature<br />
•DO<br />
T (deg C)<br />
32<br />
31<br />
30<br />
04:48 09:36 14:24 19:12 00:00 04:48 09:36
Results<br />
Dissolved oxygen<br />
Phytoplankton<br />
Distribution of water quality during initial condition
Results<br />
High-wind event<br />
• South-west<br />
Simulated velocity under different wind condition
Results<br />
• Convective motion<br />
• Differential<br />
cooling<br />
Low-wind event<br />
Simulated velocity under different wind condition
Results<br />
High-wind event<br />
Low-wind event<br />
Simulated DO and phytoplankton under different wind condition
Summary<br />
• Coupled hydrodynamic and ecosystem modeling<br />
• Guide intensive and coordinated data collection<br />
program<br />
• Provide understanding on the eco-hydrological<br />
dynamic in <strong>lake</strong>s<br />
• Useful to monitor the aquatic environment<br />
response to the increasing development and landuse<br />
changes, coupled with climate variations
Way forward<br />
‣ Long-term simulation & validation<br />
‣ Continuous & intensive data<br />
‣ Model simulation to predict pollution scenarios<br />
and recommend mitigation program
Thank you<br />
For further details:<br />
Dr. Zati Sharip<br />
Lake Research Unit<br />
Research Centre for Water Quality and Env.<br />
National Hydraulic Research Institute of Malaysia<br />
Lot 5377, Jalan Putra Permai<br />
43300 Seri Kembangan, Selangor<br />
Email: zati@nahrim.gov.my<br />
Hj. Akashah Majizat<br />
Lake and Wetland Unit<br />
Putrajaya Corporation,<br />
24 Lebuh Perdana, Presint 3,<br />
62675 Putrajaya, Malaysia<br />
Email: akashah@ppj.gov.my