A Performance Analysis System for the Sport of Bowling
A Performance Analysis System for the Sport of Bowling
A Performance Analysis System for the Sport of Bowling

You also want an ePaper? Increase the reach of your titles
YUMPU automatically turns print PDFs into web optimized ePapers that Google loves.
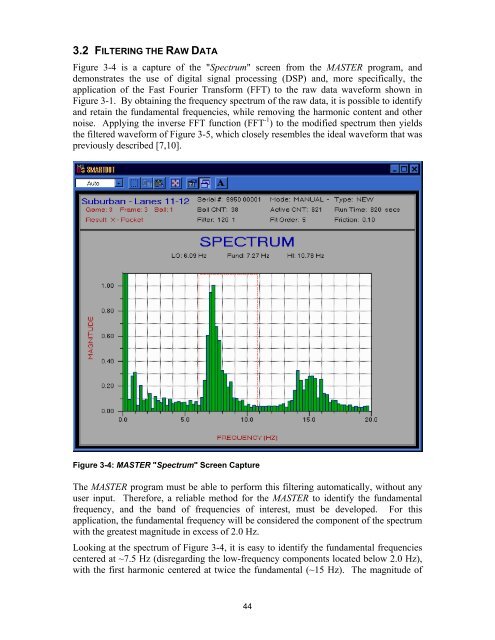
3.2 FILTERING THE RAW DATA<br />
Figure 3-4 is a capture <strong>of</strong> <strong>the</strong> "Spectrum" screen from <strong>the</strong> MASTER program, and<br />
demonstrates <strong>the</strong> use <strong>of</strong> digital signal processing (DSP) and, more specifically, <strong>the</strong><br />
application <strong>of</strong> <strong>the</strong> Fast Fourier Trans<strong>for</strong>m (FFT) to <strong>the</strong> raw data wave<strong>for</strong>m shown in<br />
Figure 3-1. By obtaining <strong>the</strong> frequency spectrum <strong>of</strong> <strong>the</strong> raw data, it is possible to identify<br />
and retain <strong>the</strong> fundamental frequencies, while removing <strong>the</strong> harmonic content and o<strong>the</strong>r<br />
noise. Applying <strong>the</strong> inverse FFT function (FFT -1 ) to <strong>the</strong> modified spectrum <strong>the</strong>n yields<br />
<strong>the</strong> filtered wave<strong>for</strong>m <strong>of</strong> Figure 3-5, which closely resembles <strong>the</strong> ideal wave<strong>for</strong>m that was<br />
previously described [7,10].<br />
Figure 3-4: MASTER "Spectrum" Screen Capture<br />
The MASTER program must be able to per<strong>for</strong>m this filtering automatically, without any<br />
user input. There<strong>for</strong>e, a reliable method <strong>for</strong> <strong>the</strong> MASTER to identify <strong>the</strong> fundamental<br />
frequency, and <strong>the</strong> band <strong>of</strong> frequencies <strong>of</strong> interest, must be developed. For this<br />
application, <strong>the</strong> fundamental frequency will be considered <strong>the</strong> component <strong>of</strong> <strong>the</strong> spectrum<br />
with <strong>the</strong> greatest magnitude in excess <strong>of</strong> 2.0 Hz.<br />
Looking at <strong>the</strong> spectrum <strong>of</strong> Figure 3-4, it is easy to identify <strong>the</strong> fundamental frequencies<br />
centered at ~7.5 Hz (disregarding <strong>the</strong> low-frequency components located below 2.0 Hz),<br />
with <strong>the</strong> first harmonic centered at twice <strong>the</strong> fundamental (~15 Hz). The magnitude <strong>of</strong><br />
44