Using Venn Diagrams to depict compare/ contrast relationships
Using Venn Diagrams to depict compare/ contrast relationships
Using Venn Diagrams to depict compare/ contrast relationships

Create successful ePaper yourself
Turn your PDF publications into a flip-book with our unique Google optimized e-Paper software.
MAKES SENSE HOME<br />
GRAPHIC ORGANIZERS HOME<br />
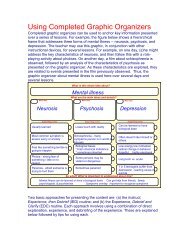
Compare/Contrast graphic organizers<br />
Compare/Contrast graphic organizers <strong>depict</strong> basic <strong>relationships</strong> between two or<br />
three major concepts are designed <strong>to</strong> help the learner understand similarities<br />
and/or differences between them. There is a wide variety of formats for <strong>depict</strong>ing<br />
<strong>compare</strong>/<strong>contrast</strong> <strong>relationships</strong>. This book features <strong>Venn</strong> <strong>Diagrams</strong>, Main Idea<br />
Comparison Frames, Semantic Features Analysis Charts, Induction Matrixes and<br />
Synetic Charts. Since graphs and charts are an excellent way <strong>to</strong> <strong>depict</strong><br />
<strong>compare</strong>/<strong>contrast</strong> <strong>relationships</strong> when quantity is of concern, these have been<br />
included as well.<br />
<strong>Using</strong> <strong>Venn</strong><br />
<strong>Diagrams</strong> <strong>to</strong><br />
<strong>depict</strong> <strong>compare</strong>/<br />
<strong>contrast</strong><br />
<strong>relationships</strong><br />
<strong>Venn</strong> diagrams are excellent<br />
devices for helping students<br />
distinguish between shared<br />
and non-shared, inclusive<br />
versus unique, and so forth<br />
characteristics of two or three<br />
concepts. They work best when two concepts are <strong>compare</strong>d (e.g., the two circle<br />
<strong>Venn</strong> diagram).<br />
While other <strong>compare</strong>/<strong>contrast</strong> graphics very effectively address the comparison<br />
of hierarchic information (e.g., the comparing of main ideas and supporting<br />
details of two or three concepts), <strong>Venn</strong> diagrams are not the best devices for this<br />
type of information. <strong>Venn</strong>s work best when the information is discrete, but not<br />
hierarchically structured.<br />
When students are constructing <strong>Venn</strong> diagrams, they often focus initially on<br />
differences between two concepts, and indicate them first on the <strong>Venn</strong> diagram.<br />
Differences between two concepts tend <strong>to</strong> be very specific. When these are<br />
exhausted, they usually then turn <strong>to</strong> analyzing similarities. Often, more general<br />
features are identified in this category. For example, in the <strong>Venn</strong> diagram<br />
illustrated below comparing endocrine and exocrine systems, the differences<br />
listed were very specific. The similarities listed, on the other hand, tended <strong>to</strong> be
much more general statements (e.g., they are both types of glands, they both<br />
secrete substances necessary for organs <strong>to</strong> function, etc.).<br />
Biology example<br />
The <strong>Venn</strong> Diagram could be used <strong>to</strong> facilitate understanding of similarities and<br />
differences between different species<br />
“see” via sonic<br />
waves<br />
Bats<br />
Fur & leather<br />
Mouth with teeth<br />
Awake at night<br />
Sleep hanging<br />
upside down<br />
Babies born<br />
alive<br />
Wings<br />
Fly<br />
Eat insects<br />
Claws<br />
Eyes/Ears<br />
Birds<br />
Feathers<br />
“see” via eyes<br />
Beaks<br />
Awake during<br />
daylight<br />
Sleep sitting<br />
up<br />
Babies<br />
from eggs
Additional science example<br />
Icebergs<br />
Begin on land as<br />
glacier formed from<br />
snowflakes<br />
Very slow formation<br />
Take hundreds or thousands<br />
of years <strong>to</strong> form<br />
May have boulders, rocks &<br />
gravel frozen in them<br />
Chunks break off & fall<br />
in<strong>to</strong> water<br />
Edge: crisp sharp.<br />
jagged<br />
Bulk is below water<br />
Roll over<br />
unexpectedly<br />
Moves by wind &<br />
ocean currents<br />
Float in ocean<br />
Made of ice<br />
Different colors<br />
Polar regions<br />
Evaporate & melt<br />
Ice floes<br />
Begin in water<br />
Top of ocean freezes -<br />
makes a layer of ice<br />
Relatively quick<br />
formation<br />
Moves by wind only<br />
100% ice<br />
Breaks apart and<br />
refreezes <strong>to</strong>gether<br />
Edge: usually eroded<br />
Floats on <strong>to</strong>p of water<br />
You may find that <strong>Venn</strong>s also work well when sophisticated learners are<br />
comparing three concepts (e.g., using the three-circle <strong>Venn</strong> diagram), but not as<br />
well for less sophisticated learners, as the three-circle <strong>Venn</strong> can be very<br />
confusing . Rarely do four circle <strong>Venn</strong>s work for all learners.<br />
Main ideas<br />
Main ideas<br />
What is this whole thing<br />
What is this whole thing<br />
about?<br />
about?<br />
Detail<br />
Detail<br />
s<br />
Detail<br />
Detail<br />
s<br />
Compare &<br />
<strong>contrast</strong><br />
Frames<br />
Two Concept<br />
Comparison<br />
Frame<br />
What is important <strong>to</strong> understand about<br />
What is important <strong>to</strong> understand about<br />
this?<br />
this?
Language Arts<br />
The Two -concept Comparison Frame could be used <strong>to</strong> teach vocabulary by<br />
comparing use of terms in different contexts....<br />
Vocabulary from Dragon Wings San Francisco Earthquakes<br />
Categories<br />
1906 Earthquake<br />
(described in Dragon Wings)<br />
1991 Earthquake<br />
(your personal experience)<br />
foreshadowing<br />
desolation<br />
pandemonium<br />
refuge<br />
So what? What is important <strong>to</strong> understand about this?<br />
© 2001 Masterminds, LLC graphicorganizers.com<br />
Comparison (synthesis) Frame<br />
The Comparison Frame can also be presented in a manner that requires<br />
students <strong>to</strong> understand the “bigger picture” as related <strong>to</strong> each specific main idea<br />
on the frame. The middle section of the graphic below, titled “So What?” requires<br />
that the information be synthesized.<br />
Categories<br />
This about comparing...<br />
Conclusion<br />
So what? What is important <strong>to</strong> understand about this?<br />
© 2001 Masterminds, LLC graphicorganizers.com
Three Concept Comparison Frame<br />
Comparison Frames can be used effectively <strong>to</strong> <strong>compare</strong> three concepts. Other<br />
than the overall synthesis at the bot<strong>to</strong>m of the form (“So What? What’s important<br />
<strong>to</strong> understand about this”), this graphic does not, however, provide space for<br />
synthesizing conclusions for each main idea being <strong>compare</strong>d.<br />
Health Science example<br />
The Three-concept Comparison Frame is used here <strong>to</strong> analyze three forms of<br />
disease.<br />
What is this whole thing about?<br />
Types of Diseases<br />
Bacterial<br />
Viral Infection<br />
Infection<br />
Cancer<br />
Main ideas<br />
How caught<br />
Details<br />
Details<br />
Details<br />
How spreads<br />
Deadliness<br />
Treatment<br />
approaches<br />
How prevented<br />
Impact of diet<br />
& exercise<br />
So what? What is important <strong>to</strong> understand about<br />
this?
Topics<br />
Categories of Information<br />
for comparison are listed on the perpendicular side.<br />
<strong>Using</strong> Induction<br />
Matrixes <strong>to</strong> <strong>depict</strong><br />
<strong>compare</strong>/<strong>contrast</strong><br />
<strong>relationships</strong><br />
To <strong>compare</strong> multiple concepts<br />
along several dimension, you can<br />
also use an Induction Matrix. Here,<br />
the overall <strong>to</strong>pic and components<br />
of the <strong>to</strong>pic are listed on one side<br />
of the matrix, and the dimensions<br />
Note that both parallel and vertical columns end with a space labeled “So What?”<br />
These allow students <strong>to</strong> draw conclusions, summarize, or synthesize information<br />
in each category.<br />
Health Science example<br />
The Induction Matrix could be used <strong>to</strong> <strong>compare</strong> multiple <strong>to</strong>pics and facilitate<br />
students forming conclusions. In this example, students and the teacher coconstruct<br />
the graphic by filling in each of the various boxes as the different<br />
fac<strong>to</strong>rs that affect the cardio-respira<strong>to</strong>ry system are examined.<br />
AGE<br />
Relationship of Cardio-Respira<strong>to</strong>ry Risk fac<strong>to</strong>rs<br />
CAN YOU<br />
CONTROL<br />
THIS?<br />
NO<br />
EFFECT ON<br />
CIRCULATORY<br />
SYSTEM?<br />
Older you get<br />
the weaker<br />
your system<br />
EFFECT ON<br />
RESPIRATORY<br />
SYSTEM<br />
Older you get,<br />
the weaker<br />
your system<br />
SO WHAT?<br />
Risk increases with age<br />
GENDER<br />
NO<br />
Men =poor<br />
Women = better<br />
HEREDITY<br />
NO<br />
+/-<br />
+/-<br />
Risk of C-R disease increases if<br />
there is a family his<strong>to</strong>ry<br />
DIET<br />
YES<br />
+/-<br />
Diet high in saturated fats & salt<br />
increases the risk of heart disease<br />
STRESS<br />
YES<br />
Negative<br />
impact<br />
Negative<br />
impact<br />
Too much stress can lead <strong>to</strong><br />
heart disease<br />
SMOKING<br />
YES<br />
Negative<br />
impact<br />
Negative<br />
impact<br />
Smoking is extremely hazardous<br />
<strong>to</strong> C-R system<br />
EXERCISE<br />
YES<br />
Positive<br />
impact<br />
Positive<br />
impact<br />
Great way <strong>to</strong> minimize negative<br />
risk fac<strong>to</strong>rs & maintain a healthy<br />
C-R system
Categories/Topics<br />
Features<br />
<strong>Using</strong><br />
Semantic<br />
Features<br />
Analysis grids<br />
<strong>to</strong> <strong>depict</strong><br />
<strong>compare</strong> &<br />
<strong>contrast</strong><br />
<strong>relationships</strong><br />
The Semantic Features Analysis Grid can be used <strong>to</strong> facilitate an understanding<br />
of the common traits or features shared by a group of concepts as well as how<br />
they differ among these features.<br />
The example below illustrates how a Semantic Features Analysis grid was<br />
completed during a study about Ancient Egypt.
The example below illustrates the application of a features analysis grid about<br />
vehicles.<br />
VEHICLES<br />
car<br />
bicycle<br />
mo<strong>to</strong>rcycle<br />
pickup truck<br />
transfer truck<br />
train<br />
skateboard<br />
row boat<br />
sailboat<br />
mo<strong>to</strong>rboat<br />
airplane<br />
Features<br />
two wheels<br />
four wheels<br />
more than 4 wheels<br />
mo<strong>to</strong>r<br />
= feature always present<br />
diesel fuel<br />
gasoline fuel<br />
people power<br />
handle bars<br />
passengers<br />
used on land<br />
= feature sometimes present
Ana<strong>to</strong>my Science example<br />
A Features Analysis Grid can be used <strong>to</strong> facilitate an understanding of the unique<br />
and shared functions of various tissues<br />
Endocrine<br />
GLANDS<br />
Pituitary<br />
Thyroid<br />
Thymus<br />
Adrenal<br />
Pancreas<br />
Ovaries<br />
Testis<br />
Features<br />
impacts metabolism & growth<br />
regulates growth<br />
impacts absorption of nutrients<br />
impacts fluid balance & ions<br />
responds <strong>to</strong> stress<br />
impacts sexual characteristics<br />
impacts reproduction processes<br />
targets fat tissue<br />
targets liver<br />
targets heart /blood<br />
targets thyroid<br />
targets kidney<br />
targets uterus<br />
targets ovary & mammary<br />
targets bones<br />
skeletal muscle<br />
targets immune tissues<br />
most body tissues<br />
How<br />
Feature<br />
is like<br />
is like<br />
is like<br />
is like<br />
is like<br />
Feature<br />
because<br />
because<br />
because<br />
because<br />
<strong>Using</strong> ‘Is<br />
Like’<br />
Synetics <strong>to</strong><br />
<strong>depict</strong><br />
<strong>compare</strong> &<br />
<strong>contrast</strong><br />
<strong>relationships</strong><br />
So what? What is important <strong>to</strong> understand about this?
Political Science example<br />
The Is Like Synetic could be used <strong>to</strong> help students recognize similarities in<br />
different forms of governments...<br />
How<br />
is like<br />
feudalism<br />
communism<br />
Feature<br />
serf<br />
is<br />
like<br />
Feature<br />
collective<br />
farm worker<br />
because<br />
must give <strong>to</strong> government what you grow --<br />
can’t sell it on your own - no choice but <strong>to</strong><br />
work on the farms -- can only leave with<br />
permission of government leaders<br />
king owns all<br />
land, homes,<br />
business in<br />
kingdom<br />
is<br />
like<br />
government<br />
owns all land,<br />
houses, etc.<br />
because<br />
common people can’t own land, homes,<br />
etc. -its ‘lent’ <strong>to</strong> them by gov & can be<br />
taken away if someone does something<br />
that displeases the people with the power<br />
kingdom<br />
attained by<br />
inheriting it or<br />
winning war<br />
is<br />
like<br />
power<br />
attained by<br />
overthrowing<br />
old leadership<br />
because<br />
‘might makes right’ ....who ever is the<br />
strongest rules<br />
Changes in leadership often involves<br />
violence<br />
So what? What is important <strong>to</strong> understand about this?<br />
In both feudalism & communism, people in power use their power <strong>to</strong> keep it.<br />
Common people have few, if any rights and little ability <strong>to</strong> control what happens <strong>to</strong><br />
them (no freedom!). All the power is centered at the <strong>to</strong>p, so must be careful not <strong>to</strong><br />
displease people in power or else ...<br />
A B C D E<br />
<strong>Using</strong> Bar Graphs<br />
<strong>to</strong> <strong>depict</strong><br />
<strong>compare</strong> &<br />
<strong>contrast</strong><br />
<strong>relationships</strong><br />
Bar Graphs always either<br />
<strong>compare</strong> quantities of<br />
something across two or more<br />
dimensions within the same<br />
time span (e.g., <strong>compare</strong> wheat production of U.S., Canada, Russia, and China<br />
during 2001) or <strong>compare</strong> changes in quantities of something within a single<br />
dimension across different time spans (e.g., wheat production in Canada during<br />
1998, 1999, 2000, 2001). MAKES SENSE HOME GRAPHIC ORGANIZERS HOME