ALCOHOL PRIORITY UPDATE 1. PURPOSE OF REPORT 1.1 To p
ALCOHOL PRIORITY UPDATE 1. PURPOSE OF REPORT 1.1 To p
ALCOHOL PRIORITY UPDATE 1. PURPOSE OF REPORT 1.1 To p

You also want an ePaper? Increase the reach of your titles
YUMPU automatically turns print PDFs into web optimized ePapers that Google loves.
Appendix 1: See Attached<br />
Appendix 2: Alcohol related data<br />
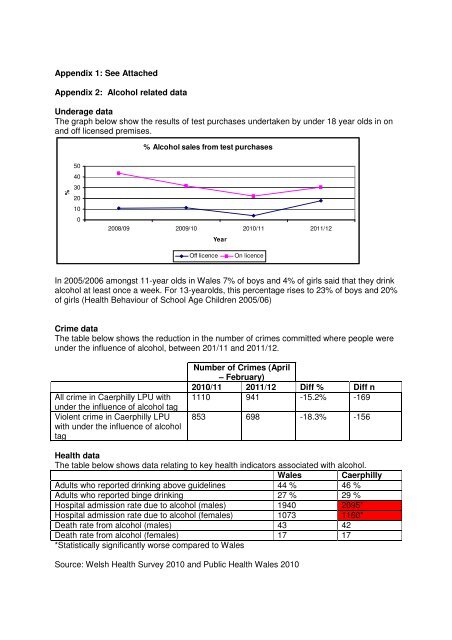
Underage data<br />
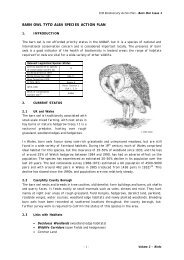
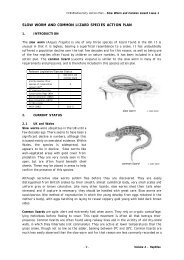
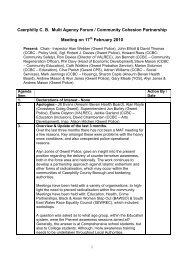
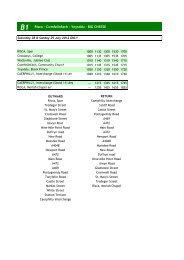
The graph below show the results of test purchases undertaken by under 18 year olds in on<br />
and off licensed premises.<br />
% Alcohol sales from test purchases<br />
%<br />
50<br />
40<br />
30<br />
20<br />
10<br />
0<br />
2008/09 2009/10 2010/11 2011/12<br />
Year<br />
Off licence<br />
On licence<br />
In 2005/2006 amongst 11-year olds in Wales 7% of boys and 4% of girls said that they drink<br />
alcohol at least once a week. For 13-yearolds, this percentage rises to 23% of boys and 20%<br />
of girls (Health Behaviour of School Age Children 2005/06)<br />
Crime data<br />
The table below shows the reduction in the number of crimes committed where people were<br />
under the influence of alcohol, between 201/11 and 2011/12.<br />
All crime in Caerphilly LPU with<br />
under the influence of alcohol tag<br />
Violent crime in Caerphilly LPU<br />
with under the influence of alcohol<br />
tag<br />
Number of Crimes (April<br />
– February)<br />
2010/11 2011/12 Diff % Diff n<br />
1110 941 -15.2% -169<br />
853 698 -18.3% -156<br />
Health data<br />
The table below shows data relating to key health indicators associated with alcohol.<br />
Wales Caerphilly<br />
Adults who reported drinking above guidelines 44 % 46 %<br />
Adults who reported binge drinking 27 % 29 %<br />
Hospital admission rate due to alcohol (males) 1940 2095*<br />
Hospital admission rate due to alcohol (females) 1073 1160*<br />
Death rate from alcohol (males) 43 42<br />
Death rate from alcohol (females) 17 17<br />
*Statistically significantly worse compared to Wales<br />
Source: Welsh Health Survey 2010 and Public Health Wales 2010