Matoza et al St. Helens Infrasound JGR 09
Matoza et al St. Helens Infrasound JGR 09
Matoza et al St. Helens Infrasound JGR 09

You also want an ePaper? Increase the reach of your titles
YUMPU automatically turns print PDFs into web optimized ePapers that Google loves.
B04305 MATOZA ET AL.: INFRASOUND FROM LPS AT MOUNT ST. HELENS<br />
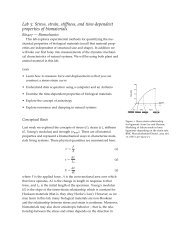
Figure 24. A 2-D FD simulation of the four atmospheric cases shown in Figure 23, with and without<br />
topography. All images are pressure wavefield snapshots at t = 38 s. (a) G2S model for 0600 UTC,<br />
1 November 2004 with effects of wind neglected. (b) Same as Figure 24a but in-profile wind included.<br />
(c) G2S model for 1800 UTC, 1 November 2004 with effects of wind neglected. (d) Same as Figure 24c<br />
but in-profile wind included. (e)–(h) Same as Figures 24a–24d but source is buried at 60 m depth in<br />
elastic topography. Note the difference in vertic<strong>al</strong> sc<strong>al</strong>es for Figures 24a–24d versus Figures 24e–24h.<br />
In <strong>al</strong>l cases, the effects of wind and temperature gradients are less pronounced than in the infinitefrequency<br />
ray approximation, with only slight steepening and gradu<strong>al</strong> refraction of wavefronts. In<br />
contrast, the ray results of Figure 23 predict a full shadow zone for the case shown here as Figures 24d<br />
and 24h. The effects of wind are evident as in Figure 24d, where upturning of the wavefront, and weaker<br />
amplitude near the base of the model are observed. However, the simulations (Figures 24e–24h) show<br />
less sensitivity to the atmospheric conditions, suggesting that scattering from topography may be<br />
important for filling in the infrasonic shadow zone.<br />
6.2. Finite Differences<br />
[66] Figure 24 shows the results of 2-D finite difference<br />
(FD) simulations for the four atmospheric cases shown in<br />
Figure 23, with and without elastic ground topography.<br />
Where topography is neglected (Figures 24a–24d), the<br />
source <strong>al</strong>titude is the same as in the ray simulations of<br />
Figure 23 and <strong>al</strong>l boundary conditions are absorbing (no<br />
reflections from the ground), <strong>al</strong>lowing for a direct comparison<br />
of ray tracing and FD m<strong>et</strong>hods. Where topography is<br />
included (Figures 24e–24h), the source is buried at a depth<br />
of 60 m within the volcano. In each case we <strong>al</strong>so included a<br />
more re<strong>al</strong>istic density profile for the atmosphere modeled as<br />
ðzÞ ¼ 0e<br />
0:000146ðz z0Þ<br />
where r 0 = 1.04 kg/m 3 at z 0 = 1100 m in our coordinate<br />
system. Although the 2-D geom<strong>et</strong>ry does not include the<br />
geom<strong>et</strong>ric<strong>al</strong> spreading loss, it models the wavefield<br />
structure, which is more directly comparable to the ray<br />
results of Figure 23.<br />
[67] All simulations in Figure 24 show less pronounced<br />
effects of vertic<strong>al</strong> wind and temperature gradients than the<br />
ray simulations of Figure 23. Rather than sharp refraction<br />
and the formation of clear shadow zones, the gradients<br />
result in a slight steepening and gradu<strong>al</strong> upward turning of<br />
32 of 38<br />
B04305<br />
the wavefronts, with significant energy diffracting down<br />
into the ray shadow zones. The simulations neglecting wind<br />
(Figures 24a, 24c, 24e, and 24g) are barely distinguishable<br />
from one another, while the simulations including wind<br />
(Figures 24b, 24d, 24f, and 24h) show more pronounced<br />
differences. This is in agreement with the prediction of<br />
Figure 23 that wind has more significant effect on acoustic<br />
propagation at this sc<strong>al</strong>e than vertic<strong>al</strong> temperature gradients.<br />
As in Figure 23e, the most significant effects are seen in<br />
Figure 24d, with the G2S model for 1800 UTC, 1 November<br />
2004 with wind included. In Figure 23e a full shadow zone<br />
for CDWR is predicted, while in Figure 24d some weak<br />
upward refraction results in a predicted lower amplitude at<br />
CDWR (energy weaker <strong>al</strong>ong wavefront below z = 0 km),<br />
but not the compl<strong>et</strong>e loss of sign<strong>al</strong>. Thus, the ray and FD<br />
results are in qu<strong>al</strong>itative agreement about which are the<br />
more dominant atmospheric effects on propagation (i.e.,<br />
winds blowing receiver-source), but rays are overly sensitive<br />
to these gradients and predict full sign<strong>al</strong> loss where FD<br />
predicts significant energy.<br />
[68] Further differences are seen in the simulations including<br />
elastic topography and a buried source (Figures 24e–<br />
24h). Here, the effects of refraction are even less pronounced<br />
than in the simulations without topography (Figures 24a–<br />
24d). In particular, the energy loss predicted at a ground-