Matoza et al St. Helens Infrasound JGR 09
Matoza et al St. Helens Infrasound JGR 09
Matoza et al St. Helens Infrasound JGR 09

Create successful ePaper yourself
Turn your PDF publications into a flip-book with our unique Google optimized e-Paper software.
B04305 MATOZA ET AL.: INFRASOUND FROM LPS AT MOUNT ST. HELENS<br />
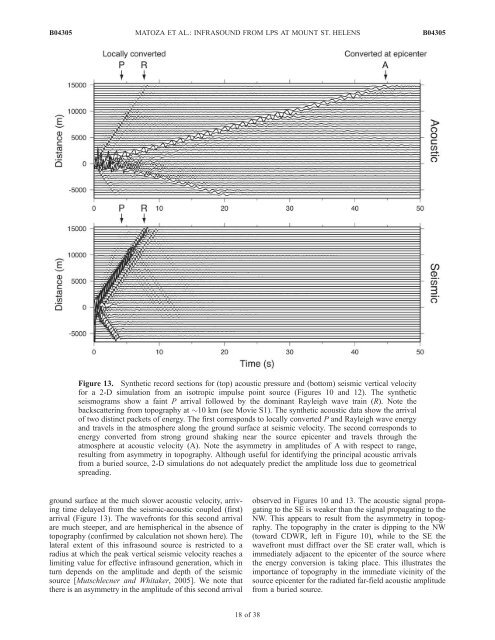
Figure 13. Synth<strong>et</strong>ic record sections for (top) acoustic pressure and (bottom) seismic vertic<strong>al</strong> velocity<br />
for a 2-D simulation from an isotropic impulse point source (Figures 10 and 12). The synth<strong>et</strong>ic<br />
seismograms show a faint P arriv<strong>al</strong> followed by the dominant Rayleigh wave train (R). Note the<br />
backscattering from topography at 10 km (see Movie S1). The synth<strong>et</strong>ic acoustic data show the arriv<strong>al</strong><br />
of two distinct pack<strong>et</strong>s of energy. The first corresponds to loc<strong>al</strong>ly converted P and Rayleigh wave energy<br />
and travels in the atmosphere <strong>al</strong>ong the ground surface at seismic velocity. The second corresponds to<br />
energy converted from strong ground shaking near the source epicenter and travels through the<br />
atmosphere at acoustic velocity (A). Note the asymm<strong>et</strong>ry in amplitudes of A with respect to range,<br />
resulting from asymm<strong>et</strong>ry in topography. Although useful for identifying the princip<strong>al</strong> acoustic arriv<strong>al</strong>s<br />
from a buried source, 2-D simulations do not adequately predict the amplitude loss due to geom<strong>et</strong>ric<strong>al</strong><br />
spreading.<br />
ground surface at the much slower acoustic velocity, arriving<br />
time delayed from the seismic-acoustic coupled (first)<br />
arriv<strong>al</strong> (Figure 13). The wavefronts for this second arriv<strong>al</strong><br />
are much steeper, and are hemispheric<strong>al</strong> in the absence of<br />
topography (confirmed by c<strong>al</strong>culation not shown here). The<br />
later<strong>al</strong> extent of this infrasound source is restricted to a<br />
radius at which the peak vertic<strong>al</strong> seismic velocity reaches a<br />
limiting v<strong>al</strong>ue for effective infrasound generation, which in<br />
turn depends on the amplitude and depth of the seismic<br />
source [Mutschlecner and Whitaker, 2005]. We note that<br />
there is an asymm<strong>et</strong>ry in the amplitude of this second arriv<strong>al</strong><br />
18 of 38<br />
B04305<br />
observed in Figures 10 and 13. The acoustic sign<strong>al</strong> propagating<br />
to the SE is weaker than the sign<strong>al</strong> propagating to the<br />
NW. This appears to result from the asymm<strong>et</strong>ry in topography.<br />
The topography in the crater is dipping to the NW<br />
(toward CDWR, left in Figure 10), while to the SE the<br />
wavefront must diffract over the SE crater w<strong>al</strong>l, which is<br />
immediately adjacent to the epicenter of the source where<br />
the energy conversion is taking place. This illustrates the<br />
importance of topography in the immediate vicinity of the<br />
source epicenter for the radiated far-field acoustic amplitude<br />
from a buried source.