Matoza et al St. Helens Infrasound JGR 09
Matoza et al St. Helens Infrasound JGR 09
Matoza et al St. Helens Infrasound JGR 09

Create successful ePaper yourself
Turn your PDF publications into a flip-book with our unique Google optimized e-Paper software.
B04305 MATOZA ET AL.: INFRASOUND FROM LPS AT MOUNT ST. HELENS<br />
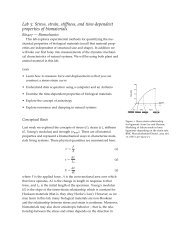
Figure 8. Comparison of infrasonic waveform correlation with available wind data 10–12 November<br />
(JD 315–318) 2004. (a) Infrasonic CC with master event (Figure 7). (b) Spectrogram of low-frequency<br />
(0–1 Hz) pressure at CDWR centr<strong>al</strong> infrasonic sensor element. (c) Black, 1-min wind speed average at<br />
CDWR; blue, hourly wind speed max at CDWR; red, hourly wind speed max at NWAC. (d) Black,<br />
hourly wind direction average at CDWR; red, hourly wind direction average at NWAC. At least one<br />
measured wind speed increase (JD 315.5–316) is associated with a loss in sign<strong>al</strong> correlation. The diffuse<br />
peak at 0.2 Hz in the spectrogram is the microbarom peak. Wind direction is defined as the direction<br />
from which wind is blowing.<br />
location or source time function. Acoustic propagation is<br />
further subject to time-dependent variability in atmospheric<br />
conditions, especi<strong>al</strong>ly changes in temperature and wind. In<br />
this case, a change in the waveform correlation with time<br />
can imply a change in the source location, source time<br />
function, or a change in the atmospheric conditions.<br />
3.1. Waveform Changes: 1–16 November 2004<br />
[25] We an<strong>al</strong>yze CDWR data for 1–16 November, or<br />
Julian days (JD) 306–322, 2004 (Figure 7). This corresponds<br />
to the time period depicted by <strong>Matoza</strong> <strong>et</strong> <strong>al</strong>. [2007,<br />
Figure 3], where Progressive MultiChannel Correlation<br />
(PMCC) [Cansi, 1995] d<strong>et</strong>ection of infrasound from LPs<br />
11 of 38<br />
B04305<br />
was observed to switch on and off while the seismic LP<br />
events were continuously observed (see Figure S3). We <strong>al</strong>so<br />
an<strong>al</strong>yzed data from 1 to 19 March 2005 using the same<br />
m<strong>et</strong>hod and obtained similar results. All data were bandpass<br />
filtered at 2–4 Hz and the infrasound data were beamformed<br />
(azimuth 153°, speed 330 m/s). Events were picked<br />
using the STA/LTA d<strong>et</strong>ector, then progressively selected for<br />
correlation with the master event using 11 s windows (3 s<br />
pr<strong>et</strong>rigger, 8 s posttrigger). In Figure 7, the master event<br />
(seismic, 1803:38 UTC; infrasonic, 1804:16 UTC, 11<br />
November 2004) was an event arbitrarily chosen from a<br />
time period of good seismic and infrasonic sign<strong>al</strong>-to-noise