2008 Annual Monitoring Report (pdf 10.9MB) - Bolsa Chica ...
2008 Annual Monitoring Report (pdf 10.9MB) - Bolsa Chica ... 2008 Annual Monitoring Report (pdf 10.9MB) - Bolsa Chica ...
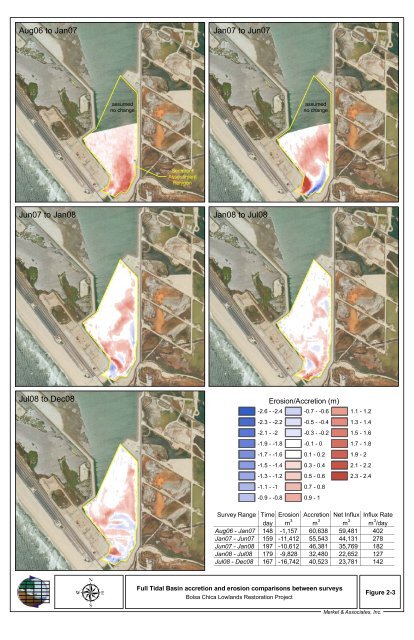
Aug06 to Jan07 Jan07 to Jun07 assumed no change assumed no change Sediment Assessment Polygon Jun07 to Jan08 Jan08 to Jul08 Jul08 to Dec08 Erosion/Accretion (m) -2.6 - -2.4 -0.7 - -0.6 -2.3 - -2.2 -0.5 - -0.4 -2.1 - -2 -0.3 - -0.2 -1.9 - -1.8 -0.1 - 0 -1.7 - -1.6 0.1 - 0.2 -1.5 - -1.4 0.3 - 0.4 -1.3 - -1.2 0.5 - 0.6 -1.1 - -1 0.7 - 0.8 -0.9 - -0.8 0.9 - 1 1.1 - 1.2 1.3 - 1.4 1.5 - 1.6 1.7 - 1.8 1.9 - 2 2.1 - 2.2 2.3 - 2.4 Survey Range Time Erosion Accretion Net Influx Influx Rate day m 3 m 3 m 3 m 3 /day Aug06 - Jan07 148 -1,157 60,638 59,481 402 Jan07 - Jun07 159 -11,412 55,543 44,131 278 Jun07 - Jan08 197 -10,612 46,381 35,769 182 Jan08 - Jul08 179 -9,828 32,480 22,652 127 Jul08 - Dec08 167 -16,742 40,523 23,781 142 Full Tidal Basin accretion and erosion comparisons between surveys Bolsa Chica Lowlands Restoration Project Figure 2-3 Merkel & Associates, Inc.
Bolsa Chica Lowlands Restoration Monitoring 2008 Annual Report Figure 2-4 presents the net accretion rate graphically as net sediment accretion per month within the assessment area shown in Figure 2-1. Again, the averages do not represent the actual accretion per day or month, as field observations noted that deposition and erosion occurred over time at an uneven rate. 15,000 Net Accretion Rate (m 3 /month) 10,000 5,000 12,139 m 3 /mo 8,327 m 3 /mo 5,419 m 3 /mo 3,775 m 3 /mo 4,247 m 3 /mo 0 Opening through Jan. 2007 Jan. 2007 through June 2007 June 2007 through Jan. 2008 Jan. 2008 through July 2008 July 2008 through Dec. 2008 Figure 2-4. Net sediment accretion rate per month A grain size analysis of the sand accreted in the FTB inlet was conducted in June 2008 in anticipation of maintenance dredging activities scheduled for 2009. The shoal sediment was documented to be 99% sand with minor components of fine gravel (shell hash) and silt/clay fractions (M&A 2008b). Discussion Flood shoal development within Bolsa Chica exhibited patterns typical of coastal wetland systems. Shoals develop as individual depositional fans along the primary flow alignment. As sediments are deposited, the resistance to flow along the channel increases and shoals continue to build until such time as the flows break out of the main channel and define a new primary channel. As a result of the continued process, the flood shoal builds as a series of teardrop shaped lobes running into the basin. These are subsequently modified by wave and current erosion as water moves past and across the deposited fan. The importance of this shoaling process is that it creates a regular depositional pattern through a process defined by unpredictable events. The shoaling by highly settleable sands follows a pathway along the principal coarse of flow with little lateral spread in footprint. As a result, quiescent waters that are outside of the higher velocity effective flow path may not receive sediment deposition and more linear shoals may develop in alignment with flow patterns. Terminal and lateral slopes of the flood shoal deposit are typically at or near the angle of repose for the clean sands (approximately 30-35 degrees). The bathymetric assessment of the FTB inlet and numerous site visits indicated that the tidal inlet morphology and sediment depositional areas (inlet thalweg and flood shoal patterns) are highly Merkel & Associates, Inc. 104
- Page 58 and 59: Topsmelt January April July October
- Page 60 and 61: Bolsa Chica Lowlands Restoration Mo
- Page 62 and 63: Bolsa Chica Lowlands Restoration Mo
- Page 64 and 65: Bolsa Chica Lowlands Restoration Mo
- Page 66 and 67: Bolsa Chica Lowlands Restoration Mo
- Page 68 and 69: Bolsa Chica Lowlands Restoration Mo
- Page 70 and 71: Bolsa Chica Lowlands Restoration Mo
- Page 72 and 73: Bolsa Chica Lowlands Restoration Mo
- Page 74 and 75: 22 Temperature 20 Temperature (C) 1
- Page 76 and 77: Bolsa Chica Lowlands Restoration Mo
- Page 78 and 79: PM 50 66 47 Full Tidal Basin Future
- Page 80 and 81: Bolsa Chica Lowlands Restoration Mo
- Page 82 and 83: Bolsa Chica Lowlands Restoration Mo
- Page 84 and 85: Bolsa Chica Lowlands Restoration Mo
- Page 86 and 87: Bolsa Chica Lowlands Restoration Mo
- Page 88 and 89: Bolsa Chica Lowlands Restoration Mo
- Page 90 and 91: Bolsa Chica Lowlands Restoration Mo
- Page 92 and 93: Bolsa Chica Lowlands Restoration Mo
- Page 94 and 95: Zone PM 2 9 10 11 12 13 14 19 20 21
- Page 96 and 97: Bolsa Chica Lowlands Restoration Mo
- Page 98 and 99: Bolsa Chica Lowlands Restoration Mo
- Page 100 and 101: Bolsa Chica Lowlands Restoration Mo
- Page 102 and 103: Bolsa Chica Lowlands Restoration Mo
- Page 104 and 105: Bolsa Chica Lowlands Restoration Mo
- Page 106 and 107: Bolsa Chica Lowlands Restoration Mo
- Page 110 and 111: Bolsa Chica Lowlands Restoration Mo
- Page 112 and 113: Bolsa Chica Lowlands Restoration Mo
- Page 114 and 115: Bolsa Chica Lowlands Restoration Mo
- Page 116 and 117: Bolsa Chica Lowlands Restoration Mo
- Page 118 and 119: Bolsa Chica Lowlands Restoration Mo
- Page 120 and 121: Bolsa Chica Lowlands Restoration Mo
- Page 122 and 123: Bolsa Chica Lowlands Restoration Mo
- Page 124 and 125: Bolsa Chica Lowlands Restoration Mo
- Page 126 and 127: Bolsa Chica Lowlands Restoration Mo
- Page 128 and 129: Bolsa Chica Lowlands Restoration Mo
- Page 130 and 131: Bolsa Chica Lowlands Restoration Mo
- Page 132 and 133: Bolsa Chica Lowlands Restoration Mo
- Page 134 and 135: Bolsa Chica Lowlands Restoration Mo
- Page 136 and 137: Bolsa Chica Lowlands Restoration Mo
- Page 138 and 139: Bolsa Chica Lowlands Restoration Mo
- Page 140 and 141: Bolsa Chica Lowlands Restoration Mo
- Page 142 and 143: Bolsa Chica Lowlands Restoration Mo
- Page 144 and 145: Bolsa Chica Lowlands Restoration Mo
- Page 146 and 147: Bolsa Chica Lowlands Restoration Mo
- Page 148 and 149: Bolsa Chica Lowlands Restoration Mo
- Page 150 and 151: Bolsa Chica Lowlands Restoration Mo
- Page 152 and 153: Bolsa Chica Lowlands Restoration Mo
- Page 154 and 155: Bolsa Chica Lowlands Restoration Mo
- Page 156 and 157: Bolsa Chica Lowlands Restoration Mo
Aug06 to Jan07<br />
Jan07 to Jun07<br />
assumed<br />
no change<br />
assumed<br />
no change<br />
Sediment<br />
Assessment<br />
Polygon<br />
Jun07 to Jan08<br />
Jan08 to Jul08<br />
Jul08 to Dec08<br />
Erosion/Accretion (m)<br />
-2.6 - -2.4 -0.7 - -0.6<br />
-2.3 - -2.2 -0.5 - -0.4<br />
-2.1 - -2 -0.3 - -0.2<br />
-1.9 - -1.8 -0.1 - 0<br />
-1.7 - -1.6 0.1 - 0.2<br />
-1.5 - -1.4 0.3 - 0.4<br />
-1.3 - -1.2 0.5 - 0.6<br />
-1.1 - -1 0.7 - 0.8<br />
-0.9 - -0.8 0.9 - 1<br />
1.1 - 1.2<br />
1.3 - 1.4<br />
1.5 - 1.6<br />
1.7 - 1.8<br />
1.9 - 2<br />
2.1 - 2.2<br />
2.3 - 2.4<br />
Survey Range Time Erosion Accretion Net Influx Influx Rate<br />
day m 3 m 3 m 3 m 3 /day<br />
Aug06 - Jan07 148 -1,157 60,638 59,481 402<br />
Jan07 - Jun07 159 -11,412 55,543 44,131 278<br />
Jun07 - Jan08 197 -10,612 46,381 35,769 182<br />
Jan08 - Jul08 179 -9,828 32,480 22,652 127<br />
Jul08 - Dec08 167 -16,742 40,523 23,781 142<br />
Full Tidal Basin accretion and erosion comparisons between surveys<br />
<strong>Bolsa</strong> <strong>Chica</strong> Lowlands Restoration Project<br />
Figure 2-3<br />
Merkel & Associates, Inc.


