WP9 metadata - Passenger trips by car 2010 - ETIS plus
WP9 metadata - Passenger trips by car 2010 - ETIS plus
WP9 metadata - Passenger trips by car 2010 - ETIS plus

Create successful ePaper yourself
Turn your PDF publications into a flip-book with our unique Google optimized e-Paper software.
<strong>ETIS</strong><strong>plus</strong>, D6 Database Manual<br />
<strong>Passenger</strong> database construction (WP 9)<br />
Annex report D6:<br />
Metadata – <strong>Passenger</strong> <strong>trips</strong> <strong>by</strong> <strong>car</strong>, Base Year <strong>2010</strong><br />
Version 1<br />
November, 2012
1. Scope of the database<br />
Data feature Data specification Remarks<br />
Base year <strong>2010</strong><br />
Scope of data Link Terminal O/D<br />
relation<br />
Region<br />
Other<br />
GIS data Yes No<br />
<br />
Country<br />
coverage<br />
<br />
<br />
Completely<br />
EU 27<br />
<br />
<br />
Candidate countries <br />
& EFTA<br />
Neighbouring <br />
countries<br />
TRACECA <br />
MEDA <br />
Other countries <br />
Partially<br />
Total number of<br />
countries covered: 42<br />
Main<br />
sources<br />
data<br />
National Travel surveys;<br />
EU Energy and Transport in Figures –<br />
Statistical Pocketbook <strong>2010</strong>;<br />
National transport figures & statistics<br />
Please refer to the model<br />
documentation.<br />
Main type of<br />
data<br />
generation<br />
Observed<br />
Harmonized<br />
Modelled
2. Data structure<br />
Indicator Description of indicator Unit<br />
Origin Zone<br />
Origin Zone ID at NUTS 3 level<br />
Destination Zone<br />
Trip Purpose<br />
Destination Zone ID at NUTS 3 level<br />
Trip purpose<br />
<strong>Passenger</strong> Trips <strong>by</strong> <strong>car</strong> Yearly <strong>trips</strong> <strong>trips</strong>/year<br />
The “<strong>Passenger</strong> <strong>trips</strong> <strong>by</strong> <strong>car</strong>” database includes total passenger <strong>trips</strong> <strong>by</strong> <strong>car</strong>, at NUTS 3 level<br />
(both intra-zonal and inter-zonal) differentiated <strong>by</strong> trip purpose:<br />
Business (<strong>trips</strong> for working purposes with different destination than the usual<br />
workplace),<br />
Private (non business related <strong>trips</strong> with duration of up to 4 days),<br />
Vacation (non-business <strong>trips</strong> with duration of more than 4 days),<br />
Commuting (daily <strong>trips</strong> for working or studying purposes).<br />
The database includes also international trip from Russia, Belarus, Moldova and Ukraine to<br />
Europe and retour.<br />
The matrix is in the GA (Generation Attraction) format.<br />
This implies that:<br />
the cell with ORIGIN ZONE A and DESTINATION ZONE B includes the <strong>trips</strong> made <strong>by</strong><br />
people living in zone A and going to zone B and the corresponding return <strong>trips</strong>;<br />
the cell with ORIGIN ZONE B and DESTINATION ZONE A includes the <strong>trips</strong> made <strong>by</strong><br />
people living in zone B and going to zone A and the corresponding return <strong>trips</strong>;<br />
the matrix is not symmetric.<br />
3. Introduction<br />
Two different methodologies are adopted for the production of the information included into<br />
these datasets.<br />
A first one is related to the production of a) Intra-zonal <strong>trips</strong> (local transport); a second one<br />
is used for the modelling of b) Inter-zonal <strong>trips</strong>.<br />
Here below the description of both approaches is provided.<br />
4. Intra-zonal <strong>trips</strong> <strong>by</strong> <strong>car</strong><br />
The estimation of local demand has a general common approach for all considered transport<br />
modes (<strong>car</strong>, rail, bus, tram&metro, walking and cycling) but some differences exist for each<br />
transport mode.<br />
The methodology heavily relies on available observed data: EUROSTAT and other<br />
international organizations statistics, national statistics, mobility studies, census data,<br />
National Travel Surveys, dedicated reports on public transport performances etc.<br />
Here below the main steps of the modelling framework are explained.<br />
4.1 Methodology<br />
Estimation of total <strong>trips</strong> <strong>by</strong> <strong>car</strong><br />
For the estimation of the intra-zonal <strong>car</strong> and rail <strong>trips</strong>, the methodology has benefited from<br />
the same approach adopted for the estimation of inter-zonal demand and in particular from<br />
the output of the implemented generation model (see below).
One of the output of this model is the vector of intra zone passenger <strong>trips</strong> <strong>by</strong> motorized<br />
modes (i.e. the sum of intra zone <strong>trips</strong> made <strong>by</strong> <strong>car</strong> and rail modes).<br />
Given the above mentioned input, the methodology has mainly focused on splitting the <strong>trips</strong><br />
between the two modes and on identifying the share of those <strong>trips</strong> within each distance<br />
band. In particular, local traffic <strong>by</strong> <strong>car</strong> is estimated as a difference from total motorized<br />
intra zonal traffic and intra zonal traffic <strong>by</strong> rail.<br />
Zones and distance bands<br />
The zoning system adopted for the estimation of <strong>2010</strong> local demand is the<br />
<strong>ETIS</strong>2006_zone_level3.<br />
The estimation of local demand is made for 39 countries: EU 27 + Accession + EFTA and the<br />
neighbouring countries Albania, Bosnia and Herzegovina, Montenegro, Serbia and Kosovo<br />
(1537 zones in total).<br />
Four distance bands have been defined for the estimation of local transport demand:<br />
Distance Band 1: <strong>trips</strong> between 0 and 3 Km<br />
Distance Band 2: <strong>trips</strong> between 3 and 25 Km<br />
Distance Band 3: <strong>trips</strong> between 25 and 50 Km<br />
Distance Band 4: <strong>trips</strong> > 50 km.<br />
The definition of these bands was made in relation to:<br />
Dimensions of <strong>ETIS</strong><strong>plus</strong> zoning system;<br />
Classifications currently used in available National Travel Surveys or other existing<br />
documentation.<br />
In particular the first distance band is related to very short <strong>trips</strong> and to <strong>trips</strong> <strong>by</strong> slow modes<br />
(walking and cycling).<br />
Distance bands 1 and 2 can be considered with a certain approximation as representative of<br />
urban <strong>trips</strong>, whereas the distance bands 3 and 4 are representative of interurban <strong>trips</strong>;<br />
particularly, distance band 4 is related to those <strong>trips</strong>, longer than 50 km, which start and<br />
end within the traffic zone.<br />
The first step of the methodology was to identify the distance bands belonging to each<br />
zone; this was made <strong>by</strong> considering the dimension of the zone and in particular a “virtual”<br />
diameter derived <strong>by</strong> approximating the zone to a circle.<br />
All <strong>ETIS</strong> zones have the first and the second distance bands; 1202 zones have the third<br />
distance band and 686 zones have also the fourth distance band.<br />
In several cases the defined distance bands intercept the dimension of the “virtual”<br />
diameter. As an example the zone AT111 Mittelburgenland has a virtual diameter of about<br />
30km. This implies that 100% of the <strong>trips</strong> within the first distance band (between 0 and 3<br />
Km) can be supposed to start and end within the zone; in similar way, 100% of the <strong>trips</strong><br />
belonging to the second distance band (<strong>trips</strong> between 3 and 25 Km) can be considered<br />
within the zone, but only a certain rate of the <strong>trips</strong> belonging to the third distance band<br />
(between 25 and 50 Km) can be supposed to start and end within the zone.<br />
Therefore for the distance bands that cross the virtual dimension of the zone the share of<br />
<strong>trips</strong> supposed to be intra-zonal is computed as a function of the virtual diameter and the<br />
upper threshold of the band.<br />
For those zones that have the “virtual” diameter >50 Km (fourth distance band) it is<br />
assumed that the share of <strong>trips</strong> within the Level zone 3 is a function of the ratio between<br />
the “virtual” diameter and a fixed threshold of 150Km.
Distribution <strong>by</strong> distance bands<br />
The distribution of <strong>trips</strong> within each distance band is made <strong>by</strong> deriving national coefficients<br />
from available sources.<br />
For some countries, it is possible to derive the share of <strong>trips</strong> <strong>by</strong> transport mode and <strong>by</strong> the<br />
defined distance band from available National Travel Surveys.<br />
In a first step, it is assumed that these rates apply to all <strong>trips</strong> generated <strong>by</strong> each single<br />
zone in the country.<br />
From the available National Travel Surveys it is also possible to derive information on the<br />
average trip length within each distance band <strong>by</strong> transport mode.<br />
It is assumed that no rail <strong>trips</strong> exist in the first distance band (0 to 3 km).<br />
In order to take into account the different nature of zones and the different availability of<br />
local rail services (metropolitan areas have generally more rail services than rural areas),<br />
additional coefficients have been estimated and calibrated on the basis of available<br />
information. In particular, for each country, different coefficients have been estimated on<br />
the basis of zone population in order to identify metropolitan areas, big urban areas, urban<br />
areas and rural zones.<br />
The estimation of these coefficients has benefited from consideration on zone dimensions<br />
and population and from statistics at zonal level (when available).<br />
Distribution <strong>by</strong> trip purposes<br />
Based on the information provided <strong>by</strong> several national travel surveys, the shares of <strong>trips</strong> <strong>by</strong><br />
mode and <strong>by</strong> purpose have been derived at national level. The distribution covered<br />
commuting, business and private trip purposes. Where information was not available, data<br />
from similar countries has been used as reference.<br />
An additional step was made to include the different characteristics of zones with regard to<br />
the amount of Economically Active population. For this purpose, the shares previously<br />
computed at national level have been adjusted according to the characteristics of the zones<br />
at Zone3 level: based on the ratio between active and total population <strong>by</strong> zone, the share of<br />
commuting and business <strong>trips</strong> have been increased/decreased depending on the difference<br />
with respect to the average national value.<br />
Final comparison<br />
The refinement of local demand estimation was made through the joint comparison of intra<br />
and inter zonal demand, both in terms of <strong>trips</strong> and traffic performances, in order to match<br />
EUROSTAT statistics for rail and <strong>car</strong> modes.<br />
4.2 Data sources<br />
The modelling of local passenger demand has benefited from an extensive data collection;<br />
data was gathered from several available sources and it varies from transport statistics,<br />
mobility studies, national travel surveys, census data, dedicated reports etc.<br />
As a general remark, it has to be stated that usually traffic data are not available at zone<br />
level; in the most of the cases statistics are available at national level or at a more<br />
aggregate level than the one adopted <strong>by</strong> the <strong>ETIS</strong> zoning system.<br />
Statistics are generally more available for public transport than for private transport.<br />
Here below the list of data sources considered for the modelling on intra zone passenger<br />
<strong>trips</strong> <strong>by</strong> <strong>car</strong> and rail modes is reported.<br />
Country<br />
International database<br />
EU27<br />
Austria<br />
Data source<br />
ec.europa.eu/transport/publications/statistics/pocketbook-<strong>2010</strong>_en.htm<br />
http://stats.oecd.org<br />
UNECE Transport Division Database http://w3.unece.org<br />
Eurostat table rail_pa_total<br />
www.statistik.at
Country<br />
Data source<br />
Belgium<br />
http://www.plan.be<br />
Bulgaria<br />
Data Collected from Bulgarian Ministry of Transport<br />
Czech Republic<br />
www.czso.cz<br />
Denmark<br />
http://www.statbank.dk<br />
National Travel Survey<br />
Estonia<br />
www.stat.ee<br />
Finland<br />
www.stat.fi<br />
National Travel Survey http://www.hlt.fi<br />
France<br />
www.developpement-durable.gouv.fr<br />
www.insee.fr<br />
National Travel Survey<br />
Germany<br />
www.destatis.de<br />
National Travel Survey<br />
Hungary<br />
www.ksh.hu<br />
Ireland<br />
http://census.cso.ie<br />
Italy<br />
www.istat.it<br />
www.isfort.it<br />
Latvia<br />
www.stat.gov.lt<br />
Netherlands Mobiliteitsonderzoek Nederland 2007<br />
National Travel Survey<br />
Poland<br />
www.stat.gov.pl<br />
Romania<br />
Data Collected from Romanian Ministry of Transport<br />
Slovakia<br />
www.statistics.sk<br />
Spain<br />
http://www.ine.es<br />
Sweden<br />
www.sl.se<br />
National Travel Survey http://www.sika-institute.se/<br />
United Kingdom<br />
www.tfl.gov.uk<br />
www.dft.gov.uk/statistics<br />
National Travel Survey<br />
Candidate<br />
& EFTA<br />
Croatia<br />
Norway<br />
Switzerland<br />
Turkey<br />
countries<br />
Neighbouring<br />
countries<br />
Bosnia and Herzegovina<br />
Serbia<br />
Data Collected from Croatian Ministry of Transport<br />
www.ssb.no<br />
www.bfs.admin.ch<br />
www.turkstat.gov.tr<br />
Data Collected from Ministry of Transport of Bosnia and Herzegovina<br />
Data Collected from Ministry of Transport of Serbia<br />
4.3 Results<br />
The table below summarizes the modelled intra-zonal <strong>trips</strong> <strong>by</strong> <strong>car</strong> at country level.<br />
Country<br />
Modelled passenger <strong>trips</strong> <strong>by</strong> <strong>car</strong> (intra-zonal)<br />
EU27<br />
Austria 5,718,388,958<br />
Belgium 5,816,346,414<br />
Germany 52,370,987,490<br />
Denmark 3,232,125,658<br />
Spain 18,344,391,885<br />
Finland 3,253,774,791<br />
France 39,400,153,639<br />
Greece 7,005,591,602<br />
Ireland 2,421,686,247<br />
Italy 32,746,585,334<br />
Luxembourg (Grand-Duché) 298,695,085<br />
Netherlands 7,372,084,508
Country<br />
Modelled passenger <strong>trips</strong> <strong>by</strong> <strong>car</strong> (intra-zonal)<br />
Portugal 4,376,181,195<br />
Sweden 5,924,550,617<br />
United Kingdom 37,114,693,719<br />
Bulgaria 3,174,590,647<br />
Cyprus 274,363,070<br />
Czech Republic 5,456,174,845<br />
Estonia 759,352,370<br />
Hungary 3,298,958,509<br />
Lithuania 1,905,740,413<br />
Latvia 1,667,857,480<br />
Malta 152,573,844<br />
Poland 28,336,758,920<br />
Romania 7,578,471,027<br />
Slovenia 1,257,939,250<br />
Slovakia 2,430,045,929<br />
Candidate countries & EFTA<br />
Switzerland 4,363,383,282<br />
Iceland<br />
Liechtenstein 18,238,148<br />
Norway 2,777,075,537<br />
Croatia 2,257,843,340<br />
Former Yugoslav Republic of Macedonia 554,720,873<br />
Turkey 25,626,475,459<br />
Neighbouring countries<br />
Albania 531,668,386<br />
Bosnia and Herzegovina 1,871,875,831<br />
Montenegro 180,368,279<br />
Serbia 2,132,203,983<br />
Kosovo 390,899,545<br />
n.a.<br />
The table below summarizes the modelled intra-zonal pass-km <strong>by</strong> <strong>car</strong> at country level.<br />
Country<br />
Modelled pass-km <strong>by</strong> <strong>car</strong> (intra-zonal)<br />
EU27<br />
Austria 33,388,757,735<br />
Belgium 43,926,783,512<br />
Germany 390,822,382,415<br />
Denmark 32,834,906,881<br />
Spain 202,552,246,328<br />
Finland 42,459,221,776<br />
France 435,148,304,391<br />
Greece 71,198,064,130<br />
Ireland 31,131,700,794<br />
Italy 528,513,982,431<br />
Luxembourg (Grand-Duché) 2,177,141,859<br />
Netherlands 67,242,886,159<br />
Portugal 49,052,323,065<br />
Sweden 72,996,181,766<br />
United Kingdom 410,050,768,170<br />
Bulgaria 31,193,717,470
Country<br />
Modelled pass-km <strong>by</strong> <strong>car</strong> (intra-zonal)<br />
Cyprus 5,937,647,498<br />
Czech Republic 35,407,341,519<br />
Estonia 7,637,840,407<br />
Hungary 32,950,974,299<br />
Lithuania 23,760,342,575<br />
Latvia 11,327,888,532<br />
Malta 1,654,357,645<br />
Poland 208,183,853,292<br />
Romania 54,189,680,183<br />
Slovenia 16,805,594,256<br />
Slovakia 16,357,923,212<br />
Candidate countries & EFTA<br />
Switzerland 50,652,490,888<br />
Iceland<br />
Liechtenstein 78,799,145<br />
Norway 36,489,274,462<br />
Croatia 15,524,783,313<br />
Former Yugoslav Republic of Macedonia 4,824,831,442<br />
Turkey 289,248,133,201<br />
Neighbouring countries<br />
Albania 4,383,402,133<br />
Bosnia and Herzegovina 16,319,273,835<br />
Montenegro 1,178,003,055<br />
Serbia 22,208,480,162<br />
Kosovo 3,945,776,953<br />
n.a.<br />
5. Inter-zonal <strong>trips</strong> <strong>by</strong> <strong>car</strong><br />
5.1 Methodology<br />
The modelling of inter-zonal <strong>trips</strong> follows the classical 4-step approach:<br />
Generation model;<br />
Distribution model;<br />
Mode choice model;<br />
Assignment model.<br />
To ensure consistency between rail and <strong>car</strong> <strong>trips</strong> at the level of O/D relations the passenger<br />
model covers rail and <strong>car</strong> <strong>trips</strong>.<br />
The generation model computes the number of inter-zonal originating land based passenger<br />
<strong>trips</strong> <strong>by</strong> rail and <strong>car</strong> for all NUTS 3 regions, as well as the number of attracted tr ips and<br />
distinguishes <strong>by</strong> purpose. The joint consideration of passenger trip demand <strong>by</strong> rail and <strong>car</strong><br />
as well as a rough estimation of passenger trip demand <strong>by</strong> other modes ensures consistency<br />
at the level of NUTS 3 regions with regard to originating <strong>trips</strong>.<br />
The distribution model applies a gravity model to compute the distribution of generated<br />
origin <strong>trips</strong> <strong>by</strong> rail and <strong>car</strong> to respective destinations.<br />
At the level of O/D relations, the mode choice model computes the shares of passenger <strong>trips</strong><br />
<strong>by</strong> rail and <strong>car</strong> in relation to the respective travel costs for both modes.<br />
Finally, the assignment model computes the networks loads for rail and <strong>car</strong> based on the<br />
previous computed trip matrices which distinguishes four purposes and the two modes rail<br />
and <strong>car</strong>. At the level of networks links the comparison of observed AADTs with modelled<br />
loads enables a refinement of previous sub-models of the 4-step model (feedback-loop).
Further information is available in the <strong>ETIS</strong><strong>plus</strong> <strong>Passenger</strong> Model documentation.<br />
5.2 Data Sources<br />
Several data sources were exploited such as national travel surveys and passenger<br />
transport statistics on the European or National level. Based on the observed data several<br />
key indicators were derived such as „passenger <strong>trips</strong> per capita <strong>by</strong> country, purpose and<br />
mode‟ and „passenger mileage <strong>by</strong> country, purpose and mode‟.<br />
Further information is available in the <strong>ETIS</strong><strong>plus</strong> <strong>Passenger</strong> Model documentation (section:<br />
harmonisation process).<br />
5.3 Results<br />
The following table summarises the number of inter-zonal passenger <strong>trips</strong> <strong>by</strong> <strong>car</strong> for every<br />
country. This indicator was calculated based on the G/A matrices. It covers only outward<br />
<strong>trips</strong> <strong>by</strong> <strong>car</strong> and not the return. For this reason, figures show only half of the trip demand.<br />
Country<br />
EU27<br />
<strong>Passenger</strong> outward <strong>trips</strong> <strong>by</strong> <strong>car</strong><br />
(inter-zonal)<br />
Austria 204,250,717<br />
Belgium 427,870,347<br />
Germany 2,332,516,312<br />
Denmark 90,812,847<br />
Spain 294,240,609<br />
Finland 62,018,305<br />
France 1,039,515,402<br />
Greece 117,651,034<br />
Ireland 72,013,240<br />
Italy 703,651,608<br />
Luxembourg (Grand-Duché) 12,802,222<br />
Netherlands 502,623,034<br />
Portugal 136,611,951<br />
Sweden 70,449,733<br />
United Kingdom 1,101,838,545<br />
Bulgaria 58,315,610<br />
Cyprus 61,017<br />
Czech Republic 135,804,334<br />
Estonia 6,758,946<br />
Hungary 87,746,345<br />
Lithuania 27,321,923<br />
Latvia 19,236,302<br />
Malta 1,605,833<br />
Poland 404,406,362<br />
Romania 158,646,351<br />
Slovenia 42,902,540<br />
Slovakia 59,075,115<br />
Candidate countries & EFTA<br />
Switzerland 188,900,316<br />
Iceland<br />
Liechtenstein 1,368,866<br />
Norway 72,121,040<br />
Croatia 58,294,060<br />
n.a.
Country<br />
<strong>Passenger</strong> outward <strong>trips</strong> <strong>by</strong> <strong>car</strong><br />
(inter-zonal)<br />
Former Yugoslav Republic of Macedonia, the 10,287,018<br />
Turkey 208,967,553<br />
Neighbouring countries<br />
Albania 12,849,620<br />
Bosnia and Herzegovina 29,758,832<br />
Montenegro 8,592,885<br />
Serbia and Kosovo 60,320,720<br />
The following table summarises modelled pkm for inter-zonal <strong>car</strong> passenger demand. This<br />
indicator was calculated based on the G/A matrices and corresponding network impedances<br />
for the O/D relation. It covers outward and return <strong>trips</strong> <strong>by</strong> <strong>car</strong>.<br />
Country<br />
EU27<br />
Modelled pkm<br />
(inter-zonal)<br />
Austria 38,057,179,294<br />
Belgium 62,553,806,894<br />
Germany 482,452,197,254<br />
Denmark 19,356,431,568<br />
Spain 127,752,753,512<br />
Finland 23,950,196,683<br />
France 296,031,410,578<br />
Greece 32,400,563,105<br />
Ireland 14,250,571,821<br />
Italy 178,802,613,858<br />
Luxembourg (Grand-Duché) 4,697,247,631<br />
Netherlands 73,112,433,466<br />
Portugal 32,949,489,864<br />
Sweden 26,812,027,742<br />
United Kingdom 165,331,515,889<br />
Bulgaria 15,507,595,290<br />
Cyprus 86,889,845<br />
Czech Republic 31,877,450,934<br />
Estonia 2,375,677,277<br />
Hungary 18,960,301,839<br />
Lithuania 6,864,861,500<br />
Latvia 4,688,774,949<br />
Malta 411,459,752<br />
Poland 90,387,208,739<br />
Romania 39,483,530,914<br />
Slovenia 7,278,705,010<br />
Slovakia 11,997,984,059<br />
Candidate countries & EFTA<br />
Switzerland 35,987,653,667<br />
Iceland<br />
Liechtenstein 380,682,700<br />
Norway 24,199,349,477<br />
Croatia 11,804,618,891<br />
Former Yugoslav Republic of Macedonia, the 1,816,720,052<br />
n.a.
Country<br />
Modelled pkm<br />
(inter-zonal)<br />
Turkey 72,945,545,469<br />
Neighbouring countries<br />
Albania 2,050,814,610<br />
Bosnia and Herzegovina 7,057,370,314<br />
Montenegro 1,206,648,585<br />
Serbia and Kosovo 11,229,896,729<br />
Country<br />
EU27<br />
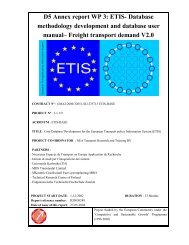
6. Final comparison<br />
Table and graph here below provide with an overview of the overall comparison between<br />
total pass-km <strong>by</strong> <strong>car</strong> (both intra and inter zonal) and the ETIF statistics for <strong>2010</strong>.<br />
Intra-zonal<br />
[Thousand mio<br />
pkm]<br />
Inter-zonal<br />
[Thousand mio<br />
pkm]<br />
Total<br />
[Thousand mio<br />
pkm]<br />
ETIF<br />
[Thousand mio<br />
pkm]<br />
Variation (%)<br />
Austria 33.39 38.1 71.4 73.00 -2%<br />
Belgium 43.93 62.6 106.5 109.10 -2%<br />
Germany 390.82 482.5 873.3 887.00 -2%<br />
Denmark 32.83 19.4 52.2 51.01 2%<br />
Spain 202.55 127.8 330.3 341.63 -3%<br />
Finland 42.46 24.0 66.4 64.75 3%<br />
France 435.15 296.0 731.2 727.30 1%<br />
Greece 71.20 32.4 103.6 99.60 4%<br />
Ireland 31.13 14.3 45.4 46.00 -1%<br />
Italy 528.51 178.8 707.3 700.21 1%<br />
Luxembourg (Grand-Duché) 2.18 4.7 6.9 6.50 6%<br />
Netherlands 67.24 73.1 140.4 141.20 -1%<br />
Portugal 49.05 32.9 82.0 83.70 -2%<br />
Sweden 73.00 26.8 99.8 99.21 1%<br />
United Kingdom 410.05 165.3 575.4 653.82 -12%<br />
Bulgaria 31.19 15.5 46.7 46.90 0%<br />
Cyprus 5.94 0.1 6.0 5.90 2%<br />
Czech Republic 35.41 31.9 67.3 63.57 6%<br />
Estonia 7.64 2.4 10.0 10.10 -1%<br />
Hungary 32.95 19.0 51.9 52.60 -1%<br />
Lithuania 23.76 6.9 30.6 29.92 2%<br />
Latvia 11.33 4.7 16.0 16.50 -3%<br />
Malta 1.65 0.4 2.1 2.20 -6%<br />
Poland 208.18 90.4 298.571 297.90 0%<br />
Romania 54.19 39.5 93.7 75.50 24%*<br />
Slovenia 16.81 7.3 24.1 25.64 -6%<br />
Slovakia 16.36 12.0 28.4 26.88 5%<br />
Candidate countries &<br />
EFTA<br />
Switzerland 50.65 36.0 86.6 85.55 1%<br />
Iceland n.a n.a n.a 4.80 n.a.<br />
Liechtenstein 0.08 0.4 0.4 n.a n.a<br />
Norway 36.49 24.2 60.7 59.84 1%
Country<br />
Intra-zonal<br />
[Thousand mio<br />
pkm]<br />
Inter-zonal<br />
[Thousand mio<br />
pkm]<br />
Total<br />
[Thousand mio<br />
pkm]<br />
ETIF<br />
[Thousand mio<br />
pkm]<br />
Variation (%)<br />
Croatia 15.52 11.8 27.3 25.70 6%<br />
Former Yugoslav Republic of<br />
Macedonia<br />
4.82 1.8 6.6 5.50 21%**<br />
Turkey 289.25 72.9 362.2 125.20 189%***<br />
Neighbouring countries<br />
Albania 4.38 2.1 6.4 n.a. n.a.<br />
Bosnia and Herzegovina 16.32 7.1 23.4 n.a. n.a.<br />
Montenegro 1.18 1.2 2.4 n.a. n.a.<br />
Serbia and Kosovo 26.15 11.23 37.38 n.a. n.a.<br />
*ETIF statistics for ROMANIA proved to be underestimated<br />
**ETIF statistics for FORMER YUGOSLAV REPUBLIC OF MACEDONIA proved to be underestimated<br />
**ETIF statistics for TURKEY proved to be underestimated
Source<br />
<strong>ETIS</strong>+<br />
ETIF<br />
<strong>ETIS</strong>+<br />
ETIF<br />
<strong>ETIS</strong>+<br />
ETIF<br />
<strong>ETIS</strong>+<br />
ETIF<br />
<strong>ETIS</strong>+<br />
ETIF<br />
<strong>ETIS</strong>+<br />
ETIF<br />
<strong>ETIS</strong>+<br />
ETIF<br />
<strong>ETIS</strong>+<br />
ETIF<br />
<strong>ETIS</strong>+<br />
ETIF<br />
<strong>ETIS</strong>+<br />
ETIF<br />
<strong>ETIS</strong>+<br />
ETIF<br />
<strong>ETIS</strong>+<br />
ETIF<br />
<strong>ETIS</strong>+<br />
ETIF<br />
<strong>ETIS</strong>+<br />
ETIF<br />
<strong>ETIS</strong>+<br />
ETIF<br />
<strong>ETIS</strong>+<br />
ETIF<br />
<strong>ETIS</strong>+<br />
ETIF<br />
<strong>ETIS</strong>+<br />
ETIF<br />
<strong>ETIS</strong>+<br />
ETIF<br />
<strong>ETIS</strong>+<br />
ETIF<br />
<strong>ETIS</strong>+<br />
ETIF<br />
<strong>ETIS</strong>+<br />
ETIF<br />
<strong>ETIS</strong>+<br />
ETIF<br />
<strong>ETIS</strong>+<br />
ETIF<br />
<strong>ETIS</strong>+<br />
ETIF<br />
<strong>ETIS</strong>+<br />
ETIF<br />
<strong>ETIS</strong>+<br />
ETIF<br />
<strong>ETIS</strong>+<br />
ETIF<br />
<strong>ETIS</strong>+<br />
ETIF<br />
<strong>ETIS</strong>+<br />
ETIF<br />
<strong>ETIS</strong>+<br />
ETIF<br />
<strong>ETIS</strong>+<br />
ETIF<br />
<strong>ETIS</strong>+<br />
ETIF<br />
Comparison between total pass-km <strong>by</strong> <strong>car</strong> and ETIF statistics - <strong>2010</strong><br />
1000<br />
<strong>Passenger</strong>-Kilometres <strong>by</strong> <strong>car</strong> - <strong>2010</strong><br />
900<br />
800<br />
700<br />
600<br />
500<br />
400<br />
ETIF PKM<br />
Inter zonal PKM<br />
Intra zonal PKM<br />
300<br />
200<br />
100<br />
0<br />
CountryAT BE DE DK ES FI FR GR IE IT LU NL PT SE UK BG CY CZ EE HU LT LV MT PL RO SI SK CH LI NO HR MK TR