D5 Annex report WP 3: ETIS Database methodology ... - ETIS plus
D5 Annex report WP 3: ETIS Database methodology ... - ETIS plus D5 Annex report WP 3: ETIS Database methodology ... - ETIS plus
D5 Annex WP 3: DATABASE METHODOLOGY AND DATABASE USER MANUAL – FREIGHT TRANSPORT DEMAND Distance Decay by Commodity 120 Propensity to Trade (Index) 100 80 60 40 20 Ores and Scrap Scientific Machinery 100 200 300 400 500 600 700 800 900 1000 1100 1200 1300 1400 1500 1600 1700 1800 1900 2000 Distance (Kms) The parameters calculated for these commodities indicate that distance decay is a relevant factor at the regional scale, with a high degree of impact between 200 and 1000 km. They also indicate that value density is a factor in determining the shape of the curve. The gravity model is used to estimate regionregion traffics which in turn, are then used to seed the O/D matrix and a furnessing algorithm is then used to constrain the matrix to its (known) row and column totals. The estimation of the ‘n’ and ‘m’ parameters depends on a multidimensional optimisation technique known as the downhill simplex method, or “amoeba”. 5 This is a relatively simple search algorithm that can be applied to a wide range of functional forms, such that the calling routines can specify parameter ranges, evaluation criteria and numerical precision. It does not involve the use of derivatives or statistical methods such as regression analysis. A test was carried out in which a version of the gravity formula was used to generate some ‘real’ data. A random number generator was then used to disturb these results within preset ranges, and these ‘sample’ points were then fed into a software routine that used the amoeba algorithm to detect the parameters. 5 Press WH, Teukolsky SA, Vetterling WT, Flannery BP, 1992, Numerical Recipes in C, Cambridge University Press 54 Document2 27 May 2004
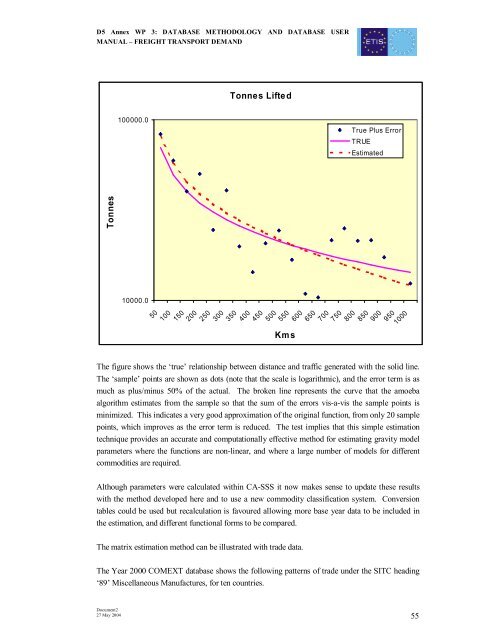
D5 Annex WP 3: DATABASE METHODOLOGY AND DATABASE USER MANUAL – FREIGHT TRANSPORT DEMAND Tonnes Lifte d 100000.0 True Plus Error TRUE Estimated Tonnes 10000.0 50 100 150 200 250 300 350 400 450 500 550 Km s 600 650 700 750 800 850 900 950 1000 The figure shows the ‘true’ relationship between distance and traffic generated with the solid line. The ‘sample’ points are shown as dots (note that the scale is logarithmic), and the error term is as much as plus/minus 50% of the actual. The broken line represents the curve that the amoeba algorithm estimates from the sample so that the sum of the errors visavis the sample points is minimized. This indicates a very good approximation of the original function, from only 20 sample points, which improves as the error term is reduced. The test implies that this simple estimation technique provides an accurate and computationally effective method for estimating gravity model parameters where the functions are nonlinear, and where a large number of models for different commodities are required. Although parameters were calculated within CASSS it now makes sense to update these results with the method developed here and to use a new commodity classification system. Conversion tables could be used but recalculation is favoured allowing more base year data to be included in the estimation, and different functional forms to be compared. The matrix estimation method can be illustrated with trade data. The Year 2000 COMEXT database shows the following patterns of trade under the SITC heading ‘89’ Miscellaneous Manufactures, for ten countries. Document2 27 May 2004 55
- Page 4 and 5: D5 Annex WP 3: DATABASE METHODOLOGY
- Page 7: D5 Annex WP 3: DATABASE METHODOLOGY
- Page 10 and 11: D5 Annex WP 3: DATABASE METHODOLOGY
- Page 12 and 13: D5 Annex WP 3: DATABASE METHODOLOGY
- Page 14 and 15: D5 Annex WP 3: DATABASE METHODOLOGY
- Page 16 and 17: D5 Annex WP 3: DATABASE METHODOLOGY
- Page 19 and 20: D5 Annex WP 3: DATABASE METHODOLOGY
- Page 21 and 22: D5 Annex WP 3: DATABASE METHODOLOGY
- Page 23 and 24: D5 Annex WP 3: DATABASE METHODOLOGY
- Page 25 and 26: D5 Annex WP 3: DATABASE METHODOLOGY
- Page 27 and 28: D5 Annex WP 3: DATABASE METHODOLOGY
- Page 29: D5 Annex WP 3: DATABASE METHODOLOGY
- Page 32 and 33: D5 Annex WP 3: DATABASE METHODOLOGY
- Page 34 and 35: D5 Annex WP 3: DATABASE METHODOLOGY
- Page 36 and 37: D5 Annex WP 3: DATABASE METHODOLOGY
- Page 38 and 39: D5 Annex WP 3: DATABASE METHODOLOGY
- Page 40 and 41: D5 Annex WP 3: DATABASE METHODOLOGY
- Page 43 and 44: D5 Annex WP 3: DATABASE METHODOLOGY
- Page 45 and 46: D5 Annex WP 3: DATABASE METHODOLOGY
- Page 47 and 48: D5 Annex WP 3: DATABASE METHODOLOGY
- Page 49 and 50: D5 Annex WP 3: DATABASE METHODOLOGY
- Page 51 and 52: D5 Annex WP 3: DATABASE METHODOLOGY
- Page 53: D5 Annex WP 3: DATABASE METHODOLOGY
- Page 57 and 58: D5 Annex WP 3: DATABASE METHODOLOGY
- Page 59 and 60: D5 Annex WP 3: DATABASE METHODOLOGY
- Page 61 and 62: D5 Annex WP 3: DATABASE METHODOLOGY
- Page 63 and 64: D5 Annex WP 3: DATABASE METHODOLOGY
- Page 65 and 66: D5 Annex WP 3: DATABASE METHODOLOGY
- Page 67: D5 Annex WP 3: DATABASE METHODOLOGY
- Page 71 and 72: D5 Annex WP 3: DATABASE METHODOLOGY
- Page 73 and 74: D5 Annex WP 3: DATABASE METHODOLOGY
- Page 75: D5 Annex WP 3: DATABASE METHODOLOGY
- Page 79 and 80: D5 Annex WP 3: DATABASE METHODOLOGY
- Page 81 and 82: D5 Annex WP 3: DATABASE METHODOLOGY
- Page 83 and 84: D5 Annex WP 3: DATABASE METHODOLOGY
- Page 85 and 86: D5 Annex WP 3: DATABASE METHODOLOGY
- Page 87 and 88: D5 Annex WP 3: DATABASE METHODOLOGY
- Page 89 and 90: D5 Annex WP 3: DATABASE METHODOLOGY
- Page 91 and 92: D5 Annex WP 3: DATABASE METHODOLOGY
- Page 93 and 94: D5 Annex WP 3: DATABASE METHODOLOGY
- Page 95 and 96: D5 Annex WP 3: DATABASE METHODOLOGY
- Page 97 and 98: D5 Annex WP 3: DATABASE METHODOLOGY
- Page 99 and 100: D5 Annex WP 3: DATABASE METHODOLOGY
- Page 101 and 102: D5 Annex WP 3: DATABASE METHODOLOGY
- Page 103 and 104: D5 Annex WP 3: DATABASE METHODOLOGY
<strong>D5</strong> <strong>Annex</strong> <strong>WP</strong> 3: DATABASE METHODOLOGY AND DATABASE USER<br />
MANUAL – FREIGHT TRANSPORT DEMAND<br />
Tonnes Lifte d<br />
100000.0<br />
True Plus Error<br />
TRUE<br />
Estimated<br />
Tonnes<br />
10000.0<br />
50<br />
100<br />
150<br />
200<br />
250<br />
300<br />
350<br />
400<br />
450<br />
500<br />
550<br />
Km s<br />
600<br />
650<br />
700<br />
750<br />
800<br />
850<br />
900<br />
950<br />
1000<br />
The figure shows the ‘true’ relationship between distance and traffic generated with the solid line.<br />
The ‘sample’ points are shown as dots (note that the scale is logarithmic), and the error term is as<br />
much as <strong>plus</strong>/minus 50% of the actual. The broken line represents the curve that the amoeba<br />
algorithm estimates from the sample so that the sum of the errors visavis the sample points is<br />
minimized. This indicates a very good approximation of the original function, from only 20 sample<br />
points, which improves as the error term is reduced. The test implies that this simple estimation<br />
technique provides an accurate and computationally effective method for estimating gravity model<br />
parameters where the functions are nonlinear, and where a large number of models for different<br />
commodities are required.<br />
Although parameters were calculated within CASSS it now makes sense to update these results<br />
with the method developed here and to use a new commodity classification system. Conversion<br />
tables could be used but recalculation is favoured allowing more base year data to be included in<br />
the estimation, and different functional forms to be compared.<br />
The matrix estimation method can be illustrated with trade data.<br />
The Year 2000 COMEXT database shows the following patterns of trade under the SITC heading<br />
‘89’ Miscellaneous Manufactures, for ten countries.<br />
Document2<br />
27 May 2004<br />
55


