D5 Annex report WP 4 - ETIS plus
D5 Annex report WP 4 - ETIS plus
D5 Annex report WP 4 - ETIS plus

Create successful ePaper yourself
Turn your PDF publications into a flip-book with our unique Google optimized e-Paper software.
<strong>D5</strong> <strong>Annex</strong> <strong>WP</strong> 4: <strong>ETIS</strong> DATABASE METHODOLOGY AND DATABASE USER<br />
MANUAL – PASSENGER DEMAND<br />
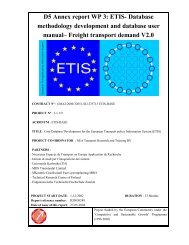
Figure 4.4<br />
International flows for France ( policy level) of the testing phase<br />
British Isles<br />
air 6743<br />
rail 1586<br />
road 4722<br />
Scandinavia<br />
air 1555<br />
rail 16<br />
road 842<br />
Central Europe<br />
air 3117<br />
rail 5202<br />
road 83686<br />
Eastern Europe<br />
air 970<br />
rail 19<br />
road 1287<br />
Southern Europe<br />
air 3377<br />
rail 717<br />
road 12586<br />
Iberian<br />
Peninsula<br />
air 1844<br />
rail 732<br />
road 11095<br />
As not in every country flow matrices will be available and there might be existing just link<br />
counts for roads, railway lines or airports offering just matrices is not useful. To gain their<br />
involvement into improving the flows generated within the testing phase to each country in<br />
addition assignment maps (and for air transport also a table) for all three modes will be handed<br />
out.<br />
Starting with air transport the assignment presented (again France as an example for this <strong>report</strong>)<br />
consists of the following map, where all airports we consider in a country are shown, sized by<br />
the amount of passengers they had in 2000. If data from Eurostat would cover all those airports<br />
– and they will do for the most airports when the starting phase of introducing the obligation to<br />
<strong>report</strong> airport figures to Eurostat from all EU countries has passed in some years – this step<br />
would not have been necessary. But up to now still not all (not only forthcoming) EU members<br />
<strong>report</strong> these figures to the EU.<br />
Passenger figures shown sum up the total amount of passengers (departing, arriving, transferring<br />
passengers) concerning the year 2000. Due to the large number of airports existing in some<br />
countries the airport results within the map are enriched by a table, where all considered airports<br />
of a country are listed with their passenger figures.<br />
Document3<br />
27 May 2004 37