D5 Annex report WP 4 - ETIS plus
D5 Annex report WP 4 - ETIS plus
D5 Annex report WP 4 - ETIS plus

You also want an ePaper? Increase the reach of your titles
YUMPU automatically turns print PDFs into web optimized ePapers that Google loves.
<strong>D5</strong> <strong>Annex</strong> <strong>WP</strong> 4: <strong>ETIS</strong> DATABASE METHODOLOGY AND DATABASE USER<br />
MANUAL – PASSENGER DEMAND<br />
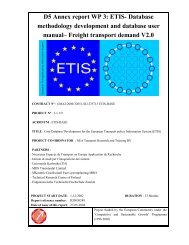
Table 4.1<br />
Data availability in <strong>WP</strong> 4 passenger demand.<br />
Data sources for<br />
calibrating passenger<br />
transport model results<br />
Austria<br />
Belgium<br />
Denmark<br />
Finland<br />
France<br />
Germany<br />
Greece<br />
Ireland<br />
Italy<br />
Luxembourg<br />
Netherlands<br />
Portugal<br />
Spain<br />
Sweden<br />
United Kingdom<br />
Norway<br />
Switzerland<br />
Austria A A RC A A P A A A A CP CP A A RC (R)P<br />
Belgium A RC A A CP CP CP A A CP CP A A RC CP<br />
Denmark A A A A A A A A A A A A<br />
Finland A A A RC RC RC RC RC RC A A RC<br />
France A A A A A A A A A A A A A<br />
Germany A A A A A A A A A A A A<br />
Greece CP CP CP CP CP A A RC P<br />
Ireland A CP CP CP CP A P RC P<br />
Italy (A) A A A A A A RC A<br />
Luxembourg P CP A A A RC P<br />
Netherlands A CP A A A RC A<br />
Portugal A A A RC CP<br />
Spain P A A A CP<br />
Sweden A (R) A<br />
United Kingdom P A A<br />
Norway<br />
Switzerland<br />
Traffic Information available for mode: Rail: R Car/Coach: C Plane: P All: A<br />
Unfortunately – but as expected the situation on the lower level is much worse than it seems<br />
from an aggregated level. Hence the obtained results especially for the southern part of Europe<br />
have to be regarded with care concerning the representativeness of generated transport patterns.<br />
RC<br />
(A)<br />
For the ten accession countries there were no other data available, like some basic figures<br />
concerning the total amount of mode specific traffic and selected passenger figures of airports.<br />
Therefore some of the data sources as described in section 5.2 are therefore of a special interest.<br />
To pick out just two examples, the IATA Digest on statistics covering traffic by flight stage and<br />
the ship pax statistics yearbooks are the only sources available for passenger flows to and from<br />
Malta and Cyprus. This not really satisfying situation drove us to develop the concept of a<br />
testing matrix, as described in the section 4.9.<br />
4.5 The MKmetric model approach<br />
Aware about the problems mentioned in the previous section, we decided to use an approach<br />
which was developed inhouse. This approach is mainly based on survey data and generates<br />
journeys in a twostep process. In the first step the trip rates per capita are estimated, while in<br />
the second step relationspecific proportions of aggregated trip volumes are quantified.<br />
The figure 5.1 gives a general overview about the structure of the model/ data generation<br />
process applied in this project. The generation process consists of three submodels that<br />
Document3<br />
27 May 2004 17