Influence of the Processes Parameters on the Properties of The ...
Influence of the Processes Parameters on the Properties of The ...
Influence of the Processes Parameters on the Properties of The ...
Create successful ePaper yourself
Turn your PDF publications into a flip-book with our unique Google optimized e-Paper software.
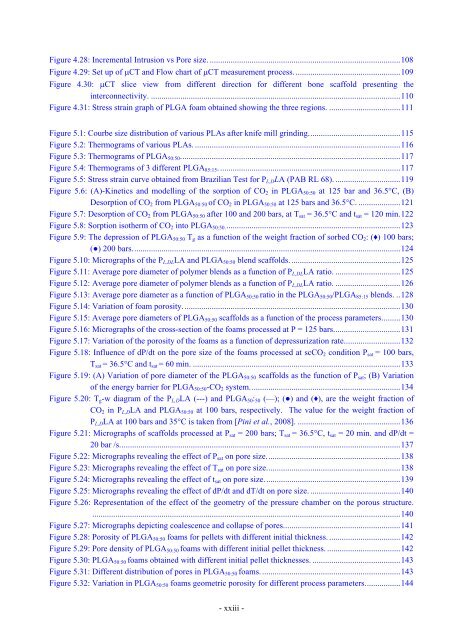
Figure 4.28: Incremental Intrusi<strong>on</strong> vs Pore size. ........................................................................................... 108<br />
Figure 4.29: Set up <str<strong>on</strong>g>of</str<strong>on</strong>g> CT and Flow chart <str<strong>on</strong>g>of</str<strong>on</strong>g> CT measurement process. .................................................. 109<br />
Figure 4.30: CT slice view from different directi<strong>on</strong> for different b<strong>on</strong>e scaffold presenting <str<strong>on</strong>g>the</str<strong>on</strong>g><br />
interc<strong>on</strong>nectivity. ....................................................................................................................... 110<br />
Figure 4.31: Stress strain graph <str<strong>on</strong>g>of</str<strong>on</strong>g> PLGA foam obtained showing <str<strong>on</strong>g>the</str<strong>on</strong>g> three regi<strong>on</strong>s. .................................. 111<br />
Figure 5.1: Courbe size distributi<strong>on</strong> <str<strong>on</strong>g>of</str<strong>on</strong>g> various PLAs after knife mill grinding. ........................................... 115<br />
Figure 5.2: <strong>The</strong>rmograms <str<strong>on</strong>g>of</str<strong>on</strong>g> various PLAs. .................................................................................................. 116<br />
Figure 5.3: <strong>The</strong>rmograms <str<strong>on</strong>g>of</str<strong>on</strong>g> PLGA 50:50 . ........................................................................................................ 117<br />
Figure 5.4: <strong>The</strong>rmograms <str<strong>on</strong>g>of</str<strong>on</strong>g> 3 different PLGA 85:15 . ...................................................................................... 117<br />
Figure 5.5: Stress strain curve obtained from Brazilian Test for P L,D LA (PAB RL 68). ............................... 119<br />
Figure 5.6: (A)-Kinetics and modelling <str<strong>on</strong>g>of</str<strong>on</strong>g> <str<strong>on</strong>g>the</str<strong>on</strong>g> sorpti<strong>on</strong> <str<strong>on</strong>g>of</str<strong>on</strong>g> CO 2 in PLGA 50:50 at 125 bar and 36.5°C, (B)<br />
Desorpti<strong>on</strong> <str<strong>on</strong>g>of</str<strong>on</strong>g> CO 2 from PLGA 50:50 <str<strong>on</strong>g>of</str<strong>on</strong>g> CO 2 in PLGA 50:50 at 125 bars and 36.5°C. .................... 121<br />
Figure 5.7: Desorpti<strong>on</strong> <str<strong>on</strong>g>of</str<strong>on</strong>g> CO 2 from PLGA 50:50 after 100 and 200 bars, at T sat = 36.5°C and t sat = 120 min. 122<br />
Figure 5.8: Sorpti<strong>on</strong> iso<str<strong>on</strong>g>the</str<strong>on</strong>g>rm <str<strong>on</strong>g>of</str<strong>on</strong>g> CO 2 into PLGA 50:50. ................................................................................... 123<br />
Figure 5.9: <strong>The</strong> depressi<strong>on</strong> <str<strong>on</strong>g>of</str<strong>on</strong>g> PLGA 50:50 T g as a functi<strong>on</strong> <str<strong>on</strong>g>of</str<strong>on</strong>g> <str<strong>on</strong>g>the</str<strong>on</strong>g> weight fracti<strong>on</strong> <str<strong>on</strong>g>of</str<strong>on</strong>g> sorbed CO 2 : (♦) 100 bars;<br />
(●) 200 bars. ............................................................................................................................... 124<br />
Figure 5.10: Micrographs <str<strong>on</strong>g>of</str<strong>on</strong>g> <str<strong>on</strong>g>the</str<strong>on</strong>g> P L,DL LA and PLGA 50:50 blend scaffolds. .................................................... 125<br />
Figure 5.11: Average pore diameter <str<strong>on</strong>g>of</str<strong>on</strong>g> polymer blends as a functi<strong>on</strong> <str<strong>on</strong>g>of</str<strong>on</strong>g> P L,DL LA ratio. ............................... 125<br />
Figure 5.12: Average pore diameter <str<strong>on</strong>g>of</str<strong>on</strong>g> polymer blends as a functi<strong>on</strong> <str<strong>on</strong>g>of</str<strong>on</strong>g> P L,DL LA ratio. ............................... 126<br />
Figure 5.13: Average pore diameter as a functi<strong>on</strong> <str<strong>on</strong>g>of</str<strong>on</strong>g> PLGA 50:50 ratio in <str<strong>on</strong>g>the</str<strong>on</strong>g> PLGA 50:50 /PLGA 85:15 blends. .. 128<br />
Figure 5.14: Variati<strong>on</strong> <str<strong>on</strong>g>of</str<strong>on</strong>g> foam porosity. ....................................................................................................... 130<br />
Figure 5.15: Average pore diameters <str<strong>on</strong>g>of</str<strong>on</strong>g> PLGA 50:50 scaffolds as a functi<strong>on</strong> <str<strong>on</strong>g>of</str<strong>on</strong>g> <str<strong>on</strong>g>the</str<strong>on</strong>g> process parameters. ........ 130<br />
Figure 5.16: Micrographs <str<strong>on</strong>g>of</str<strong>on</strong>g> <str<strong>on</strong>g>the</str<strong>on</strong>g> cross-secti<strong>on</strong> <str<strong>on</strong>g>of</str<strong>on</strong>g> <str<strong>on</strong>g>the</str<strong>on</strong>g> foams processed at P = 125 bars. ............................... 131<br />
Figure 5.17: Variati<strong>on</strong> <str<strong>on</strong>g>of</str<strong>on</strong>g> <str<strong>on</strong>g>the</str<strong>on</strong>g> porosity <str<strong>on</strong>g>of</str<strong>on</strong>g> <str<strong>on</strong>g>the</str<strong>on</strong>g> foams as a functi<strong>on</strong> <str<strong>on</strong>g>of</str<strong>on</strong>g> depressurizati<strong>on</strong> rate. .......................... 132<br />
Figure 5.18: <str<strong>on</strong>g>Influence</str<strong>on</strong>g> <str<strong>on</strong>g>of</str<strong>on</strong>g> dP/dt <strong>on</strong> <str<strong>on</strong>g>the</str<strong>on</strong>g> pore size <str<strong>on</strong>g>of</str<strong>on</strong>g> <str<strong>on</strong>g>the</str<strong>on</strong>g> foams processed at scCO 2 c<strong>on</strong>diti<strong>on</strong> P sat = 100 bars,<br />
T sat = 36.5°C and t sat = 60 min. ................................................................................................... 133<br />
Figure 5.19: (A) Variati<strong>on</strong> <str<strong>on</strong>g>of</str<strong>on</strong>g> pore diameter <str<strong>on</strong>g>of</str<strong>on</strong>g> <str<strong>on</strong>g>the</str<strong>on</strong>g> PLGA 50:50 scaffolds as <str<strong>on</strong>g>the</str<strong>on</strong>g> functi<strong>on</strong> <str<strong>on</strong>g>of</str<strong>on</strong>g> P sat ; (B) Variati<strong>on</strong><br />
<str<strong>on</strong>g>of</str<strong>on</strong>g> <str<strong>on</strong>g>the</str<strong>on</strong>g> energy barrier for PLGA 50:50 -CO 2 system. ....................................................................... 134<br />
Figure 5.20: T g -w diagram <str<strong>on</strong>g>of</str<strong>on</strong>g> <str<strong>on</strong>g>the</str<strong>on</strong>g> P L,D LA (---) and PLGA 50 : 50 (—); (●) and (♦), are <str<strong>on</strong>g>the</str<strong>on</strong>g> weight fracti<strong>on</strong> <str<strong>on</strong>g>of</str<strong>on</strong>g><br />
CO 2 in P L,D LA and PLGA 50:50 at 100 bars, respectively. <strong>The</strong> value for <str<strong>on</strong>g>the</str<strong>on</strong>g> weight fracti<strong>on</strong> <str<strong>on</strong>g>of</str<strong>on</strong>g><br />
P L,D LA at 100 bars and 35°C is taken from [Pini et al., 2008]. ................................................. 136<br />
Figure 5.21: Micrographs <str<strong>on</strong>g>of</str<strong>on</strong>g> scaffolds processed at P sat = 200 bars; T sat = 36.5°C, t sat = 20 min. and dP/dt =<br />
20 bar /s. ..................................................................................................................................... 137<br />
Figure 5.22: Micrographs revealing <str<strong>on</strong>g>the</str<strong>on</strong>g> effect <str<strong>on</strong>g>of</str<strong>on</strong>g> P sat <strong>on</strong> pore size. ............................................................... 138<br />
Figure 5.23: Micrographs revealing <str<strong>on</strong>g>the</str<strong>on</strong>g> effect <str<strong>on</strong>g>of</str<strong>on</strong>g> T sat <strong>on</strong> pore size. ............................................................... 138<br />
Figure 5.24: Micrographs revealing <str<strong>on</strong>g>the</str<strong>on</strong>g> effect <str<strong>on</strong>g>of</str<strong>on</strong>g> t sat <strong>on</strong> pore size. ................................................................ 139<br />
Figure 5.25: Micrographs revealing <str<strong>on</strong>g>the</str<strong>on</strong>g> effect <str<strong>on</strong>g>of</str<strong>on</strong>g> dP/dt and dT/dt <strong>on</strong> pore size. ........................................... 140<br />
Figure 5.26: Representati<strong>on</strong> <str<strong>on</strong>g>of</str<strong>on</strong>g> <str<strong>on</strong>g>the</str<strong>on</strong>g> effect <str<strong>on</strong>g>of</str<strong>on</strong>g> <str<strong>on</strong>g>the</str<strong>on</strong>g> geometry <str<strong>on</strong>g>of</str<strong>on</strong>g> <str<strong>on</strong>g>the</str<strong>on</strong>g> pressure chamber <strong>on</strong> <str<strong>on</strong>g>the</str<strong>on</strong>g> porous structure.<br />
................................................................................................................................................... 140<br />
Figure 5.27: Micrographs depicting coalescence and collapse <str<strong>on</strong>g>of</str<strong>on</strong>g> pores. ....................................................... 141<br />
Figure 5.28: Porosity <str<strong>on</strong>g>of</str<strong>on</strong>g> PLGA 50:50 foams for pellets with different initial thickness. .................................. 142<br />
Figure 5.29: Pore density <str<strong>on</strong>g>of</str<strong>on</strong>g> PLGA 50:50 foams with different initial pellet thickness. ................................... 142<br />
Figure 5.30: PLGA 50:50 foams obtained with different initial pellet thicknesses. .......................................... 143<br />
Figure 5.31: Different distributi<strong>on</strong> <str<strong>on</strong>g>of</str<strong>on</strong>g> pores in PLGA 50:50 foams. .................................................................. 143<br />
Figure 5.32: Variati<strong>on</strong> in PLGA 50:50 foams geometric porosity for different process parameters. ................ 144<br />
- xxiii -


