Influence of the Processes Parameters on the Properties of The ...
Influence of the Processes Parameters on the Properties of The ...
Influence of the Processes Parameters on the Properties of The ...

Create successful ePaper yourself
Turn your PDF publications into a flip-book with our unique Google optimized e-Paper software.
Chapter 5.<br />
Characterizati<strong>on</strong> <str<strong>on</strong>g>of</str<strong>on</strong>g> Scaffolds for C<strong>on</strong>nective Tissue Engineering<br />
<str<strong>on</strong>g>of</str<strong>on</strong>g> <str<strong>on</strong>g>the</str<strong>on</strong>g> new experiments <str<strong>on</strong>g>of</str<strong>on</strong>g> <str<strong>on</strong>g>the</str<strong>on</strong>g> Doehlert’ plan. All repeated results <str<strong>on</strong>g>of</str<strong>on</strong>g> <str<strong>on</strong>g>the</str<strong>on</strong>g> new Doehlert plan with <str<strong>on</strong>g>the</str<strong>on</strong>g> volume<br />
c<strong>on</strong>straint are presented in Table 5.21.<br />
Table 5.21: Complementary Doehlert’ design experiments.<br />
Exp. X 1 X 2 dP/dt (bar/s) P sat (bar) Pore Diameter (μm)<br />
1 0 0 2.5 125 8.4<br />
2 1 0 10 125 3.6<br />
3 0.5 0.866 5 150 5.0<br />
4 -0.5 0.866 1.25 150 26.9<br />
5 -1 0 0.625 125 187.25<br />
6 -0.5 -0.866 1.25 100 133.0 ; 127.9 ; 135.0<br />
7 0.5 -0.866 5 100 52.35 ; 51.0 ; 54.0<br />
In all cases, we have observed significant changes from <str<strong>on</strong>g>the</str<strong>on</strong>g> results <str<strong>on</strong>g>of</str<strong>on</strong>g> <str<strong>on</strong>g>the</str<strong>on</strong>g> initial Doehlert<br />
experiments. <strong>The</strong>se differences can be attributed to <str<strong>on</strong>g>the</str<strong>on</strong>g> change in <str<strong>on</strong>g>the</str<strong>on</strong>g> experimental setup. However, <str<strong>on</strong>g>the</str<strong>on</strong>g><br />
general observed behaviour for P sat and dP/dt is <str<strong>on</strong>g>the</str<strong>on</strong>g> same for initial and repetiti<strong>on</strong> experiments. <strong>The</strong><br />
maximum pore size is calculated according to <str<strong>on</strong>g>the</str<strong>on</strong>g> analysis <str<strong>on</strong>g>of</str<strong>on</strong>g> <str<strong>on</strong>g>the</str<strong>on</strong>g> Doehlert plan, and it has been found<br />
255.7μm. P sat = 100 bar and dP/dt = 0.625 bar/s have been taken as <str<strong>on</strong>g>the</str<strong>on</strong>g> parameters which give <str<strong>on</strong>g>the</str<strong>on</strong>g> maximum.<br />
This result is c<strong>on</strong>firmed by <str<strong>on</strong>g>the</str<strong>on</strong>g> experiment that we had been carried out and presented in Table 5.20 for <str<strong>on</strong>g>the</str<strong>on</strong>g><br />
last sample. As shown in Table 5.22, we have found that <str<strong>on</strong>g>the</str<strong>on</strong>g> effect <str<strong>on</strong>g>of</str<strong>on</strong>g> all factors is statically significant but<br />
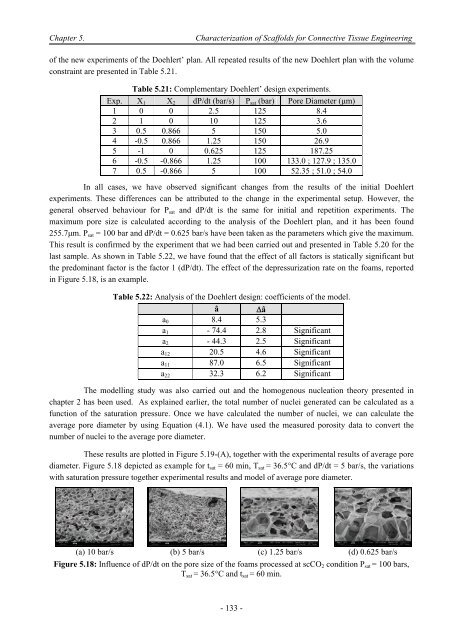
<str<strong>on</strong>g>the</str<strong>on</strong>g> predominant factor is <str<strong>on</strong>g>the</str<strong>on</strong>g> factor 1 (dP/dt). <strong>The</strong> effect <str<strong>on</strong>g>of</str<strong>on</strong>g> <str<strong>on</strong>g>the</str<strong>on</strong>g> depressurizati<strong>on</strong> rate <strong>on</strong> <str<strong>on</strong>g>the</str<strong>on</strong>g> foams, reported<br />
in Figure 5.18, is an example.<br />
Table 5.22: Analysis <str<strong>on</strong>g>of</str<strong>on</strong>g> <str<strong>on</strong>g>the</str<strong>on</strong>g> Doehlert design: coefficients <str<strong>on</strong>g>of</str<strong>on</strong>g> <str<strong>on</strong>g>the</str<strong>on</strong>g> model.<br />
â â<br />
a 0 8.4 5.3<br />
a 1 - 74.4 2.8 Significant<br />
a 2 - 44.3 2.5 Significant<br />
a 12 20.5 4.6 Significant<br />
a 11 87.0 6.5 Significant<br />
a 22 32.3 6.2 Significant<br />
<strong>The</strong> modelling study was also carried out and <str<strong>on</strong>g>the</str<strong>on</strong>g> homogenous nucleati<strong>on</strong> <str<strong>on</strong>g>the</str<strong>on</strong>g>ory presented in<br />
chapter 2 has been used. As explained earlier, <str<strong>on</strong>g>the</str<strong>on</strong>g> total number <str<strong>on</strong>g>of</str<strong>on</strong>g> nuclei generated can be calculated as a<br />
functi<strong>on</strong> <str<strong>on</strong>g>of</str<strong>on</strong>g> <str<strong>on</strong>g>the</str<strong>on</strong>g> saturati<strong>on</strong> pressure. Once we have calculated <str<strong>on</strong>g>the</str<strong>on</strong>g> number <str<strong>on</strong>g>of</str<strong>on</strong>g> nuclei, we can calculate <str<strong>on</strong>g>the</str<strong>on</strong>g><br />
average pore diameter by using Equati<strong>on</strong> (4.1). We have used <str<strong>on</strong>g>the</str<strong>on</strong>g> measured porosity data to c<strong>on</strong>vert <str<strong>on</strong>g>the</str<strong>on</strong>g><br />
number <str<strong>on</strong>g>of</str<strong>on</strong>g> nuclei to <str<strong>on</strong>g>the</str<strong>on</strong>g> average pore diameter.<br />
<strong>The</strong>se results are plotted in Figure 5.19-(A), toge<str<strong>on</strong>g>the</str<strong>on</strong>g>r with <str<strong>on</strong>g>the</str<strong>on</strong>g> experimental results <str<strong>on</strong>g>of</str<strong>on</strong>g> average pore<br />
diameter. Figure 5.18 depicted as example for t sat = 60 min, T sat = 36.5°C and dP/dt = 5 bar/s, <str<strong>on</strong>g>the</str<strong>on</strong>g> variati<strong>on</strong>s<br />
with saturati<strong>on</strong> pressure toge<str<strong>on</strong>g>the</str<strong>on</strong>g>r experimental results and model <str<strong>on</strong>g>of</str<strong>on</strong>g> average pore diameter.<br />
(a) 10 bar/s (b) 5 bar/s (c) 1.25 bar/s (d) 0.625 bar/s<br />
Figure 5.18: <str<strong>on</strong>g>Influence</str<strong>on</strong>g> <str<strong>on</strong>g>of</str<strong>on</strong>g> dP/dt <strong>on</strong> <str<strong>on</strong>g>the</str<strong>on</strong>g> pore size <str<strong>on</strong>g>of</str<strong>on</strong>g> <str<strong>on</strong>g>the</str<strong>on</strong>g> foams processed at scCO 2 c<strong>on</strong>diti<strong>on</strong> P sat = 100 bars,<br />
T sat = 36.5°C and t sat = 60 min.<br />
- 133 -