Influence of the Processes Parameters on the Properties of The ...
Influence of the Processes Parameters on the Properties of The ...
Influence of the Processes Parameters on the Properties of The ...

You also want an ePaper? Increase the reach of your titles
YUMPU automatically turns print PDFs into web optimized ePapers that Google loves.
Chapter 5.<br />
Characterizati<strong>on</strong> <str<strong>on</strong>g>of</str<strong>on</strong>g> Scaffolds for C<strong>on</strong>nective Tissue Engineering<br />
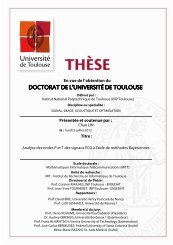
Figure 5.7: Desorpti<strong>on</strong> <str<strong>on</strong>g>of</str<strong>on</strong>g> CO 2 from PLGA 50:50 after 100 and<br />
200 bars, at T sat = 36.5°C and t sat = 120 min.<br />
Table 5.7 shows that <str<strong>on</strong>g>the</str<strong>on</strong>g> desorpti<strong>on</strong>-diffusi<strong>on</strong> coefficient <str<strong>on</strong>g>of</str<strong>on</strong>g> CO 2 is increasing, in <str<strong>on</strong>g>the</str<strong>on</strong>g> range<br />
between 10 -11 and 10 -9 , with <str<strong>on</strong>g>the</str<strong>on</strong>g> increase <str<strong>on</strong>g>of</str<strong>on</strong>g> <str<strong>on</strong>g>the</str<strong>on</strong>g> saturati<strong>on</strong> time. <strong>The</strong> desorpti<strong>on</strong>-diffusi<strong>on</strong> coefficient, D dp , has<br />
an increasing trend and finally reaches a plateau after 60 minutes for P sat = 125 bar and T sat = 36.5°C with a<br />
value <str<strong>on</strong>g>of</str<strong>on</strong>g> 2.10 -9 m 2 /s. <strong>The</strong>se data proves <str<strong>on</strong>g>the</str<strong>on</strong>g> change in <str<strong>on</strong>g>the</str<strong>on</strong>g> diffusi<strong>on</strong> coefficient with <str<strong>on</strong>g>the</str<strong>on</strong>g> variati<strong>on</strong> <str<strong>on</strong>g>of</str<strong>on</strong>g> CO 2<br />
sorpti<strong>on</strong> inside <str<strong>on</strong>g>the</str<strong>on</strong>g> polymer matrix. We can observe from Table 5.7 that <str<strong>on</strong>g>the</str<strong>on</strong>g> sorpti<strong>on</strong> <str<strong>on</strong>g>of</str<strong>on</strong>g> CO 2 into <str<strong>on</strong>g>the</str<strong>on</strong>g> polymer<br />
increases with increasing time until it reaches a plateau after 60 minutes. One can say that <str<strong>on</strong>g>the</str<strong>on</strong>g> capacity <str<strong>on</strong>g>of</str<strong>on</strong>g><br />
sorpti<strong>on</strong> increases with <str<strong>on</strong>g>the</str<strong>on</strong>g> sorpti<strong>on</strong> <str<strong>on</strong>g>of</str<strong>on</strong>g> CO 2 into <str<strong>on</strong>g>the</str<strong>on</strong>g> polymer.<br />
Table 5.7: Desorpti<strong>on</strong>-diffusi<strong>on</strong> coefficients and sorpti<strong>on</strong> <str<strong>on</strong>g>of</str<strong>on</strong>g> CO 2 after different saturati<strong>on</strong> times at saturati<strong>on</strong><br />
pressure 125 bars and saturati<strong>on</strong> temperature 36.5°C.<br />
t sat (min) D dp (m 2 Sorpti<strong>on</strong> <str<strong>on</strong>g>of</str<strong>on</strong>g> CO<br />
/ s)<br />
2 into <str<strong>on</strong>g>the</str<strong>on</strong>g> PLGA 50:50<br />
(g CO 2 / g Polymer)<br />
10 7.29 x 10 -11 0.153<br />
20 1.62 x 10 -10 0.195<br />
60 2.01 x 10 -9 0.270<br />
120 2.05 x 10 -9 0.281<br />
240 2.06 x 10 -9 0.281<br />
Also, as shown in Table 5.8, <str<strong>on</strong>g>the</str<strong>on</strong>g> desorpti<strong>on</strong>-diffusi<strong>on</strong> coefficient increases with increasing<br />
saturati<strong>on</strong> pressure. Since <str<strong>on</strong>g>the</str<strong>on</strong>g> density <str<strong>on</strong>g>of</str<strong>on</strong>g> CO 2 increases with <str<strong>on</strong>g>the</str<strong>on</strong>g> pressure, it is expected that <str<strong>on</strong>g>the</str<strong>on</strong>g> sorpti<strong>on</strong><br />
capacity increases with <str<strong>on</strong>g>the</str<strong>on</strong>g> increasing pressure. On <str<strong>on</strong>g>the</str<strong>on</strong>g> o<str<strong>on</strong>g>the</str<strong>on</strong>g>r hand, <str<strong>on</strong>g>the</str<strong>on</strong>g> desorpti<strong>on</strong>-diffusi<strong>on</strong> coefficients<br />
calculated for rubbery states, D dp , are always greater than <str<strong>on</strong>g>the</str<strong>on</strong>g> diffusi<strong>on</strong> coefficients after vitrificati<strong>on</strong>, D dg .<br />
Table 5.8: Desorpti<strong>on</strong>-diffusi<strong>on</strong> coefficients <str<strong>on</strong>g>of</str<strong>on</strong>g> CO 2 from PLGA 50:50 for plasticized and glassy states, after<br />
different saturati<strong>on</strong> pressures at 36.5°C for 120 min <str<strong>on</strong>g>of</str<strong>on</strong>g> saturati<strong>on</strong> time.<br />
P sat (bar) D dp (m 2 / s) D dg (m 2 / s)<br />
55 1.437 x 10 -10 -<br />
80 1.734 x 10 -10 -<br />
100 2.140 x 10 -9 2.321 x 10 -11<br />
125 2.050 x 10 -9 7.727 x 10 -11<br />
150 2.606 x 10 -9 1.753 x 10 -10<br />
200 3.321 x 10 -9 2.854 x 10 -10<br />
- 122 -