Influence of the Processes Parameters on the Properties of The ...
Influence of the Processes Parameters on the Properties of The ...
Influence of the Processes Parameters on the Properties of The ...

You also want an ePaper? Increase the reach of your titles
YUMPU automatically turns print PDFs into web optimized ePapers that Google loves.
Chapter 5.<br />
Characterizati<strong>on</strong> <str<strong>on</strong>g>of</str<strong>on</strong>g> Scaffolds for C<strong>on</strong>nective Tissue Engineering<br />
0,1800<br />
Weight variati<strong>on</strong> <str<strong>on</strong>g>of</str<strong>on</strong>g> PLGA50:50 (g)<br />
0,1780<br />
0,1760<br />
0,1740<br />
0,1720<br />
0,1700<br />
0,1680<br />
0,1660<br />
(A)<br />
0,1640<br />
0,00 10,00 20,00 30,00<br />
√t (√s)<br />
(B)<br />
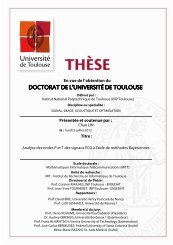
Figure 5.6: (A)-Kinetics and modelling <str<strong>on</strong>g>of</str<strong>on</strong>g> <str<strong>on</strong>g>the</str<strong>on</strong>g> sorpti<strong>on</strong> <str<strong>on</strong>g>of</str<strong>on</strong>g> CO 2 in PLGA 50:50 at 125 bar and 36.5°C, (B)<br />
Desorpti<strong>on</strong> <str<strong>on</strong>g>of</str<strong>on</strong>g> CO 2 from PLGA 50:50 <str<strong>on</strong>g>of</str<strong>on</strong>g> CO 2 in PLGA 50:50 at 125 bars and 36.5°C.<br />
2.2 Desorpti<strong>on</strong>-Diffusi<strong>on</strong> Kinetics<br />
Desorpti<strong>on</strong> kinetics <str<strong>on</strong>g>of</str<strong>on</strong>g> CO 2 from PLGA 50:50 have been studied in order to analyze <str<strong>on</strong>g>the</str<strong>on</strong>g> amount <str<strong>on</strong>g>of</str<strong>on</strong>g><br />
CO 2 sorbed, but also to provide diffusi<strong>on</strong> data with different saturati<strong>on</strong> times and pressures. We must<br />
remember that <str<strong>on</strong>g>the</str<strong>on</strong>g> M t values used in desorpti<strong>on</strong> studies are different from <str<strong>on</strong>g>the</str<strong>on</strong>g> <strong>on</strong>es in sorpti<strong>on</strong> kinetics. In<br />
desorpti<strong>on</strong> kinetics, during <str<strong>on</strong>g>the</str<strong>on</strong>g> decrease <str<strong>on</strong>g>of</str<strong>on</strong>g> CO 2 weight, M t denotes <str<strong>on</strong>g>the</str<strong>on</strong>g> quantity <str<strong>on</strong>g>of</str<strong>on</strong>g> CO 2 present in <str<strong>on</strong>g>the</str<strong>on</strong>g><br />
polymer at time t, and it has been analyzed by <str<strong>on</strong>g>the</str<strong>on</strong>g> desorpti<strong>on</strong> method described previously. Only <str<strong>on</strong>g>the</str<strong>on</strong>g> M ∞<br />
value is found by <str<strong>on</strong>g>the</str<strong>on</strong>g> extrapolati<strong>on</strong> <str<strong>on</strong>g>of</str<strong>on</strong>g> <str<strong>on</strong>g>the</str<strong>on</strong>g> initial parts <str<strong>on</strong>g>of</str<strong>on</strong>g> desorpti<strong>on</strong> curve. On <str<strong>on</strong>g>the</str<strong>on</strong>g> o<str<strong>on</strong>g>the</str<strong>on</strong>g>r hand, <str<strong>on</strong>g>the</str<strong>on</strong>g> desorpti<strong>on</strong>diffusi<strong>on</strong><br />
coefficients are calculated using Fickian diffusi<strong>on</strong> from a plane sheet.<br />
Figure 5.7 presents desorpti<strong>on</strong> data as M t /M ∞ which is plotted against <str<strong>on</strong>g>the</str<strong>on</strong>g> √t/a 2 after processed<br />
with different saturati<strong>on</strong> pressures, 100 and 200 bars. Here, <str<strong>on</strong>g>the</str<strong>on</strong>g> factor “a” is corresp<strong>on</strong>ding to <str<strong>on</strong>g>the</str<strong>on</strong>g> semithickness<br />
<str<strong>on</strong>g>of</str<strong>on</strong>g> <str<strong>on</strong>g>the</str<strong>on</strong>g> polymer pellet and t = 0 s is <str<strong>on</strong>g>the</str<strong>on</strong>g> end <str<strong>on</strong>g>of</str<strong>on</strong>g> <str<strong>on</strong>g>the</str<strong>on</strong>g> saturati<strong>on</strong> period. It is obvious that <str<strong>on</strong>g>the</str<strong>on</strong>g> desorpti<strong>on</strong><br />
shows a linear behaviour until approximately 65% <str<strong>on</strong>g>of</str<strong>on</strong>g> <str<strong>on</strong>g>the</str<strong>on</strong>g> total amount <str<strong>on</strong>g>of</str<strong>on</strong>g> CO 2 sorbed. After that value, <str<strong>on</strong>g>the</str<strong>on</strong>g><br />
experimental data diverges from <str<strong>on</strong>g>the</str<strong>on</strong>g> Fickian model. In <str<strong>on</strong>g>the</str<strong>on</strong>g> literature, this kind <str<strong>on</strong>g>of</str<strong>on</strong>g> behaviour is generally<br />
attributed to <str<strong>on</strong>g>the</str<strong>on</strong>g> vitrificati<strong>on</strong> <str<strong>on</strong>g>of</str<strong>on</strong>g> <str<strong>on</strong>g>the</str<strong>on</strong>g> polymer and <str<strong>on</strong>g>the</str<strong>on</strong>g> n<strong>on</strong>-Fickian diffusi<strong>on</strong> behaviour <str<strong>on</strong>g>of</str<strong>on</strong>g> <str<strong>on</strong>g>the</str<strong>on</strong>g> CO 2 from glassy<br />
polymers. This divergence is greater for <str<strong>on</strong>g>the</str<strong>on</strong>g> values <str<strong>on</strong>g>of</str<strong>on</strong>g> 100 bars than for <str<strong>on</strong>g>the</str<strong>on</strong>g> values <str<strong>on</strong>g>of</str<strong>on</strong>g> 200 bars. Additi<strong>on</strong>ally,<br />
<str<strong>on</strong>g>the</str<strong>on</strong>g> M t /M ∞ value <str<strong>on</strong>g>of</str<strong>on</strong>g> <str<strong>on</strong>g>the</str<strong>on</strong>g> desorpti<strong>on</strong> curve from 200 bars is smaller than <str<strong>on</strong>g>of</str<strong>on</strong>g> <str<strong>on</strong>g>the</str<strong>on</strong>g> 100 bars all across <str<strong>on</strong>g>the</str<strong>on</strong>g> time<br />
scale.<br />
Thus, <str<strong>on</strong>g>the</str<strong>on</strong>g> Fickian model <str<strong>on</strong>g>of</str<strong>on</strong>g> diffusi<strong>on</strong> has been applied for <str<strong>on</strong>g>the</str<strong>on</strong>g> regi<strong>on</strong>s <str<strong>on</strong>g>of</str<strong>on</strong>g> divergence. <strong>The</strong> model<br />
plotted (cf. Figure 5.7) is in a very good agreement with <str<strong>on</strong>g>the</str<strong>on</strong>g> experimental data. This behaviour can be<br />
explained by <str<strong>on</strong>g>the</str<strong>on</strong>g> double Fickian diffusi<strong>on</strong>. When <str<strong>on</strong>g>the</str<strong>on</strong>g> polymer changes its state from rubbery to glassy, <str<strong>on</strong>g>the</str<strong>on</strong>g><br />
diffusi<strong>on</strong> coefficient changes but <str<strong>on</strong>g>the</str<strong>on</strong>g> behaviour <str<strong>on</strong>g>of</str<strong>on</strong>g> diffusi<strong>on</strong> is assumed Fickian. As <str<strong>on</strong>g>of</str<strong>on</strong>g> this moment, we<br />
c<strong>on</strong>sider that <str<strong>on</strong>g>the</str<strong>on</strong>g> intersecti<strong>on</strong> <str<strong>on</strong>g>of</str<strong>on</strong>g> <str<strong>on</strong>g>the</str<strong>on</strong>g> extrapolati<strong>on</strong> <str<strong>on</strong>g>of</str<strong>on</strong>g> <str<strong>on</strong>g>the</str<strong>on</strong>g> sec<strong>on</strong>d curve with <str<strong>on</strong>g>the</str<strong>on</strong>g> initial curve gives <str<strong>on</strong>g>the</str<strong>on</strong>g><br />
vitrificati<strong>on</strong> point <str<strong>on</strong>g>of</str<strong>on</strong>g> <str<strong>on</strong>g>the</str<strong>on</strong>g> polymer. This point reflects <str<strong>on</strong>g>the</str<strong>on</strong>g> glass transiti<strong>on</strong> temperature <str<strong>on</strong>g>of</str<strong>on</strong>g> <str<strong>on</strong>g>the</str<strong>on</strong>g> polymer as <str<strong>on</strong>g>the</str<strong>on</strong>g><br />
drop <str<strong>on</strong>g>of</str<strong>on</strong>g> <str<strong>on</strong>g>the</str<strong>on</strong>g> temperature and <str<strong>on</strong>g>the</str<strong>on</strong>g> desorpti<strong>on</strong> curve <str<strong>on</strong>g>of</str<strong>on</strong>g> CO 2 . At 100 bars and 200 bars, we have 0.35 and 0.19<br />
for <str<strong>on</strong>g>the</str<strong>on</strong>g> M t /M ∞ , respectively. <strong>The</strong>se data corresp<strong>on</strong>d, to <str<strong>on</strong>g>the</str<strong>on</strong>g> weight fracti<strong>on</strong> <str<strong>on</strong>g>of</str<strong>on</strong>g> CO 2 in PLGA 50:50 <str<strong>on</strong>g>of</str<strong>on</strong>g> 0.082 and<br />
0.057, respectively. Hence, <str<strong>on</strong>g>the</str<strong>on</strong>g> corresp<strong>on</strong>ding vitrificati<strong>on</strong> time is 2.72 s and 2.64 s for 100 bars and 200<br />
bars, respectively. So, we have used <str<strong>on</strong>g>the</str<strong>on</strong>g> data and <str<strong>on</strong>g>the</str<strong>on</strong>g> model shown in Figure 5.7, to calculate <str<strong>on</strong>g>the</str<strong>on</strong>g> diffusi<strong>on</strong><br />
coefficients.<br />
- 121 -