Introduction to Unconstrained Optimization - Scilab
Introduction to Unconstrained Optimization - Scilab
Introduction to Unconstrained Optimization - Scilab

Create successful ePaper yourself
Turn your PDF publications into a flip-book with our unique Google optimized e-Paper software.
5<br />
4<br />
3<br />
2<br />
1<br />
Z<br />
0<br />
-1<br />
-2<br />
-3<br />
-4<br />
-5 5<br />
4<br />
3<br />
2 5<br />
1<br />
4<br />
0<br />
3<br />
Y<br />
2<br />
-1<br />
1<br />
-2<br />
0<br />
-1 X<br />
-3 -2<br />
-4<br />
-3<br />
-4<br />
-5 -5<br />
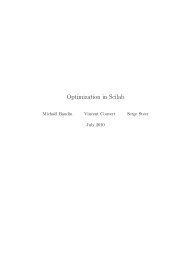
Figure 20: The non-convex function f(x 1 , x 2 ) = x 1 /(1 + x 2 2).<br />
since C is not a convex set.<br />
Finally, let us consider an example where the function f can define a convex set<br />
without being convex itself. Consider the bivariate function<br />
f(x 1 , x 2 ) = x 1 /(1 + x 2 2), (55)<br />
for any x = (x 1 , x 2 ) T ∈ R 2 The set of points satisfying the equation f(x 1 , x 2 ) ≥ 0<br />
is a convex set, since it simplifies <strong>to</strong> the equation x 1 ≥ 0. This inequality obviously<br />
defines a convex set (since the convex combination of two positive numbers is a<br />
positive number). But the function f is non-convex, as we are going <strong>to</strong> see. In order<br />
<strong>to</strong> see this, the most simple is <strong>to</strong> create a 3D plot of the function. The following<br />
script produces the 3D plot which is presented in the figure 20.<br />
function z = f ( x1 , x2 )<br />
z = x2 ./(1+ x2 ^2)<br />
endfunction<br />
x = linspace ( -5 ,5 ,20);<br />
y = linspace ( -5 ,5 ,20);<br />
Z = ( eval3d (f,x,y)) ’;<br />
surf (x,y,Z)<br />
h = gcf ();<br />
cmap = graycolormap (10);<br />
h. color_map = cmap ;<br />
The 3D plot suggests <strong>to</strong> search for the nonconvexity of the function on the line<br />
x 1 = 1, for example. On this section of the curve, we clearly see that the function is<br />
concave for x 2 = 0. This leads <strong>to</strong> the following <strong>Scilab</strong> session, where we define the two<br />
points a = (1, −1) T and b = (1, 1) T . Then we check that the point c = ta + (1 − t)b<br />
is so that the inequality f(c) > tf(a) + (1 − t)f(b) holds for t = 0.5.<br />
-->a = [1 ; -1];<br />
-->b = [1 ; 1];<br />
27