Introduction to Unconstrained Optimization - Scilab
Introduction to Unconstrained Optimization - Scilab
Introduction to Unconstrained Optimization - Scilab

You also want an ePaper? Increase the reach of your titles
YUMPU automatically turns print PDFs into web optimized ePapers that Google loves.
2.0<br />
1.5<br />
1.0<br />
100<br />
0.5<br />
500<br />
10<br />
500<br />
0.0<br />
1e+003<br />
2<br />
10<br />
-0.5<br />
2e+003<br />
100<br />
-1.0<br />
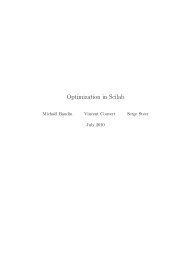
-2.0 -1.5 -1.0 -0.5 0.0 0.5 1.0 1.5 2.0<br />
Figure 3: Con<strong>to</strong>urs of Rosenbrock’s function.<br />
whatever the choice of x : this is because the exp function is so that e x → 0 as<br />
x → −∞.<br />
Let us plot several level sets of Rosenbrock’s function. To do so, we can use the<br />
con<strong>to</strong>ur function. One small issue is that the con<strong>to</strong>ur function expects a function<br />
which takes two variables x1 and x2 as input arguments. In order <strong>to</strong> pass <strong>to</strong> con<strong>to</strong>ur<br />
a function with the expected header, we define the rosenbrockC function, which<br />
takes the two separate variables x1 and x2 as input arguments. Then, it gathers the<br />
two parameters in<strong>to</strong> one column vec<strong>to</strong>r and delegates the work <strong>to</strong> the rosenbrock<br />
function.<br />
function f = rosenbrockC ( x1 , x2 )<br />
f = rosenbrock ( [x1 ,x2]’ )<br />
endfunction<br />
We can finally call the con<strong>to</strong>ur function and draw various level sets of Rosenbrock’s<br />
function.<br />
x1 = linspace ( -2 , 2 , 100 );<br />
x2 = linspace ( -1 , 2 , 100 );<br />
con<strong>to</strong>ur (x1 , x2 , rosenbrockC , [2 10 100 500 1000 2000] )<br />
This produces the figure 3.<br />
We can also create a 3D plot of Rosenbrock’s function. In order <strong>to</strong> use the surf<br />
function, we must define the auxiliary function rosenbrockS, which takes vec<strong>to</strong>rs of<br />
10