environmental implications of steel bridge construction
environmental implications of steel bridge construction
environmental implications of steel bridge construction

Create successful ePaper yourself
Turn your PDF publications into a flip-book with our unique Google optimized e-Paper software.
ENVIRONMENTAL IMPLICATIONS<br />
OF STEEL BRIDGE CONSTRUCTION<br />
Wim HOECKMAN a , Olivia NELIS b<br />
a<br />
Victor Buyck Steel Construction, Eeklo (B)<br />
a,b Vrije Universiteit Brussel (B)<br />
Abstract: Research has been carried out in order to determine the <strong>environmental</strong> impact <strong>of</strong><br />
<strong>steel</strong> <strong>bridge</strong> <strong>construction</strong> in terms <strong>of</strong> energy consumption and global warming potential. Five<br />
projects that have been completed recently were fully analysed with respect to the fabrication,<br />
corrosion protection, transport and erection phases. This research is a first in this area. This<br />
paper describes the general context as well as the research method that has been adopted. Finally<br />
the research results are presented and discussed.<br />
1. INTRODUCTION<br />
Sustainable <strong>construction</strong> can generally be defined and achieved by satisfying the following<br />
five criteria:<br />
1. Increase the lifetime;<br />
2. Limit material consumption;<br />
3. Use durable materials;<br />
4. Take into account the <strong>environmental</strong> impact <strong>of</strong> the <strong>construction</strong> process (incl.<br />
transport);<br />
5. Use the structure not only for its structural function (mainly for buildings).<br />
Steel <strong>bridge</strong>s have a long track record if it comes to the first three criteria. The design life<br />
<strong>of</strong> a (<strong>steel</strong>) <strong>bridge</strong> is generally 100 years. The potential durability <strong>of</strong> a <strong>steel</strong> <strong>bridge</strong> may be<br />
summarised in the following quote by top American <strong>bridge</strong> designer John A. L. Waddell in<br />
1921: “The life <strong>of</strong> a metal <strong>bridge</strong> that is scientifically designed, honestly and carefully built,<br />
and not seriously overloaded, if properly maintained, is indefinitely long.” Today, the lifetime<br />
<strong>of</strong> a <strong>steel</strong> <strong>bridge</strong> is very <strong>of</strong>ten determined by its fatigue resistance and its corrosion protection,<br />
see EN 1993-2 §4. Furthermore, the <strong>bridge</strong> components that do not have an equivalently long<br />
lifetime should be designed in such a way that they are replaceable (cables, bearings, expansion<br />
joints).<br />
Because <strong>of</strong> its strength properties, <strong>steel</strong> consumption can be really kept to a strict minimum.<br />
The further development <strong>of</strong> high strength <strong>steel</strong> grades will help to bring the <strong>steel</strong> consumption<br />
further down. As <strong>steel</strong> is a 100% fully recyclable material, it is also a great material<br />
with respect to natural resources. Once the ore is transformed into <strong>steel</strong>, it can be reused<br />
and/or recycled time after time.
Lately, and due to the global warming issue, every sector <strong>of</strong> the industry has been forced<br />
(sometimes by law, sometimes by contract, sometimes but rarely voluntarily) to determine<br />
and measure its <strong>environmental</strong> impact, mostly defined by the energy consumption (in GJ) and<br />
the CO2 emissions (in kg CO2 equivalent). Some other parameters, such as the ozone depletion<br />
potential and the acidification potential (to name only two), are sometimes also included.<br />
Based on these values, certain industries have developed important programmes to cut down<br />
their <strong>environmental</strong> impact through innovation and new processes.<br />
The western <strong>steel</strong> production industry (<strong>steel</strong> mills) has been the leader in the <strong>steel</strong> <strong>construction</strong><br />
sector. Today, through Environmental Product Declarations (EPD), the <strong>environmental</strong><br />
impact <strong>of</strong> most <strong>of</strong> the <strong>construction</strong> materials and products is known and available. They<br />
are “cradle to gate” and correspond with the mandatory information modules A.1 to A.3 <strong>of</strong><br />
EN 15804 [2].<br />
For fabricated structural <strong>steel</strong> products (other than standardised products such as sheeting,<br />
sandwich panels, etc.), this information is still not available in a detailed way. The main reason<br />
is related to the fact that the impact values for fabricated <strong>steel</strong> structures is very much depending<br />
on the degree <strong>of</strong> complexity <strong>of</strong> the structure, which can range from lightweight structures<br />
(handrails) over midweight structures (beams and columns for lightweight buildings) to<br />
heavyweight structures (beams and columns for heavy industrial buildings and high rise <strong>of</strong>fice<br />
buildings) and super heavyweight structures (such as heavily welded <strong>bridge</strong>s).<br />
In the industry, it has been assumed in the past that the <strong>environmental</strong> impact <strong>of</strong> the fabrication<br />
(and erection) process is only marginal if compared to the impact <strong>of</strong> the primary <strong>steel</strong><br />
production process in the mills. Recently, at the Vrije Universiteit Brussel, research has been<br />
done in order to determine the different steps <strong>of</strong> the fabrication and erection process and its<br />
<strong>environmental</strong> impact (in terms <strong>of</strong> energy consumption and global warming potential) [1].<br />
The research has started with the super heavyweight structures, which are (heavy) <strong>steel</strong> <strong>bridge</strong>s.<br />
More and more <strong>bridge</strong> owners (mostly the departments <strong>of</strong> Public Works and the national<br />
railway bodies) are conscious about the <strong>environmental</strong> impact <strong>of</strong> the infrastructure works they<br />
construct. Some <strong>of</strong> them have already implemented the requirement for contractors to be conscious<br />
about the CO2 emissions <strong>of</strong> their operations. ProRail, responsible for the Dutch railway<br />
network, has i.e. initiated the CO2 performance ladder [3], based on a fixed set <strong>of</strong> requirements:<br />
A. Insight (into own carbon footprint);<br />
B. CO2 reduction (recorded ambition);<br />
C. Transparency (internal and external communication);<br />
D. Participation in initiatives (with colleague companies in the field <strong>of</strong> CO2 reduction).<br />
A contractor can be classified into one <strong>of</strong> the five levels <strong>of</strong> the performance ladder. In order<br />
to qualify (and get certified) for level 3, the company is required to report on its scope 1<br />
(direct emissions) and 2 (indirect emissions such as due to electricity consumption and business<br />
travel) CO2 emissions in accordance with ISO 14064-1 and to have quantitatively formulated<br />
objectives for reducing these CO2 emissions. The company is also required to communicate<br />
the above mentioned objectives both internally and externally and to have an active<br />
role in (sector) initiatives relating to climate change.<br />
2
In order to qualify for the highest level 5, the company is required to demand a CO2 emissions<br />
inventory for scope 1 and 2 in accordance with ISO 14064-1 or equivalent from its A<br />
suppliers. Furthermore, the company should have, and should report upon, quantitative reduction<br />
objectives for scope 1, 2 and 3 (other indirect emissions such as due to paper use and<br />
waste disposal). The monitoring <strong>of</strong> progress with regard to these objectives has to be incorporated<br />
into the normal planning and control cycle. The company is required to commit itself<br />
publically to a CO2 reduction programme operated by the government or an NGO and to actively<br />
participate in the setting up and implementation <strong>of</strong> a (sector-wide) CO2 reduction programme<br />
in collaboration with the government and/or NGO.<br />
In evaluating tenders for <strong>construction</strong> works, ProRail translates the level <strong>of</strong> performance<br />
ladder into an ‘award advantage’. The higher the level on the certificate, the greater the advantage<br />
the company gains in the award weighting. If a company has been certified level 3,<br />
this (fictitious) advantage is 4%. For level 5, this is 10%.<br />
In order not to lose out on competition, it is therefore important for <strong>steel</strong>work contractors<br />
to master with this type <strong>of</strong> regulation. Victor Buyck Steel Construction (located in Eeklo-<br />
Belgium) has been one <strong>of</strong> the first <strong>steel</strong>work contractors to get certified level 3. As such, and<br />
in order to qualify for level 5, this <strong>steel</strong>work contractor has participated with the research into<br />
the <strong>environmental</strong> impact <strong>of</strong> the fabrication and erection <strong>of</strong> <strong>steel</strong> structures.<br />
2. RESEARCH APPROACH<br />
The research focuses on information modules A.4 and A.5 <strong>of</strong> EN 15804 [2], which represents<br />
the <strong>construction</strong> process stage (transport from <strong>steel</strong> mill to fabrication yard and the <strong>construction</strong><br />
& installation process).<br />
The whole fabrication and erection process has been divided into 5 groups <strong>of</strong> (in total 85)<br />
single activities and (roughly 200) individual factors:<br />
1. Fabrication<br />
including pre-blasting, preparation (oxy-cutting <strong>of</strong> plates, cutting <strong>of</strong> pr<strong>of</strong>iles, drilling,<br />
punching, assembling, welding, manipulation, etc.);<br />
2. Corrosion protection<br />
including blasting, painting, and (in case) metal spraying;<br />
3. Transport<br />
including both external transport (from the <strong>steel</strong> mills and to the <strong>construction</strong> site)<br />
and internal transport;<br />
4. Erection<br />
including site welding, gas and fuel consumption, cranes, etc.;<br />
5. Overhead<br />
which represents <strong>of</strong>fice consumption (electricity, heating) and heating, ventilation<br />
and lighting <strong>of</strong> the workshops.<br />
For each single activity, the energy consumption (expressed in MJ) and the global warming<br />
impact (expressed in kg CO2 equivalent) have been determined.
2.1 Conversion factors<br />
2.1.1 Machines and tools<br />
For machines working on electricity, the total energy E is expressed by Eq. (1):<br />
E = nϕ<br />
λ P [ kWh]<br />
(1.a)<br />
or E = 3.6<br />
nϕ<br />
λ P [ MJ]<br />
(1.b)<br />
where:<br />
P the declared power <strong>of</strong> the machine [kW];<br />
n the total number <strong>of</strong> working hours reported by the operator [h];<br />
λ the load factor, which is the percentage <strong>of</strong> the full capacity that has been used [%];<br />
ϕ the effectivity, expressing the effective working time <strong>of</strong> the machine divided by the<br />
reported working time <strong>of</strong> the operator [%].<br />
The global warming potential GWP is expressed by Eq. (2), which is based on [4]:<br />
GWP = 0.<br />
615 E [ kgC02eq]<br />
(2)<br />
where:<br />
E the total energy expressed by Eq. (1.a) in [kWh].<br />
Typical values <strong>of</strong> the load factor λ and the effectivity ϕ are shown in Table 1.<br />
Table 1: Typical values for the load factor and the efficiency<br />
Load factor Effectivity ϕ<br />
λ<br />
Cranes (workshop) 50% 60%<br />
Compressor (workshop) 30% 100%<br />
Ventilation (workshop) 100% 100%<br />
Plate oxy-cutting (workshop) 40% 100%<br />
Drilling, punching, sawing (workshop) 60% 70%<br />
2.1.2 Consumables (gas and other materials)<br />
The energy consumption E and global warming potential GWP have been derived from the<br />
recorded actual consumed quantities, using Eq. (3) to (13) which are based on [4] and [5]:<br />
E = .6 c pr<br />
m MJ<br />
(3)<br />
- For propane: 3<br />
o pro<br />
[ ]<br />
3.<br />
00m<br />
pro<br />
[ kgCO2eq]<br />
- For natural gas: 3.6<br />
c nat<br />
v na t<br />
[ MJ]<br />
1.83<br />
vnat<br />
[ kgCO2eq]<br />
- For acetylene: 3.6<br />
c ace<br />
vace<br />
[ MJ]<br />
2.<br />
471d ace<br />
vace<br />
[ kgCO2eq]<br />
- For diesel: 3.6<br />
c die<br />
vdie<br />
[ MJ]<br />
3.<br />
135vdie<br />
[ kgCO2eq]<br />
- For thinners: .064v<br />
[ kgCO2eq]<br />
GWP = (4)<br />
E = (5)<br />
GWP = (6)<br />
E = (7)<br />
GWP = (8)<br />
E = (9)<br />
GWP = (10)<br />
GWP = 0<br />
thi<br />
(11)<br />
- For the zinc metal spray (ZnAl 85/15) process:<br />
E = m MJ<br />
(12)<br />
68<br />
met<br />
4.80mmet<br />
[ ]<br />
[ kgCO2eq]<br />
GWP = (13)<br />
4
where the calorific value c and the density d <strong>of</strong> the consumables are given in Table 2. The<br />
consumed quantities were recorded in mass [kg] for propane (m pro ) and zinc metal spray<br />
(m met ), in volume [m 3 ] for natural gas (v nat ) and acetylene (v ace ), and in volume [l] for thinners<br />
(v thi ) and diesel (v die ).<br />
Table 2: Properties <strong>of</strong> consumables<br />
Calorific value<br />
c<br />
Density<br />
d<br />
Propane (pro) 14.99 kWh/kg -<br />
Natural gas (nat) 11.60 kWh/m 3 0.833 kg/m 3<br />
Acetylene (acy) 15.56 kWh/m 3 1.160 kg/m 3<br />
Diesel (die) 11.61 kWh/l -<br />
2.1.3 General consumptions<br />
Some consumables cannot be allocated to one project as they are used in a general way.<br />
Examples are natural gas for heating <strong>of</strong> <strong>of</strong>fices and workshops, electricity for ventilation,<br />
lighting and <strong>of</strong>fices and fuel for general transports.<br />
For each <strong>of</strong> these activities, the annual consumption <strong>of</strong> 2010 has been used as the basis to<br />
determine the project related portion. The portion has been proportional to the total <strong>steel</strong> consumption<br />
<strong>of</strong> the project (such as in the case <strong>of</strong> the electricity consumption in the <strong>of</strong>fices) or to<br />
the total number <strong>of</strong> recorded production hours (such as for the heating and ventilation <strong>of</strong> the<br />
workshops and the fuel consumption) or to a combination <strong>of</strong> both.<br />
2.1.4 Erection equipment<br />
The <strong>environmental</strong> impact <strong>of</strong> erection cranes, cherry pickers and other transport equipment<br />
(such as barges, ships and SPMT’s) has been derived from their actual fuel consumption.<br />
2.2 The projects<br />
The <strong>environmental</strong> impact has been determined for four <strong>bridge</strong>s and one lock project (all<br />
completed in 2010 and 2011), see also Table 3 for the main technical data and Fig. 1 to 6 for<br />
pictures:<br />
1. The road <strong>bridge</strong> over the Albert canal in Grobbendonk (B);<br />
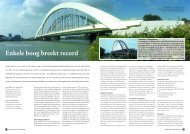
2. The railway <strong>bridge</strong>s over the river Nete in Duffel (B);<br />
3. The road <strong>bridge</strong> on rue d’Alsace in Luxemburg;<br />
4. The <strong>bridge</strong> de la Madeleine over the river Loire in Nantes (F);<br />
5. The mitre gates (and <strong>bridge</strong>) <strong>of</strong> the Kattendijk lock in Antwerp (B).<br />
Figure 1: Bridge over the Albert canal in Grobbendonk (B)
Steel<br />
consumption<br />
Dimensions<br />
Description<br />
Fabrication<br />
hours<br />
Corrosion<br />
protection<br />
system<br />
Distance<br />
workshop<br />
to site<br />
Transport<br />
to site<br />
Erection<br />
method<br />
Erection<br />
hours<br />
Table 3: Main technical data <strong>of</strong> the analysed projects<br />
Bridge<br />
Grobbendonk<br />
Bridge<br />
Duffel<br />
Bridge<br />
Luxemburg<br />
Bridge<br />
Nantes<br />
L = 109 m<br />
B = 18 m<br />
H = 15.5 m<br />
Mitre gates<br />
Kattendijk<br />
lock<br />
573 t 2,280 t 1,954 t 2,527 t (<strong>bridge</strong>) 254 t<br />
(doors) 417 t<br />
L = 110 m L = 122 m<br />
B = 13 m B = 18.5 m<br />
H = 20 m H = 20.5 m<br />
Bowstring;<br />
Fully welded;<br />
Concrete<br />
deck on <strong>steel</strong><br />
cross girders<br />
Bowstring;<br />
Fully<br />
welded;<br />
Orthotropic<br />
deck<br />
Bowstring;<br />
Bolted cross<br />
girders;<br />
Concrete<br />
deck<br />
L = 210.5 m<br />
B = 27.4 m<br />
H = 57 m<br />
(pylon)<br />
Cable stayed;<br />
Fully welded;<br />
Orthotropic<br />
deck<br />
(<strong>bridge</strong>)<br />
L = 69 m<br />
B = 13 m<br />
H = 5.4 m<br />
(doors)<br />
B = 14 m<br />
H = 9 - 12.5 m<br />
(<strong>bridge</strong>)<br />
Truss;<br />
Fully welded<br />
(gates)<br />
Fully welded<br />
25.3 h/t 22.0 h/t 10.4 h/t 23.5 h/t 35.7 h/t<br />
3 layers<br />
(240 µm)<br />
Zinc spray<br />
+ 2 layers<br />
(150 µm to<br />
240 µm)<br />
Zinc spray +<br />
2 layers<br />
(140 µm)<br />
or 3 layers<br />
(arch)<br />
(200 µm)<br />
3 layers<br />
(230 µm);<br />
interior <strong>of</strong><br />
pylon :<br />
1 layer<br />
(40 µm)<br />
(<strong>bridge</strong>)<br />
4 layers<br />
(340 µm)<br />
(doors)<br />
2 layers<br />
(500 µm)<br />
100 km 100 km 300 km 1,200 km 100 km<br />
Barge<br />
(over canals)<br />
Truck Truck Barge<br />
(over sea)<br />
Ship (doors)<br />
and barge<br />
(<strong>bridge</strong>)<br />
Fully completed<br />
in situ<br />
Float in Launching In situ Float in:<br />
direct placing<br />
6.2 h/t 9.9 h/t 6.2 h/t 5.4 h/t 2.4 h/t<br />
Figure 2: Railway <strong>bridge</strong>s over the river Nete in Duffel (B)<br />
6
Figure 3: Bridge rue d’Alsace in Luxemburg<br />
Figure 4: Bridge de la Madeleine over the river Loire in Nantes (F)<br />
Figure. 5: Mitre gates Kattendijk lock Antwerp (B)<br />
Figure 6: Bridge Kattendijk lock Antwerp (B)
3. RESEARCH RESULTS<br />
The total determined <strong>environmental</strong> impact values have been divided by the <strong>steel</strong> consumption<br />
so as to be able to compare the results. They are summarised in Table 4 and presented<br />
graphically in Fig. 7.<br />
Table 4: Environmental impact <strong>of</strong> <strong>steel</strong> <strong>construction</strong> (<strong>steel</strong> <strong>bridge</strong>s) during <strong>construction</strong> phase<br />
Bridge<br />
Grobbendonk<br />
Bridge<br />
Duffel<br />
Bridge<br />
rue d’Alsace<br />
Bridge<br />
Nantes<br />
Mitre gates<br />
Kattendijk<br />
lock<br />
kg<br />
MJ/t C02/t<br />
MJ/t<br />
kg<br />
C02/t MJ/t<br />
kg<br />
C02/t MJ/t<br />
kg<br />
C02/t MJ/t<br />
kg<br />
C02/t<br />
Fabrication 951 150 868 133 572 88 867 129 1,257 194<br />
Corrosion<br />
protection<br />
592 139 755 137 516 70 393 96 702 172<br />
Transport 625 47 224 17 416 31 2,722 204 678 51<br />
Erection 626 51 941 77 701 57 818 63 202 16<br />
Overhead 1,854 109 1,821 106 1,008 59 1,777 104 2,260 132<br />
TOTAL 4,648 496 4,609 470 3,213 305 6,577 596 5,099 565<br />
NOTE: In this Table kgC02 means kgC02eq.<br />
Figure 7: Environmental impact <strong>of</strong> <strong>steel</strong> <strong>bridge</strong> <strong>construction</strong>: (a) energy consumption (b) CO2 emission<br />
8
An important difference can be noticed between the <strong>environmental</strong> impact <strong>of</strong> the fully<br />
welded <strong>bridge</strong>s and the <strong>bridge</strong> that is partly bolted on site. If only the pure fabrication component<br />
is considered, the energy consumption is around 900 MJ/t for fully welded and 600 MJ/t<br />
for the partly bolted <strong>bridge</strong>. The global warming potential is roughly 140 kgCO2eq/t for the<br />
former and 90 kgCO2eq/t for the latter. If expressed in kgCO2eq/h, then these values become<br />
37.5 MJ/h and 5.8 kgCO2eq/h for the fully welded <strong>bridge</strong>s (with a very good correlation) and<br />
55 MJ/h and 8.5 kgCO2eq/h for the partly bolted <strong>bridge</strong>. These values take into account the<br />
rather important difference in complexity rate (expressed in fabrication hours per tonne).<br />
These values correspond very well with the fully welded components <strong>of</strong> the lock project.<br />
The values related to fabrication have to be increased with the overhead component, which<br />
is around 2,000 MJ/t and 110 kgCO2eq/t for the fully welded structures and 1,000 MJ/t and<br />
60 kgCO2eq/t for the partly bolted <strong>bridge</strong>, which is only half.<br />
As far as the erection component is concerned, it represents averagely 800 MJ/t and 63<br />
kgCO2eq/t for the fully welded <strong>bridge</strong>s (with a still relatively good correlation) and 700 MJ/t<br />
and 57 kgCO2eq/t for the partly bolted <strong>bridge</strong>. For the Kattendijk lock structures, with a minimum<br />
<strong>of</strong> erection because these structures were brought to the site fully completed (and could<br />
therefore be installed straight away), this component is considerably less: 200 MJ/t and 16<br />
kgCO2eq/t only.<br />
Due to the big differences in complexity and systems, it is not realistic to deduce systematic<br />
values for the corrosion protection component.<br />
If the transport component is considered, the values for the Nantes project are striking. The<br />
importance <strong>of</strong> the distance between the fabrication workshop and the <strong>construction</strong> is immediately<br />
revealed. From the research results, some typical values can be derived. Transport with<br />
inland navigation causes typically around 10 gCO2eq/km,t, trailer transport around 40<br />
gCO2eq/km,t. These values are only around half <strong>of</strong> those mentioned in the CO2 performance<br />
ladder emission tables. The sea transport for the Nantes project caused 85 gCO2eq/km,t (going<br />
journey). This value corresponds rather well with the mentioned published emission tables.<br />
If the return journey with empty barge is also taken into account (causing 60<br />
gCO2eq/km,t), then the total transport emission is 145 gCO2/km,t.<br />
If the overall <strong>environmental</strong> impact values are divided by the total number <strong>of</strong> hours (fabrication<br />
and erection), it seems that for the three fully welded <strong>bridge</strong>s the impact is very similar:<br />
around 130 MJ/h and around 14 kgCO2eq/h, excluding the transport component. For the partly<br />
bolted <strong>bridge</strong> project (which has considerably less hours per tonne), the values are only<br />
marginally higher: 170 MJ/h and 16.5 kgCO2eq/h.<br />
If the corrosion protection and transport components are not taken into account (because<br />
they depend on parameters that are predominately not related to fabrication and erection complexity),<br />
then it can be concluded that the impact values for the fully welded <strong>bridge</strong>s are 3,500<br />
MJ/t and 300 kgC02eq/t; for the partly bolted <strong>bridge</strong> this is 2,300 MJ/t and 200 kgCO2eq/t.<br />
For the lock structures these values are 3,700 MJ/t and 340 kgCO2eq/t.
4. CONCLUSIONS AND FUTURE DEVELOPMENTS<br />
1. The <strong>environmental</strong> impact values for the <strong>steel</strong> production <strong>of</strong> <strong>steel</strong> pr<strong>of</strong>iles and plates are<br />
7,300 to 12,350 MJ/t and 480 to 800 kgCO2eq/t. The lower bound values are based on<br />
51% recycled <strong>steel</strong> and 49% reuse [7], the higher bound values on 11% reuse [6]. For<br />
<strong>bridge</strong>s, the higher bound values seem to be more appropriate because reuse <strong>of</strong> <strong>steel</strong> components<br />
(after dismantling) seem to be very difficult. The <strong>environmental</strong> impact values for<br />
the fabrication and erection are generally less but certainly not negligible.<br />
2. The higher the degree <strong>of</strong> complexity is, the higher the <strong>environmental</strong> impact. Fully welded<br />
<strong>bridge</strong>s with orthotropic decks have a considerably higher impact than the partly bolted<br />
<strong>bridge</strong> with cross girders and concrete deck.<br />
3. The impact <strong>of</strong> the transport component becomes very important if large elements are transported<br />
over sea and over large distances. Transport for large projects, fully completed at<br />
one side <strong>of</strong> the world (e.g. in low cost countries) and shipped to the other side <strong>of</strong> the world,<br />
could typically cause CO2 emissions exceeding 1,000 kgCO2eq/t, far more than the whole<br />
production process.<br />
4. The research finds average values that are more in line with each other than expected. Further<br />
research could include:<br />
a. More data: analysis <strong>of</strong> the <strong>environmental</strong> impact <strong>of</strong> the <strong>steel</strong> production and erection<br />
process for more infrastructure projects executed by a range <strong>of</strong> <strong>steel</strong>work contractors;<br />
b. Wider range <strong>of</strong> structures: analysis <strong>of</strong> the <strong>environmental</strong> impact <strong>of</strong> other <strong>steel</strong> structures<br />
(lightweight to heavy-weight structures, going from handrailing to light industrial<br />
buildings, small to large <strong>of</strong>fice buildings and heavy industry buildings);<br />
c. Effective actions: research into ways <strong>of</strong> reducing the <strong>environmental</strong> impact. This can<br />
include the development <strong>of</strong> new types <strong>of</strong> paint (with less or no thinner consumption).<br />
d. Wider perspective: Research into the relation between what is achieved (i.e. <strong>bridge</strong><br />
span) and the <strong>environmental</strong> impact.<br />
References<br />
[1] Nelis O. Milieueffecten (potentieel van de opwarming van de aarde en energieverbruik)<br />
van het staalconstructieproces van stalen bruggen, Master thesis, Vrije Universiteit<br />
Brussel, Faculty <strong>of</strong> Engineering, Department <strong>of</strong> Civil Engineering, 2012.<br />
[2] EN 15804 Sustainability <strong>of</strong> <strong>construction</strong> works - Environmental product declarations -<br />
Core rules for the product category <strong>of</strong> <strong>construction</strong> products, CEN, version 2011/02.<br />
[3] Information on CO2 performance ladder via www.skao.nl.<br />
[4] Stichting Klimaatvriendelijk Aanbesteden & Ondernemen (SKAO) Handboek CO2-<br />
prestatieladder, version 2.0, 16 maart 2011.<br />
[5] Lijst emissiefactoren via www.milieubarometer.nl, January 2012.<br />
[6] Environmental Product Declaration according to ISO 14025 - Structural Steel: Sections<br />
and Plates, Declaration number EPD-BFS-2010111-E, Bauforumstahl, Düsseldorf, 6<br />
October 2011.<br />
[7] MRPI No. 9.1/00010/001 voor constructiestaal, Bouwen met Staal, Rotterdam, 14 July<br />
2003.<br />
10